. 2025 Jan 17;16(1):758.
doi: 10.1038/s41467-025-55929-4.

Regulation of enzymatic lipid peroxidation in osteoblasts protects against postmenopausal osteoporosis

Affiliations

Regulation of enzymatic lipid peroxidation in osteoblasts protects against postmenopausal osteoporosis

Qiong-Yi Zhang et al. Nat Commun. .

Abstract

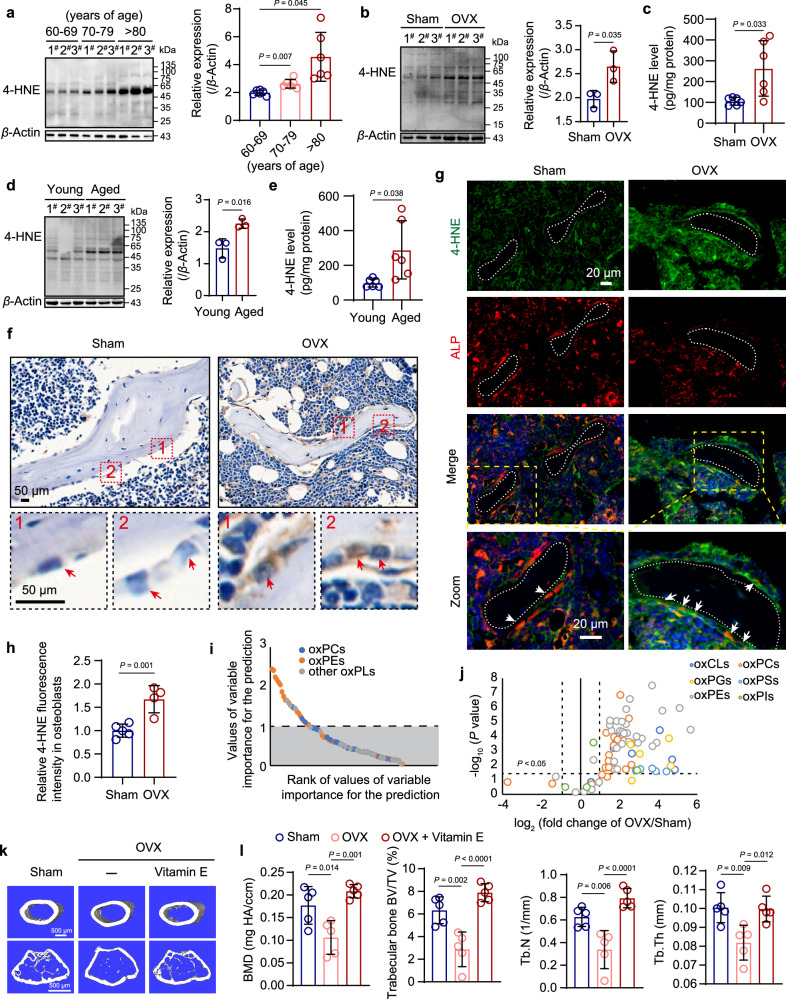
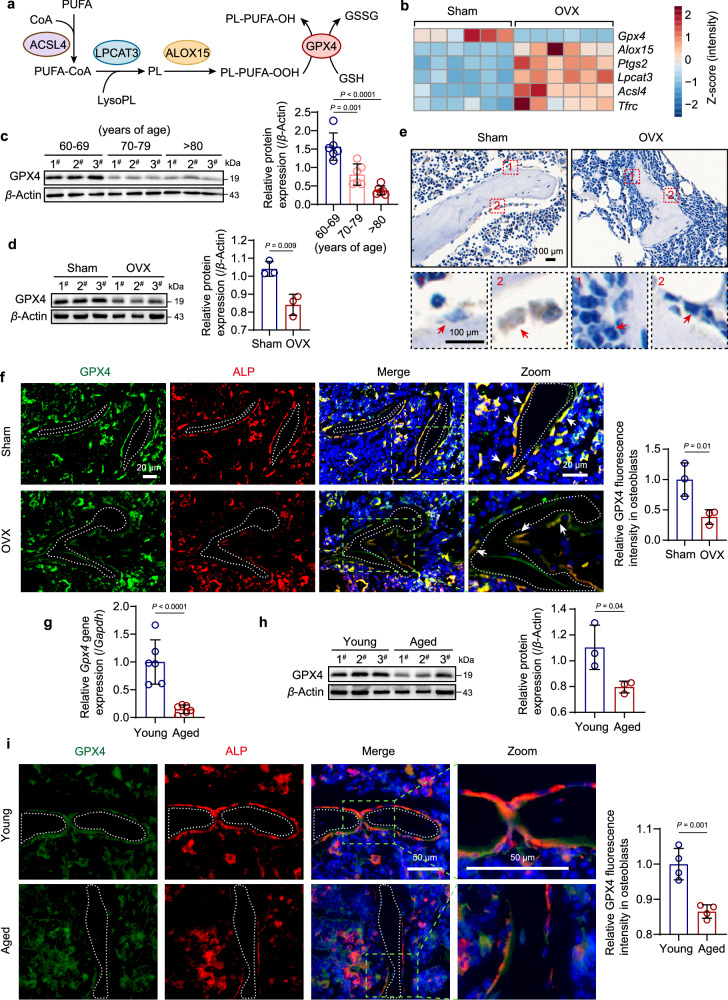
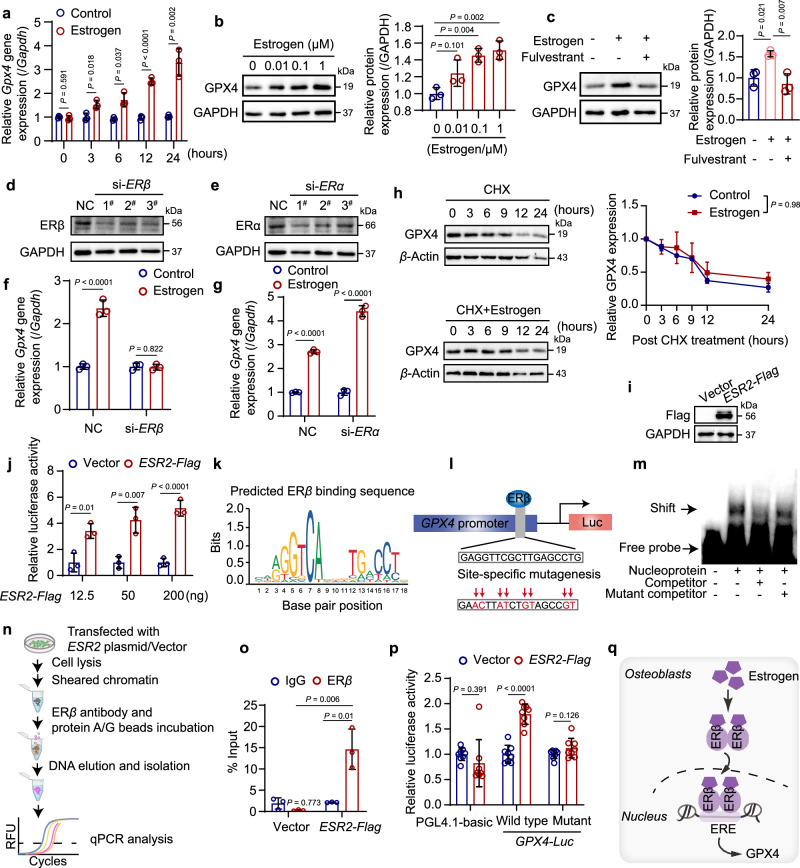
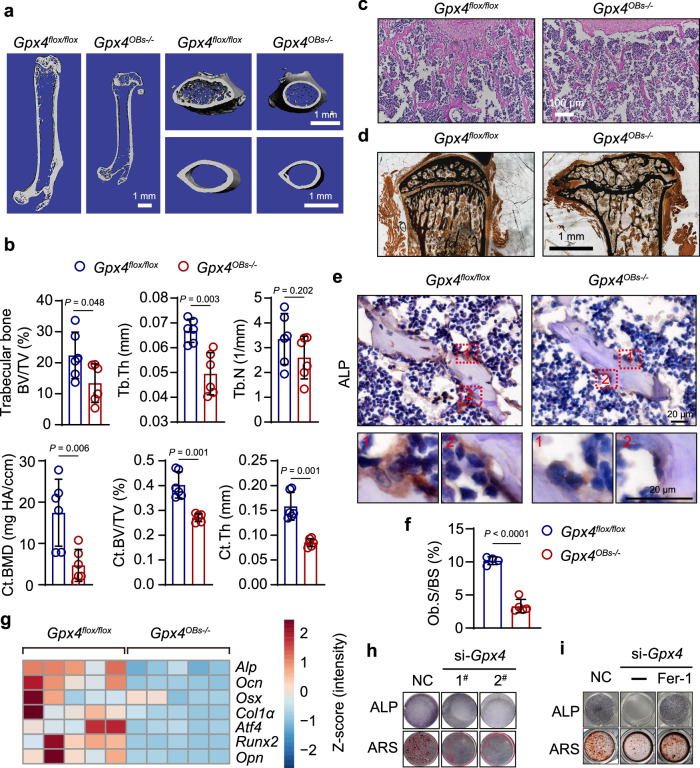
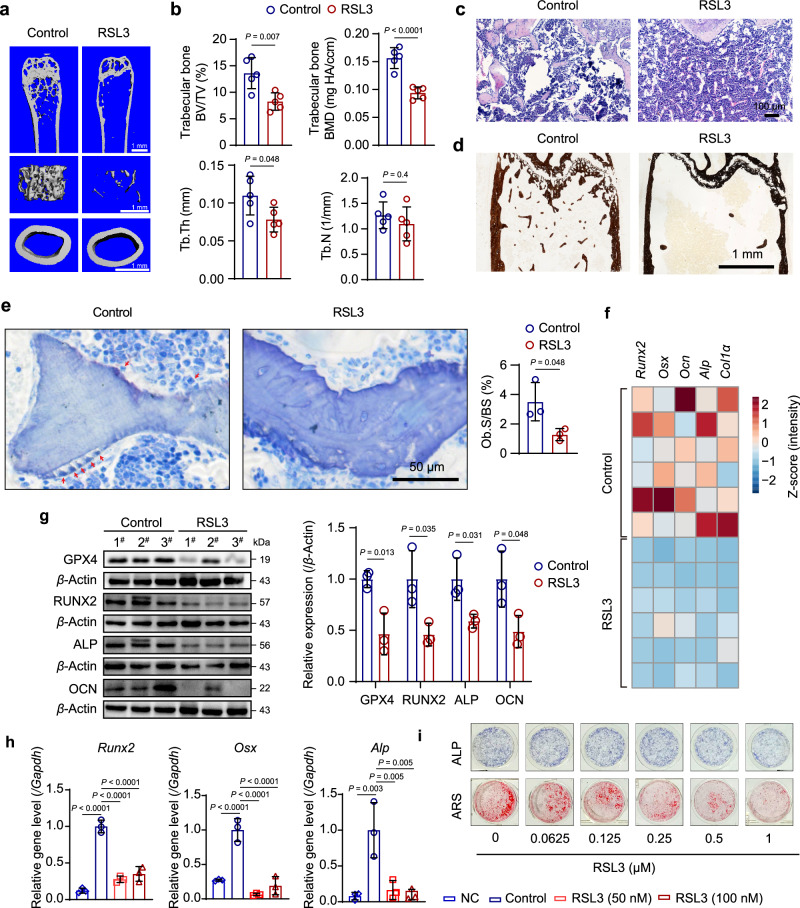
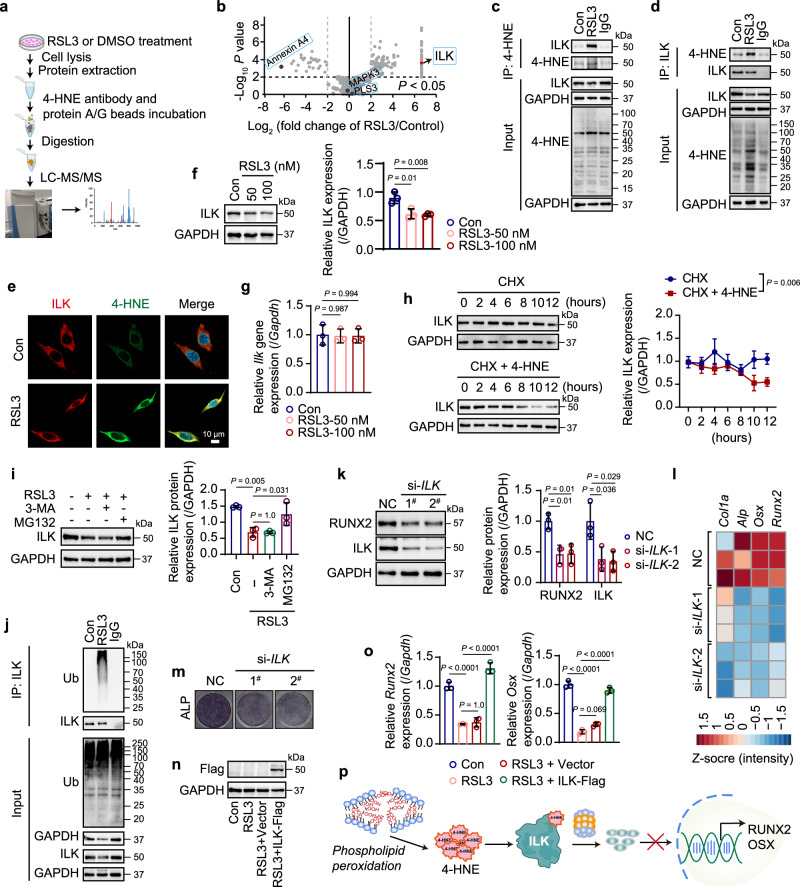
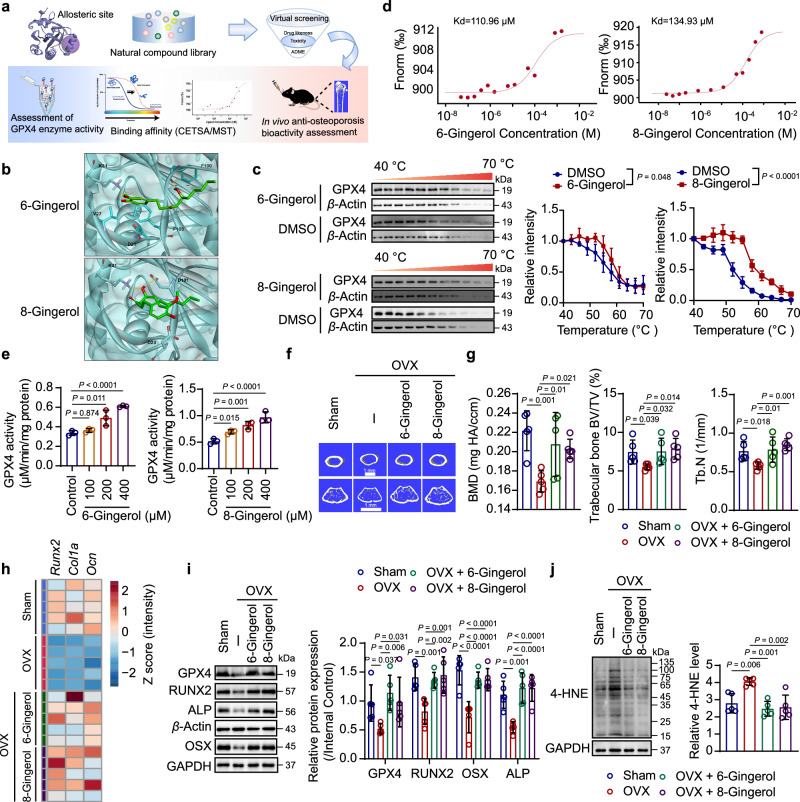
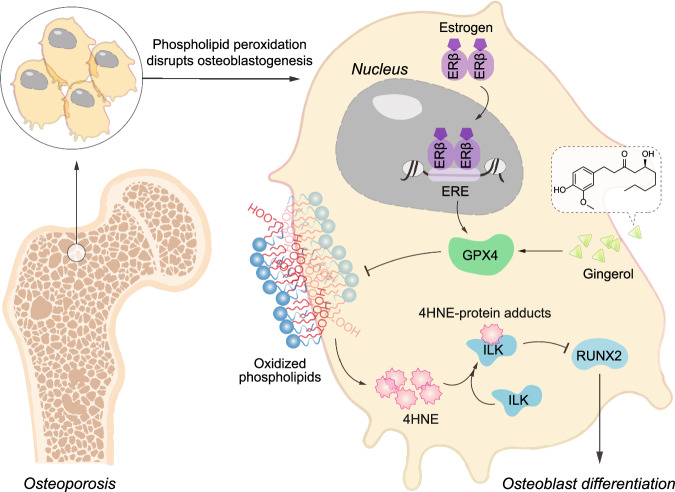
Oxidative stress plays a critical role in postmenopausal osteoporosis, yet its impact on osteoblasts remains underexplored, limiting therapeutic advances. Our study identifies phospholipid peroxidation in osteoblasts as a key feature of postmenopausal osteoporosis. Estrogen regulates the transcription of glutathione peroxidase 4 (GPX4), an enzyme crucial for reducing phospholipid peroxides in osteoblasts. The deficiency of estrogen reduces GPX4 expression and increases phospholipid peroxidation in osteoblasts. Inhibition or knockout of GPX4 impairs osteoblastogenesis, while the elimination of phospholipid peroxides rescues bone formation and mitigates osteoporosis. Mechanistically, 4-hydroxynonenal, an end-product of phospholipid peroxidation, binds to integrin-linked kinase and triggers its protein degradation, disrupting RUNX2 signaling and inhibiting osteoblastogenesis. Importantly, we identified two natural allosteric activators of GPX4, 6- and 8-Gingerols, which promote osteoblastogenesis and demonstrate anti-osteoporotic effects. Our findings highlight the detrimental role of phospholipid peroxidation in osteoblastogenesis and underscore GPX4 as a promising therapeutic target for osteoporosis treatment.


Conflict of interest statement

Competing interests: The authors declare no competing interests.

Figures

Fig. 1
Fig. 1. Excessive phospholipid peroxides accumulate in osteoporotic bone tissues of aged people and OVX mice.
a 4-HNE level in femurs of aged patients (n = 6 biologically independent samples). b 4-HNE level in long bone tissues of OVX and sham mice (n = 3 biologically independent samples). c 4-HNE content in bone tissues of OVX and sham mice detected by ELISA (n = 6 biologically independent samples). d 4-HNE level in femurs and tibias from both young (4 months) and aged (16 months) mice (n = 3 biologically independent samples). e 4-HNE content in bone tissues from both young (4 months) and aged (16 months) mice detected by ELISA (n = 6 biologically independent samples). f Representative immunohistochemical images of 4-HNE staining in femurs of mice. The red arrows indicated osteoblasts. Scale bar = 50 μm. g, h Representative immunofluorescence images and quantification of 4-HNE and ALP double staining in femurs of mice. 4-HNE (green), ALP (red) and DAPI (blue). The white arrow indicated double positive cells in trabecular bone. Scale bar = 20 μm. n = 5 (sham group), or 4 (OVX group) biologically independent samples. i The discriminative oxidized phospholipids are ranked in descending order by VIP scores. j Volcano plots of OVX-induced changes in oxPLs level log2 (fold change) versus significance (−log10 (P value)) by unpaired two-tailed t-test in bone tissues of sham and OVX mice (n = 6 biologically independent samples). oxCLs, oxidized cardiolipin. oxPCs, oxidized phosphatidylcholine. oxPEs, oxidized phosphatidylethanolamine. oxPGs, oxidized phosphatidylglycerol. oxPIs, oxidized phosphatidylinositol. oxPSs, oxidized phosphatidylserine. The significance in the volcano plot is defined by a fold change of more than 2 times and a P-value less than 0.05. k Representative micro-CT images showing the 3D microarchitecture of femurs from the indicated group. Scale bar = 500 μm. l Micro-CT measurements of BMD, BV/TV, Tb.N, Tb.Th in femurs, n = 5 independently biological samples. BMD, bone mineral density. BV/TV, ratio of bone volume to tissue volume. Tb.N, trabecular number. Tb.Th, trabecular thickness. Data are presented as means ± SD. Statistical analysis was performed with unpaired two-tailed t-test (be, h), one-way ANOVA with Tamheni test (a), Tukey’s post hoc test (l). Source data are provided as a Source Data file.
Fig. 2
Fig. 2. Dampened GPX4 expression in osteoblasts of OVX and aged mice.
a The schematic diagram of key enzymes involved in the production and reduction of lipid peroxidation. PUFA, polyunsaturated fatty acids. ACSL4, acyl-CoA synthetase long-chain family member 4. LPCAT3, lysophosphatidylcholine acyltransferase 3. ALOX15, 15-lipoxygenase. GPX4, glutathione peroxidase 4. PL, phospholipid. b Expression of lipid peroxidation-related genes in whole long bone from sham and OVX mice (n = 6 biologically independent samples). c Protein expression of GPX4 in femurs of female osteoporotic patients and its quantification (n = 6 biologically independent samples). d Protein level of GPX4 in whole long bone from OVX and sham mice and its quantification (n = 3 biologically independent samples). e Representative immunohistochemical images of GPX4 staining in femur from sham and OVX mice, scale bar = 100 μm. The dashed rectangles in red were enlarged and presented below, and the red arrow indicated osteoblasts. f Representative image of GPX4 and ALP double staining in femur from sham and OVX mice (left) and its quantification (right). GPX4 (green), ALP (red) and DAPI (blue), n = 3 biologically independent samples. Scale bar = 20 μm. The dashed rectangles in green were enlarged, and the white arrows indicated double positive cells in trabecular bone. g Relative mRNA expression of Gpx4 gene of aged (16 months) and young (4 months) mice (n = 6 biologically independent samples). h Protein expression of GPX4 in whole long bone from aged and young mice (left) and its quantification (right), n = 3 biologically independent samples. i Representative image of GPX4 and ALP double staining in femur from young (3 months) and aged (16 months) mice (left) and the quantification (right). GPX4 (green), ALP (red) and DAPI (blue), n = 4 biologically independent samples. Scale bar = 50 μm. The dashed rectangles in green were enlarged. OVX or sham surgery was performed on three-month-old mice. Tissue collection was conducted three months post-surgery. Data are presented as means ± SD. Statistical analysis was performed with unpaired two-tailed t-test (d, fi) or one-way ANOVA with Tukey’s post hoc test (c). Source data are provided as a Source Data file.
Fig. 3
Fig. 3. GPX4 transcription is regulated by estrogen/ERβ in osteoblasts.
a Relative mRNA expression of Gpx4 in MC3T3-E1 cells treated with estrogen (17β-estradiol, 1 μM) for different time periods (n = 3 independent cell culture preparations). b Protein level of GPX4 in MC3T3-E1 cells exposed to estrogen (17β-estradiol) at doses ranging from 10 nM to 1 μM for 24 hours (n = 3 independent cell culture preparations). c Effect of estrogen antagonist fulvestrant (1 μM) on GPX4 expression treated with estrogen (17β-estradiol, 1 μM), n = 3 independent cell culture preparations. d, e Validation of Esr2 (left) and Esr1 (right) siRNA sequences by western blot. f, g Relative mRNA expression of Gpx4 in MC3T3-E1 cells after knockdown of ERβ (left) or ERα (right), respectively (n = 3 independent cell culture preparations). h Protein expression of GPX4 in MC3T3-E1 cells treated with protein synthesis inhibitor (CHX, 100 μM) in the presence or absence of estrogen (17β-estradiol, 1 μM) (n = 3 independent cell culture preparations). Data are presented as means ± SEM. i Verification of ESR2-Flag plasmid by western blot. j Effect of ERβ on the activity of GPX4-luc reporter (n = 3 independent cell culture preparations). k Transcription factor ERβ binding sequence predicted in the JASPAR database. l Schematic diagram of GPX4 luciferase promoter. Luc, luciferase. m EMSA assays showing a direct interaction between ERβ protein and GPX4 E-box element. The experiment was repeated three times independently with similar results. n Workflow of ChIP experiment. o ChIP assays showing significant enrichment of ERβ at the E-box of GPX4 (n = 3 independent cell culture preparations). p Effect of ERβ on the activity of mutant GPX4-luc reporter (n = 8 independent cell culture preparations). q Schematic diagram illustrating the estrogen/ERβ-dependent transactivation of GPX4 expression. Data are presented as means ± SD unless specific description. Statistical analysis was performed with unpaired two-tailed t-test (a, fg, j, o, p) or one-way ANOVA with Tukey’s post hoc test (b, c), or two-way ANOVA (h). Source data are provided as a Source Data file.
Fig. 4
Fig. 4. Osteoblast-specific Gpx4 knockout or knockdown suppresses osteoblastogenesis.
a Representative micro-CT images of the three-dimensional long bone, trabecular bone, and cortical bone in femur of Gpx4OBs−/− mice and Gpx4flox/flox littermates. Scale bar = 1 mm. b Micro-CT measurements of Ct.BMD, Ct. BV/TV, Ct.Th, and BV/TV of trabecular bone, Tb.Th as well as Tb.N at the distal femur from Gpx4OBs−/− mice and Gpx4flox/flox mice (n = 6 independently biological samples). Ct.BMD, bone mass density of cortical bone. Ct. BV/TV, ratio of bone volume to total volume of cortical bone. Ct.Th, thickness of cortical bone. Trabecular bone BV/TV, ratio of bone volume to total volume of trabecular bone. Tb.Th, trabecular thickness. Tb.N, trabecular number. c Representative H&E staining images of femurs from Gpx4OBs−/− mice and Gpx4flox/flox mice. Scale bar = 100 μm. d Representative von Kossa staining images of femurs from Gpx4OBs−/− mice and Gpx4flox/flox mice. Scale bar = 1 mm. ef Representative ALP immunohistochemical images (e) and quantification (f) of femur from Gpx4OBs−/− mice and Gpx4flox/flox mice. Scale bar = 20 μm. n = 4 (Gpx4flox/flox mice group) or 5 (Gpx4OBs−/− mice group) biologically independent samples. g qPCR analysis of genes expression related to bone formation (n = 5 independently biological samples). The tissues were harvested from Gpx4OBs−/− and Gpx4flox/flox mice at two months of age. h ALP staining in 1 week of osteogenic induction and alizarin red staining of mineralized matrix in MC3T3-E1 cells after 3 weeks of osteogenic induction post knockdown of GPX4. i ALP staining in osteoblasts after 1 week of osteogenic induction and alizarin red staining of mineralized matrix in MC3T3-E1 cells after 3 weeks of osteogenic induction treated with GPX4 siRNA and ferrostatin-1 (Fer-1, 5 μM). Data are presented as means ± SD. Statistical analysis was performed with unpaired two-tailed t-test. Source data are provided as a Source Data file.
Fig. 5
Fig. 5. Inactivation of GPX4 by RSL3 inhibits osteogenic differentiation and disrupts bone formation.
a Representative micro-CT images of the three-dimensional microarchitecture of the long bone, trabecular bone and cortical bone of femurs from RSL3-treated mice and control mice (RSL3, 20 mg/kg, two months). Scale bar = 1 mm. b Micro-CT measurements of BMD, BV/TV, Tb.Th, Tb.N of femurs from RSL3-treated mice and control mice (n = 5 independently biological samples). BMD, bone mineral density. BV/TV, ratio of bone volume to tissue volume. Tb.Th, trabecular thickness. Tb.N, trabecular number. c Representative H&E staining images of femurs from both control and RSL3-treated mice (RSL3, 20 mg/kg, two months). Scale bar = 100 μm. d Representative von Kossa staining images of femurs from both control and RSL3-treated mice (RSL3, 20 mg/kg, two months). Scale bar = 1 mm. e Toluidine blue staining showing osteoblasts (red arrows indicated) (left) and the quantification (right) in the femurs of mice with RSL3 treatment for two months (n = 3 independently biological samples). Scale bar = 50 μm. f qPCR analysis of gene expression related to bone formation in the whole long bone tissues of mice with RSL3 treatment for two months (n = 6 independently biological samples). g Western blot analysis of GPX4, RUNX2, ALP, and OCN and the relative quantification in the whole long bone tissues of mice with RSL3 treatment for two months, n = 3 independently biological samples. RSL3 treatment was administered to nine-month-old mice, followed by tissue collection two months later. h Relative mRNA expression of Alp, Runx2, and Osx in MC3T3-E1 cells exposed to indicated concentration of RSL3 (n = 3 independently biological cell cultures). i. ALP staining in 1 week of osteogenic induction and alizarin red staining of mineralized matrix in mouse primary osteoblasts after 3 weeks osteogenic induction treated with indicated concentration of RSL3. Data were presented as means ± SD. Statistical analysis was performed with unpaired two-tailed t-test (be, g) or one-way ANOVA with Tamheni test (h). Source data are provided as a Source Data file.
Fig. 6
Fig. 6. Phospholipid peroxidation-caused 4-HNE modification of ILK dampens RUNX2 signaling.
a Workflow for immunoprecipitation-MS-based proteomic. b Volcano plots of LC-MS identified proteins in RSL3-treated group and control group. (log2 (fold change)) versus significance (-log10 (P value)) by unpaired two-tailed t-test. The significance in the volcano plot is defined by a fold change of more than 4 times and a P-value less than 0.01. c, d Co-IP assay determined the level of ILK conjugated with 4-HNE in MC3T3-E1 cells treated with RSL3 (50 nM, 24 hours). e Representative confocal images showing the colocalization of 4-HNE (green) and ILK (red) in MC3T3-E1 cells treated with RSL3 (50 nM, 6 hours). Scale bars = 10 μm. f ILK expression in MC3T3-E1 cells treated with RSL3 for 24 hours (n = 3 independent cell culture). g Ilk mRNA expression in MC3T3-E1 cells treated with RSL3 for 24 hours (n = 3 independent cell culture). h Turnover of ILK by CHX chase assay in MC3T3-E1 cells treated with or without 4-HNE (n = 3 independent cell culture). CHX, 100 μM; 4-HNE, 10 μM. i The effect of MG132 (5 μM) or 3-MA (20 μM) on the RSL3 (50 nM)-induced ILK protein level (n = 3 independent cell culture). j Ubiquitination of ILK assessed by immunoblotting in MC3T3-E1 cells with RSL3 treatment (50 nM, 24 hours). The experiment was repeated three times independently with similar results. k ILK and RUNX2 expression in MC3T3-E1 cells after ILK knockdown (n = 3 independent cell culture). l Bone-forming genes expression in MC3T3-E1 cells after ILK knockdown (n = 3 independent cell culture preparations). m ALP staining in 1-week osteogenic-induced MC3T3-E1 cells after ILK knockdown. n The verification of ILK overexpression. o Bone-forming genes expression in MC3T3-E1 cells treated with RSL3 and ILK overexpression plasmid (RSL3, 50 nM, 24 hours) (n = 3 independent cell culture preparations). p Schematic diagram illustrating that phospholipid peroxidation-derived 4-HNE binds to ILK, resulting in ILK degradation, disturbing bone formation. Data are presented as means ± SD. Statistical analysis is performed with one-way ANOVA with Tukey’s post hoc test (f, g, i, k, o) or two-way ANOVA (h). Source data are provided as a Source Data file.
Fig. 7
Fig. 7. Natural allosteric activators of GPX4 rescue osteogenesis and ameliorate osteoporosis.
a Workflow of GPX4 allosteric activator screening. b 6-, and 8-Gingerol predicted to bind with GPX4 protein by silico docking. The hydrogen bonds between the activator (green) and GPX4 (pale cyan, PDB entry 2OBI) are shown as orange lines. c Thermal stabilization of GPX4 in cell lysates incubated with DMSO or 6-, and 8-Gingerol (10 μM) determined by CETSA with heat treatment. Data were presented as the means ± SEM (n = 3 independent experiments). d The binding affinity between 6-Gingerol (Kd = 110.96 μM) or 8-Gingerol (Kd = 134.93 μM) and GPX4 examined by MST. e Effect of 6-, and 8-Gingerol on GPX4 enzyme activity (n = 3 independent samples). f Representative micro-CT images of the three-dimensional of trabecular bone and cortical bone in femur of mice treated with 6-, and 8-Gingerol. Scale bar = 1 mm. g Micro-CT measurements of BMD, BV/TV, Tb.N of distal femur of mice treated with 6-, and 8-Gingerol (n = 5 independently biological samples). BMD, bone mineral density. BV/TV, ratio of bone volume to tissue volume. Tb.N, trabecular number. h Expression of bone-forming genes in femurs of mice treated with 6-, and 8-Gingerol (n = 5 independently biological samples). i Protein expression of GPX4 and bone-forming proteins in femurs of mice treated with 6-, and 8-Gingerol (n = 5 independently biological samples). j 4-HNE level in the bone tissues of 6-, and 8-Gingerol-treated mice (n = 5 independently biological samples). Three-month-old mice received Gingerols one week after undergoing surgery. Bone tissues were collected after a 45-day treatment period. Data are presented as means ± SD unless specific description. Statistical analysis was performed with one-way ANOVA with Tukey’s post hoc test (e, j), LSD test (g, i), or two-way ANOVA (c). Source data are provided as a Source Data file.
Fig. 8
Fig. 8. The role of lipid peroxidation and its key regulator, GPX4, in osteoblasts-mediated bone formation.
Phospholipid peroxidation in osteoblasts plays a pivotal role in postmenopausal osteoporosis, driven by diminished estrogen-regulated GPX4 expression. The lipid peroxidation byproduct 4-HNE disrupts RUNX2 signaling through the degradation of ILK. While the natural GPX4 activators 6- and 8-Gingerols promote osteoblastogenesis and demonstrate significant anti-osteoporotic effects.

Similar articles

Cited by

References

    1. Manolagas, S. C. From estrogen-centric to aging and oxidative stress: a revised perspective of the pathogenesis of osteoporosis. Endocr Rev31, 266–300 (2010). - PMC - PubMed
    1. Hendrickx, G., Boudin, E. & Van Hul, W. A look behind the scenes: the risk and pathogenesis of primary osteoporosis. Nat Rev Rheumatol11, 462–474 (2015). - PubMed
    1. Riegger, J., Schoppa, A., Ruths, L., Haffner-Luntzer, M. & Ignatius, A. Oxidative stress as a key modulator of cell fate decision in osteoarthritis and osteoporosis: a narrative review. Cell Mol Biol Lett28, 76 (2023). - PMC - PubMed
    1. Agidigbi, T. S. & Kim, C. Reactive Oxygen Species in Osteoclast Differentiation and Possible Pharmaceutical Targets of ROS-Mediated Osteoclast Diseases. Int J Mol Sci20 (2019). - PMC - PubMed
    1. Reid, I. R. & Billington, E. O. Drug therapy for osteoporosis in older adults. Lancet399, 1080–1092 (2022). - PubMed

MeSH terms

LinkOut - more resources