. 2025 Jan 17;16(1):765.
doi: 10.1038/s41467-025-55908-9.

Interferon-α promotes HLA-B-restricted presentation of conventional and alternative antigens in human pancreatic β-cells

Affiliations

Interferon-α promotes HLA-B-restricted presentation of conventional and alternative antigens in human pancreatic β-cells

Alexia Carré et al. Nat Commun. .

Abstract

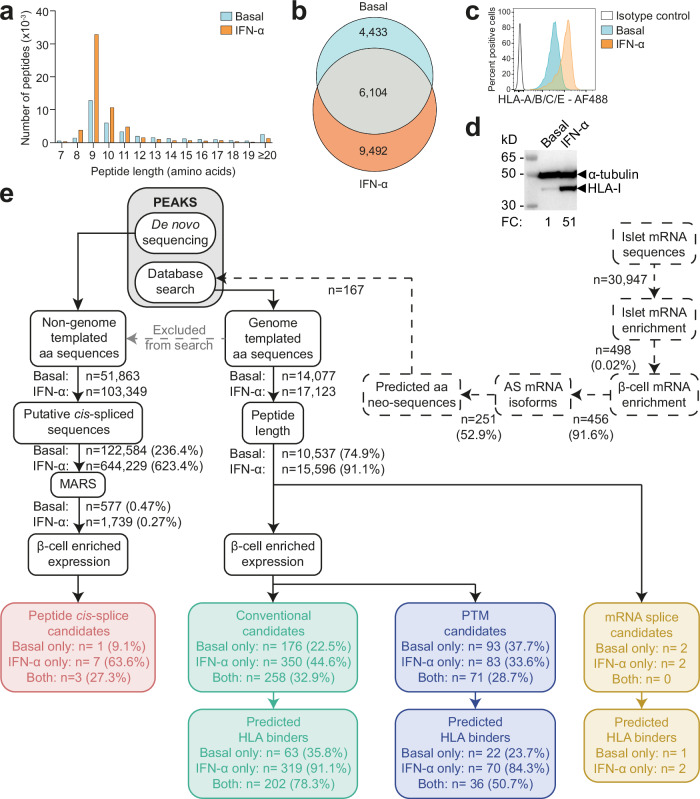
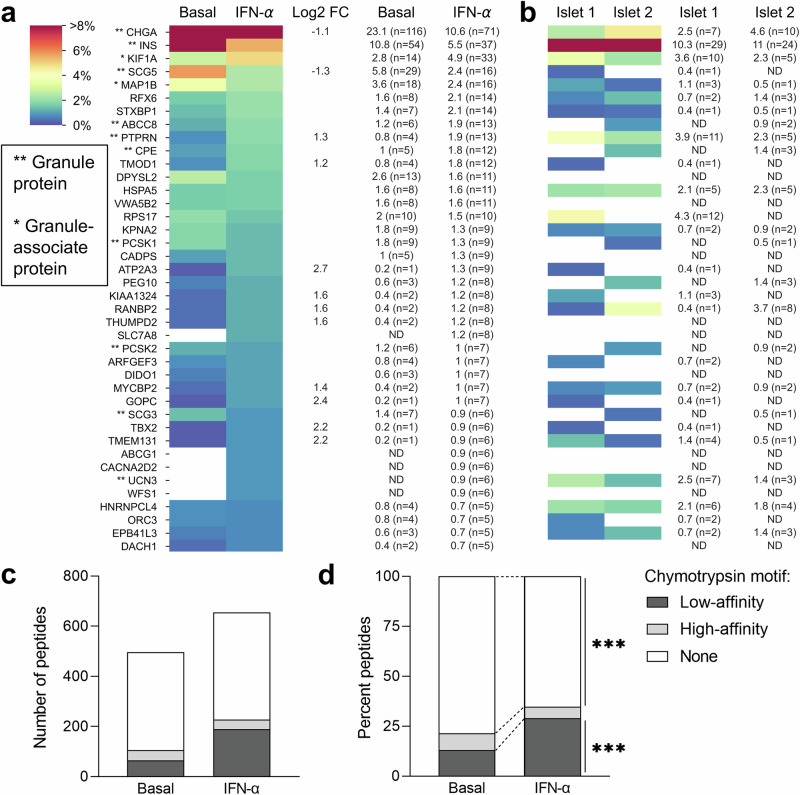
Interferon (IFN)-α is the earliest cytokine signature observed in individuals at risk for type 1 diabetes (T1D), but the effect of IFN-α on the antigen repertoire of HLA Class I (HLA-I) in pancreatic β-cells is unknown. Here we characterize the HLA-I antigen presentation in resting and IFN-α-exposed β-cells and find that IFN-α increases HLA-I expression and expands peptide repertoire to those derived from alternative mRNA splicing, protein cis-splicing and post-translational modifications. While the resting β-cell immunopeptidome is dominated by HLA-A-restricted peptides, IFN-α largely favors HLA-B and only marginally upregulates HLA-A, translating into increased HLA-B-restricted peptide presentation and activation of HLA-B-restricted CD8+ T cells. Lastly, islets of patients with T1D show preferential HLA-B hyper-expression when compared with non-diabetic donors, and islet-infiltrating CD8+ T cells reactive to HLA-B-restricted granule peptides are found in T1D donors. Thus, the inflammatory milieu of insulitis may skew the autoimmune response toward alternative epitopes presented by HLA-B, hence recruiting T cells with a distinct repertoire that may be relevant to T1D pathogenesis.


Conflict of interest statement

Competing interests: The authors declare no competing interests.

Figures

Fig. 1
Fig. 1. Immunopeptidome profiling of HLA-I-bound peptides presented by ECN90 β-cells.
a Length distribution of HLA-I-eluted peptides from ECN90 β-cells under basal and IFN-α-stimulated conditions. Four biological replicates (3.5-4.5 × 108 cells/each) were acquired for each condition, and unique peptides across replicates were counted. Bars represent cumulative peptide counts from all 4 replicates. b Number of 8-14mer peptides identified in at least one replicate of the basal, IFN-α-treated, or both conditions. Peptides found under basal conditions in one replicate and in both conditions in another were classified as “both”. c HLA-I expression detected by flow cytometry on ECN90 β-cells in basal and IFN-α-stimulated conditions using W6/32 Ab. d HLA-I heavy chain expression detected with HC10 Ab by Western blot in whole cell lysates of ECN90 cells β-exposed or not to IFN-α, with α-tubulin bands as loading controls and normalized HLA-I fold change (FC) values indicated. For panels (c, d), representative experiments out of 4 performed are shown. e Bioinformatics analysis pipeline. Predicted alternative aa sequences from RNAseq datasets of human islets (dashed lines) were appended to the database used for immunopeptidome search. Database-matched sequences identified by PEAKS (gray box) were sequentially filtered based on their length, on whether they matched mRNA variants (yellow boxes; peptides listed in Supplementary Data 1), and on the enriched expression of their source proteins in β-cells. Conventional candidates (green boxes; Supplementary Data 2) and sequences carrying PTMs (violet boxes; Supplementary Data 3) were separated. HLA-I-binding predictions were performed using NetMHCpan4.1a (peptide motifs detailed in Supplementary Fig. 1). In parallel, non-genome-templated peptides were interpreted as potential cis-spliced candidates and fed into the MARS algorithm, followed by filtering according to the enrichment of their source proteins in β-cells (red box, Supplementary Data 4).
Fig. 2
Fig. 2. β-cell immunopeptidome and chymotrypsin cleavage motifs.
a, b Relative representation of the top 40 source proteins in ECN90 β-cells (a) and human islets (b), ranked according to the number of peptides detected in the IFN-α-treated condition. The color scale is proportional to the percent peptides (conventional and PTM) identified for each protein out of the total peptides in a given condition. PTM peptides were counted as such only for PTMs defined as likely biological (they were otherwise counted as unmodified); cis-spliced peptides were excluded. Percent values and peptide numbers are listed on the right. Source proteins enriched in IFN-α-treated cells (log2 fold change, FC ≥ 1) or in basal condition (log2 FC ≤ − 1) are indicated. The complete heatmap is provided in Supplementary Fig. 2. HLA-I-bound peptides eluted from primary human islets are listed in Supplementary Data 5 and compared with those eluted from ECN90 β-cells in Supplementary Data 6. c, d Number (c) and percent (d) of HLA-I-eluted peptides across all 4 biological replicates carrying a chymotrypsin cleavage motif in basal and IFN-α-treated ECN90 β-cells. High-affinity cleavage motifs were defined as C-terminal Y, F, or W not followed by a P aa; low-affinity cleavage motifs were defined as C-terminal M or L not followed by a P aa. Additional analyses are reported in Supplementary Fig. 3 and Supplementary Data 7. ***p < 0.0001 by Fisher exact test.
Fig. 3
Fig. 3. Alternative antigen sequences.
a Global post-translational modification (PTM) enrichment in basal and IFN-α-treated conditions. A detailed list is provided in Supplementary Data 8. b Validated PTM peptides with representation of the native and modified aa (PTM in red). A detailed list is provided in Supplementary Data 3. c Peptide alignment of INS and INS-205 mRNA variant. The sequence of the HLA-eluted variant is indicated in red and corresponds to a sequence spliced out as compared to the canonical INS mRNA.
Fig. 4
Fig. 4. HLA-I restrictions of the immunopeptidome of ECN90 β-cells exposed or not to IFN-α.
a Relative distribution of predicted HLA-I ligands for each allele expressed by ECN90 β-cells in basal and IFN-α-treated conditions across all 4 biological replicates. ****p < 0.0001 and *p = 0.027 by Fisher exact test. A heatmap of the source proteins of HLA-A- and HLA-B-restricted peptides is provided in Supplementary Fig. 4; additional analyses are presented in Supplementary Fig. 5. Predicted HLA-E*01:01-restricted peptides are listed in Supplementary Data 9. b, c Percent (b) and number (c) of peptides originating from granule-contained and other proteins in basal and IFN-α-treated conditions across all 4 biological replicates. d, e Mean total abundance of conventional peptides originating from granule-contained (d) and other proteins (e) across all 4 biological replicates. Peptides were identified by PEAKS and quantified by Progenesis. The PPI15-24 sequence of the most abundant peptide identified in both conditions is indicated. Horizontal bars represent median values. ****p < 0.0001 and *p = 0.042 by Wilcoxon test.
Fig. 5
Fig. 5. IFNs preferentially upregulate HLA-B expression in ECN90 β-cells.
a Relative mRNA expression (mean + SEM of 11 biological replicates) of HLA-A, HLA-B, and HLA-C genes in ECN90 β-cells exposed to the indicated IFNs for 24 h. GAPDH was used as an internal normalizing control, and each gene was normalized to the basal sample; p-values by Mann-Whitney U test indicated on top of bars. b, c Protein expression of HLA-A, -B and -C in ECN90 β-cells exposed to the indicated IFNs, as detected by surface flow cytometry (b; mean + SEM of 17 biological replicates) and Western blot (c; representative experiment out of 3 performed) using the indicated Abs validated for their specificity (see Supplementary Fig. 6a, b). For flow cytometry, p-values by the Mann-Whitney U test are indicated on top of the bars. For Western blotting, the arrowhead indicates the HLA-I heavy chain band, with the top band indicating the α-tubulin loading control and normalized HLA-I fold change (FC) values indicated. Additional analyses are presented in Supplementary Fig. 7.
Fig. 6
Fig. 6. IFNs preferentially upregulate HLA-B expression in human islets.
a Relative mRNA expression (mean + SEM) of HLA-A, HLA-B, and HLA-C genes in primary human islets exposed to the indicated IFNs for 24 h. Data normalization is the same as in Fig. 5a, and each symbol represents triplicate measurements from islets of a single donor (Supplementary Table 1); ***p = 0.00004, **p = 0.0005, *p = 0.014 by Mann-Whitney U test. b Surface expression (mean + SEM of 7 biological replicates; gating strategy in Supplementary Fig. 6c) of HLA-A, -B and -C in β-cells and α-cells from primary human islets of 7 non-diabetic organ donors (Supplementary Table 1). Each symbol represents one organ donor; p-values by the Mann-Whitney U test.
Fig. 7
Fig. 7. HLA-B vs. HLA-A hyper-expression in the islets of T1D and non-diabetic (ND) cases.
a, b Representative immunofluorescence images of insulin-containing islets (ICIs) from T1D case nPOD 6396 (a) and ND case nPOD 6160 (b; all cases listed in Supplementary Table 2), stained with DAPI only (first row) or for HLA-A/B/C/E (yellow; second row), HLA-A (orange; third row) and HLA-B (red, fourth row), alone (first column) or in combination with INS (green, second column) or GCG (violet, third column). Scale bar 50 µm. c Whole ICI images from the same T1D case nPOD 6396, scale bar 100 µm. d Immunofluorescence quantification of HLA-I mean fluorescence intensity (MFI; mean + SEM) for HLA-A/B/C/E, HLA-A and HLA-B in β-cells (bottom) and α-cells (top) from ICIs of ND (blue; n = 6) and T1D cases (orange; n = 6); and in α-cells from insulin-deficient islets (IDIs) of T1D cases (white; n = 7). Crossed symbols indicate ND cases nPOD 6278 and 6462 and T1D case nPOD 6380 harboring HLA-A allotypes potentially cross-reactive with the HLA-B Ab HC10; **p = 0.01 and ***p ≤ 0.0002 by 2-way ANOVA after exclusion of these 3 cases. T1D IDI images and individual quantifications for each T1D donor are provided in Supplementary Fig. 8.
Fig. 8
Fig. 8. Enhanced activation of HLA-B-restricted CD8+ T cells by IFN-treated β-cells.
a Activation of ZsGreen-NFAT reporter 5KC T cells transduced with a 1E6 TCR recognizing HLA-A2-restricted PPI15-24 or a 173.D12 TCR recognizing HLA-B40-restricted PPI44-52. Following the indicated IFN pretreatment, ECN90 β-cells (wild-type or INS knock-out, KO) left unpulsed or pulsed with the TCR-cognate peptide were co-cultured with TCR-transduced 5KC T cells for 6 h. Data represent mean + SEM of triplicate measurements from a representative experiment out of 3 performed; p-values by Student’s t test. b Dose-response peptide recall of reporter 5KC T cells reactive to HLA-A2/PPI15-24, HLA-B40/PPI44-52 (used in panel a); HLA-A2/CMV pp65495-503, HLA-B40/NY-ESO−1125-133 (TCRs used in panel d). 5KC T cells were co-cultured for 18 h with K562 antigen-presenting cells transduced with HLA-A2 or HLA-B40 and pulsed with the indicated peptides. A representative experiment out of 2 performed is shown. c Average total abundance and fold difference (Δ) of HLA-A2-restricted PPI15-24 and HLA-B40-restricted PPI44-52 peptides presented under basal and IFN-α-treated conditions (n = 4/each). *p = 0.016 and **p = 0.004 by paired Student’s t test. d Cytotoxic lysis of ECN90 β-cells pulsed with HLA-A2-restricted CMV or HLA-B40-restricted NY-ESO-1 peptide. HLA-A2/CMV- or HLA-B40/NY-ESO-1-reactive TCR-transduced CD8+ T cells were cultured for 18 h with a fixed mixture of peptide-pulsed CFSE-labeled β-cells and unpulsed CTV-labeled β-cells, both preliminary treated or not with IFN-α for 24 h. The gating strategy is presented in Supplementary Fig. 9a. Percent-peptide-specific lysis is indicated, as calculated from the ratio of surviving (Live/Dead) pulsed CFSE+ vs. unpulsed CTV+ β-cells normalized to the same ratio in wells containing β-cell targets alone. Data represents mean + SEM of sextuplicate measurements from a representative experiment out of 2 performed, with fold-increase lysis vs. the basal condition indicated on top of each bar. ***p = 0.005 and **p = 0.008 by Mann-Whitney U test.
Fig. 9
Fig. 9. HLA-B40-restricted peptides recognized by islet-infiltrating T cells.
ac IFN-γ secretion by polyclonal CD8+ T-cell lines expanded from islet infiltrates of HLA-B40+ nPOD T1D donors (listed in Supplementary Table 3) and exposed to HLA-B40-transduced K562 antigen-presenting cells pulsed with HLA-B40-restricted peptide pools (peptides listed in Supplementary Table 4). df The same CD8+ T-cell lines exposed to HLA-B40-transduced K562 antigen-presenting cells pulsed with individual HLA-B40-restricted peptides from the previous pools. Data represent mean + SEM of triplicate measurements from a representative experiment out of 2 performed; p-values by paired Student’s t test indicated on top of bars. Additional T-cell lines responding to HLA-B40-restricted peptide pools are presented in Supplementary Fig. 9b.

References

    1. Ivashkiv, L. B. & Donlin, L. T. Regulation of type I interferon responses. Nat. Rev. Immunol.14, 36–49 (2014). - PMC - PubMed
    1. Marroqui, L. et al. Interferon-alpha mediates human beta cell HLA class I overexpression, endoplasmic reticulum stress and apoptosis, three hallmarks of early human type 1 diabetes. Diabetologia60, 656–667 (2017). - PubMed
    1. Marrack, P., Kappler, J. & Mitchell, T. Type I interferons keep activated T cells alive. J. Exp. Med.189, 521–530 (1999). - PMC - PubMed
    1. Hall, J. C. & Rosen, A. Type I interferons: crucial participants in disease amplification in autoimmunity. Nat. Rev. Rheumatol.6, 40–49 (2010). - PMC - PubMed
    1. Ferreira, R. C. et al. A type I interferon transcriptional signature precedes autoimmunity in children genetically at risk for type 1 diabetes. Diabetes63, 2538–2550 (2014). - PMC - PubMed

MeSH terms

LinkOut - more resources