. 2025 Jan 17;16(1):775.
doi: 10.1038/s41467-025-55997-6.

Microbial biogeography along a 2578 km transect on the East Antarctic Plateau

Affiliations

Microbial biogeography along a 2578 km transect on the East Antarctic Plateau

Victor Parro et al. Nat Commun. .

Abstract

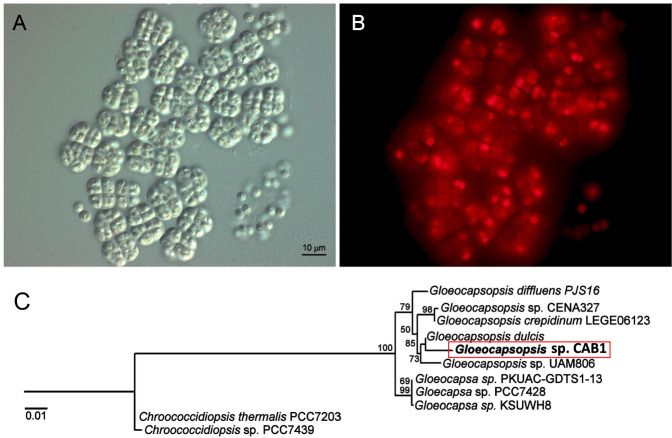
Microorganisms are present in snow/ice of the Antarctic Plateau, but their biogeography and metabolic state under extreme local conditions are poorly understood. Here, we show the diversity and distribution of microorganisms in air (1.5 m height) and snow/ice down to 4 m depth at three distant latitudes along a 2578 km transect on the East Antarctic Plateau on board an environmentally friendly, mobile platform. Results demonstrate the widespread distribution of microorganisms in the ice down to at least 4 m depth. Data point to geochemical and bacterial geographic distribution that correlate with wind trajectory and speed, modulated by local gathering and recirculation of microorganisms through snow drifting. Reservoir effects and community selection appear to occur over time, favoring microorganisms best adapted to hypothermal and hyperarid conditions. A new cyanobacterial species (Gloeocapsopsis sp) was isolated from 3 to 4 m depth. Our findings suggest that some microorganisms could exhibit transient, basal metabolic activity when associated to high salt particles, contributing to set biodiversity patterns and biogeographic compartmentalization on Antarctic Plateau ice.


Conflict of interest statement

Competing interests: The authors declare no competing interests.

Figures

Fig. 1
Fig. 1. The 2018–2019 Antarctic campaign on board the WindSled mobile station.
A Itinerary showing the locations where the two set of samples were collected: red circles named N, M and S, for three cores for geochemical and microbiological studies; and yellow stars (af) for six oxygen and hydrogen isotope analysis core samples (see Fi. 2). B the WindSled mobile platform consisting of three modules (driving, payload, and living room) and wind-powered by a 200 m2 kite. C Drilling system and the aspect of the 1 m snow/ice cores. D Airborne aerosol collector in the field and scheme: 1, manifold pipe; 2, turbine; 3; sample holder; 4, Fan 9GT0612P4G001; 5, collector support; arrow, flow direction (see Materials and Methods for further details). E Five-day back-trajectories of the air parcels from the collected samples on the African sector of the East Antarctic Plateau. Grey contour lines indicate altitude at 500 m intervals. The depicted back-trajectories originate from the three distinct sampling points: N (red), M (green) and S (blue). These trajectories are computed at 25%, 50%, and 75% of the boundary-layer height with hourly initialization the sampling periods.
Fig. 2
Fig. 2. Isotopic and geochemical analysis of snow/ice samples.
A δ18O in water from melted snow/ice cores from north to south collected along the transect (a-f). Ratio δ18O is reported as per mil relative to Standard Mean Ocean Water (SMOW). The plot shows the δ18O values obtained from core samples every ten centimeters intervals from the drills performed at 6 locations (a-f) at the indicated coordinates. Each sample series is represented in a different color, from light grey for the northernmost sample to deep red for the southernmost one. The plot shows a 18O depletion as a function of the distance from the coast (N, north) to the interior of the Antarctic Plateau (to the South and East). B Mean δ18O values at each site e-f (diamonds with color gradient as in A) as a function of latitude, with N, M, and S sites located over the curve (black dots) as a guidance. Error bars correspond to standard deviation (SD) of all measurements at different depths in a single site (site a, n = 30; site b, n = 40; site c, n = 35; sites d and e, n = 40 each one, and; site f, n = 37). See Supplementary Table 1). C Ion chromatography analysis of melted and filtered water samples showing inorganic and short-chain organic anions at the three sites: North (red) DN1-4, Middle (green) DM1-4, and South (blue) DS1-4, from 0-1 m (1), 1-2 m (2), 2-3 m (3), and 3-4 m (4) core depths. Bars show mean values of at least two (n = 2) technical measurements (overlayed points) at different dilutions from each 1-m melted core sample.
Fig. 3
Fig. 3. Onboard experiments for deliquescence events and microbial biomarker profiling under Antarctic freezing temperatures.
A Deliquescence experiment. A plastic container filled with NaCl and sensors for conductivity (C), relative humidity (RH) and temperature (T) inserted in the salt. B Values of RHice and T measured in the air (dotted lines) and within NaCl (solid lines) during the transect across the Antarctic Plateau from 12/21/2018 to 02/01/2019. Black areas show periods when RHice within the salt remained constant, and above the equilibrium RH of saturated NaCl brines. This could be due to the formation of thin briny films within the salt via deliquescence. During those periods, the temperature within the salt transiently rose above the eutectic (grey areas). Also indicated are the deliquescence RH and eutectic temperature of saturated NaCl brines. C On site fluorescence sandwich immunoassay (FSIA) with LDChip at M site, showing a portion of LDChip with several positive immunodetections on triplicate spot pattern. Cartoon shows a sandwich immunoassay with an immobilized antibody (Ab), the target biomarker captured (yellow figure), and the fluorescent tracer antibody (FTAb). Squares and numbers indicate the antibodies whose relative fluorescence units where plotted with the entire LDChip results after a single assay with each of 1 m section of M drill (0-1 m, 1-2 m, 2-3 m, 3-4 m) on the right (D), which correspond to: 1, Acidithiobacillus thiooxidans; 2, Tessaracoccus lapidicaptus (Actinobacteriota); 3, Bacillus subtilis spores (Firmicutes); 4, Bacillus subtilis biofilm (Firmicutes); 5, Leptolyngbya boryana (Cyanobacteria); 6, GroEL chaperonine; 7, NifD nitrogenase component; 8, DhnA drought, low temperature, high salinity protectant dehydrin from cyanobacteria; 9, Acidithiobacillus ferrooxidans; 10, NirS nitrite reductase protein; 11, environmental biofilm enriched in iron oxidizing bacteria; 12, Arcobacter sp.
Fig. 4
Fig. 4. Bacterial diversity and its spatial distribution from the air to 4 m depth in the ice.
A Bacterial diversity profile after 16S rRNA gene sequence analysis at the phylum level in the three air (AN, AM, AS) and three snow/ice cores (DN, DM, DS) from 1, 0-1 m; 2, 1-2 m; 3, 2-3; 4, 3-4 m depth. B Spatial distribution and relative abundances (%) of bacterial ASVs shared between the air and snow/ice core samples. Relative abundances of ASVs were calculated over the total bacterial community in each sample. (P) Proteobacteria, (F) Firmicutes and (A) Actinobacteriota. Sample code ID is as in A. C Non-metric multidimensional scaling (NMDS) ordination based on Bray-Curtis dissimilarity distances of ASV abundances from air (triangles) and snow/ice (dots) samples from North (red), Middle (green) and South (blue) sampling sites (see text for explanation).
Fig. 5
Fig. 5. Viable cyanobacteria were recovered from 4 m depth sample in the Antarctic Plateau.
A Differential Interference Contrast micrograph showing Gloeocapsopsis sp. CAB1 cells, rarely solitary, mostly arranged in irregular colonies, composed of densely, irregularly aggregated cells, surrounded by mucilaginous envelopes. Cells sub spherical, irregular rounded in outline. Cell duets or tetrads present but are rare. Cell division is irregular in various planes in successive generations, forming round structures with twelve or more cells. B Phycobiliproteins and chlorophyll autofluorescence of the same group of cells shown in A, unveiling differences in chlorophyll content and/or photosynthetic activity. Note also the concentric thylakoids (brightest spots) in some of the cells. C Maximum Likelihood phylogenetic tree from the complete 16S rRNA gene sequence that allowed to classify this strain as a new species within the genus Gloeocapsopsis.

References

    1. Hare, F. K. & Rubin, M. J. Studies in Antarctic Meteorology. Geogr. J.133, 554–555 (1967).
    1. Dalrymple, P. C. A Physical Climatology of the Antarctic Plateau. in Studies in Antarctic Meteorology (ed. Rubin, J.) 195–231 (1966). 10.1029/ar009p0195.
    1. Burton, M. G. Astronomy in Antarctica. A&A Rev. 18, 417–469 (2010).
    1. Chamberlin, R. A., Lane, A. P. & Stark, A. A. The 492 GHz Atmospheric Opacity at the Geographic South Pole. Astrophys J.476, 428–433 (1997).
    1. Davila, A., Kahre, M. A., Quinn, R. & Des Marais, D. J. The Biological Potential of Present-Day Mars. in Planetary Astrobiology (eds. Meadows, V., Arney, G., Schmidt, B., Des Marais, D. & Dotson, R.) 169–184 (Tucson: University of Arizona Press, 2020).

LinkOut - more resources