Randomized Controlled Trial
. 2025 Jan 17;16(1):759.
doi: 10.1038/s41467-025-55931-w.

Neutralizing antibody immune correlates in COVAIL trial recipients of an mRNA second COVID-19 vaccine boost

Affiliations
Randomized Controlled Trial

Neutralizing antibody immune correlates in COVAIL trial recipients of an mRNA second COVID-19 vaccine boost

Bo Zhang et al. Nat Commun. .

Abstract

Neutralizing antibody titer has been a surrogate endpoint for guiding COVID-19 vaccine approval and use, although the pandemic's evolution and the introduction of variant-adapted vaccine boosters raise questions as to this surrogate's contemporary performance. For 985 recipients of an mRNA second bivalent or monovalent booster containing various Spike inserts [Prototype (Ancestral), Beta, Delta, and/or Omicron BA.1 or BA.4/5] in the COVAIL trial (NCT05289037), titers against 5 strains were assessed as correlates of risk of symptomatic COVID-19 ("COVID-19") and as correlates of relative (Pfizer-BioNTech Omicron vs. Prototype) booster protection against COVID-19 over 6 months of follow-up during the BA.2-BA.5 Omicron-dominant period. Consistently across the Moderna and Pfizer-BioNTech vaccine platforms and across all variant Spike inserts assessed, both peak and exposure-proximal ("predicted-at-exposure") titers correlated with lower Omicron COVID-19 risk in individuals previously infected with SARS-CoV-2, albeit significantly less so in naïve individuals [e.g., exposure-proximal hazard ratio per 10-fold increase in BA.1 titer 0.74 (95% CI 0.59, 0.94) for naïve vs. 0.41 (95% CI 0.23, 0.64) for non-naïve; interaction p = 0.013]. Neutralizing antibody titer was a strong inverse correlate of Omicron COVID-19 in non-naïve individuals and a weaker correlate in naïve individuals, posing questions about how prior infection alters the neutralization correlate.


Conflict of interest statement

Competing interests: N.G.R. is a paid safety consultant for ICON, CyanVac, Imunon, and EMMES, and has served on selected advisory boards for Sanofi, Seqirus, Pfizer-BioNTech and Moderna. Emory receives funds for N.G.R. to conduct research from Sanofi, Lilly, Merck, Quidel, Immorna, Vaccine Company, and Pfizer-BioNTech. S.K. reports research support to his institution from Pfizer-BioNTech, Moderna, Bavarian Nordic, Meissa, Centers for Disease Control and Prevention, and National Institutes of Health. E.B.W. has served as an investigator for clinical trials or studies sponsored by Pfizer-BioNTech, Moderna, Seqirus, Najit, and Clinetic; on advisory boards for Pfizer-BioNTech and Vaxcyte; as a consultant to IliAD Biotechnologies; and as a DSMB member for Shionogi. T.M.B. has served on an Advisory Board for Sanofi. D.N.F. has served on an Advisory Board for Gilead Sciences and for AXCELLA, and as site PI for clinical trials sponsored by Gilead Sciences, Regeneron, MetroBiotech LLC, and the NIH (DMID COVAIL). The remaining authors declare no competing interests.

Figures

Fig. 1
Fig. 1. Covariate-adjusted cumulative incidence of COVID-19 over time from the date of boost receipt (D1) through 188 days post-D15, shown separately for naïve (golden lines) and non-naïve participants (blue lines), in each of the three COVAIL trial stages 1, 2, and 4.
Cumulative incidence of COVID-19 is shown for a Stage 1 Moderna, b Stage 2 Pfizer-BioNTech, and c Stage 4 Pfizer-BioNTech boost recipients. Analyses adjusted for the force of infection score and risk score. Source data are provided as a Source Data file.
Fig. 2
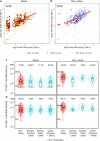
Fig. 2. D1 and D15 BA.1 titers in SARS-CoV-2 naïve and non-naïve participants, and in non-cases and COVID-19 cases.
a, b Scatterplots of D1 and D15 log10 BA.1 titers in a naïve participants (N = 629; 181 cases and 448 non-cases) and b non-naïve participants (N = 356; 32 cases and 324 non-cases). Titers are in units AU/ml. The short horizontal red line represents the mean of log10 nAb-ID50 values that are <LLOQ at Day 15. The diagonal red line represents the fitted linear regression line between Day 1 and Day 15 log10 nAb-ID50 values that are above LLOQ. LLOQ, a lower limit of quantification. The gray area around the diagonal red line indicates the 95% confidence interval of the fitted line. Red dots identify COVID-19 cases; yellow dots identify naïve non-cases; blue dots identify non-naïve non-cases. c, d Violin box plots of c D1 and d D15 BA.1 ID50 titers, shown by non-cases (red dots) and COVID-19 cases (turquoise dots) (stratified by booster-proximal cases, booster-distal cases, and proximal + distal cases). In (c), D1 titers are shown from N = 448 naïve and 324 non-naïve non-cases, N = 122 naïve and 22 non-naïve booster-proximal cases, N = 59 naïve and 10 non-naïve booster-distal cases, N = 181 naïve and 32 non-naïve proximal+distal cases; in (d), D15 titers are shown from N = 448 naïve and 324 non-naïve non-cases, N = 122 naïve and 22 non-naïve booster-proximal cases, N = 59 naïve and 10 non-naïve booster-distal cases, N = 181 naïve and 32 non-naïve proximal+distal cases. Violin plots contain interior box plots with upper and lower horizontal edges at the 25th and 75th percentiles of antibody level and middle line at the 50th percentile, and vertical bars the distance from the 25th (or 75th) percentile of antibody level and the minimum (or maximum) antibody level within the 25th (or 75th) percentile of antibody level minus (or plus) 1.5 times the interquartile range. Each side shows a rotated probability density (estimated by a kernel density estimator with a default Gaussian kernel) of the data. Non-cases: No evidence of SARS-CoV-2 infection at 7 days post-D15 through to 188 days post-D15. Booster-proximal cases: COVID-19 endpoint between 7 and 91 days post-D15 visit; booster-distal cases: COVID-19 endpoint between 92 and 188 days post-D15 visit; cases (proximal + distal): COVID-19 endpoint between 7 and 188 days post-D15 visit. Rate is the percentage of participants with positive responses, with positive responses defined as titer above the limit of detection (LoD), 40 AU/ml. Gray triangles identify non-responders/undetectable. The upper dashed horizontal line in each plot shows the antigen-specific upper limit of quantification (ULoQ) and the lower dashed horizontal line in each plot shows the LoD. nAb-ID50, 50% inhibitory dilution neutralizing antibody titer. Source data are provided as a Source Data file.
Fig. 3
Fig. 3. Covariate-adjusted cumulative incidence of COVID-19 from 7 through 188 days post-D15 by Low, Medium, or High tertile of D15 BA.1 titer.
Incidence is shown separately in SARS-CoV-2 a naïve and b non-naïve participants. Low: <2818 AU/ml (solid line); Medium: 2818 to 8913 AU/ml (dashed line); High: >8913 AU/ml (dotted line). For Low, median = 1279 AU/ml among naïve and 2090 AU/ml among non-naïve; for Medium, median = 4530 AU/ml among naïve and 5446 AU/ml among non-naïve; for High, median = 15,503 AU/ml among naïve and 18768 AU/ml among non-naïve. Analyses adjusted for the force of infection score and risk score. AU, arbitrary units; nAb-ID50, 50% inhibitory dilution neutralizing antibody titer. Source data are provided as a Source Data file.
Fig. 4
Fig. 4. Covariate-adjusted cumulative incidence of COVID-19 by D15 BA.1 titer and covariate-adjusted hazard ratios of COVID-19 per 10-fold increase in D15 BA.1 titer.
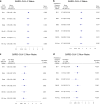
a, c Covariate-adjusted cumulative incidence of COVID-19 by D15 BA.1 titer at 188 days post-D15, estimated using a Cox model (orange line) or a nonparametric method (turquoise line), in SARS-CoV-2 a naïve and c non-naïve participants. Both curves were restricted to the middle 95% of the marker distribution. Shaded regions represent 95% confidence intervals. The green shaded region is a smoothed histogram of log10 D15 BA.1 titer (AU/ml). Analyses adjusted for the force of infection score and risk score. b, d Cox model covariate-adjusted hazard ratios of COVID-19 per 10-fold increase in D15 BA.1 titer (AU/ml), in b naïve participants (All mRNA N = 629) and in the designated subgroups (mRNA Moderna N = 306, mRNA Pfizer-BioNTech N = 131, mRNA Prototype N = 105, mRNA Omicron-containing N = 459, mRNA Bivalent N = 352, mRNA Monovalent N = 107), or d non-naïve participants (all mRNA N = 356) and in the designated subgroup (mRNA Omicron-containing N = 285). Point estimates, 95% confidence intervals (CIs), and 2-sided Wald p-values are shown. P-values were not adjusted for multiple comparisons. Subgroup analyses were only conducted when the number of COVID-19 endpoints was equal to or exceeded 20, to ensure reasonable precision. nAb-ID50, 50% inhibitory dilution neutralizing antibody titer. Source data are provided as a Source Data file.
Fig. 5
Fig. 5. Cox model covariate-adjusted hazard ratios of COVID-19 per 10-fold increase in D15 or predicted-at-exposure neutralizing antibody titer, shown separately in SARS-CoV-2 naïve and non-naïve participants.
a, c D15 titer (AU/ml) for each marker BA.1, Beta, Delta, BA.4/BA.5, D614G, or weighted average (Wt. Avg.); b, d predicted-at-exposure titer (AU/ml) for each marker BA.1, Beta, Delta, BA.4/BA.5, D614G, or Wt. Avg for follow-up 7–188 days post-D15. Results are shown in a, b naïve participants: a BA.1 (N = 629), Beta (N = 629), Delta (N = 629), BA.4/BA.5 (N = 629), D614G (N = 629), or weighted average (Wt. Avg.) (N = 629); b BA.1 (N = 629), Beta (N = 629), Delta (N = 629), BA.4/BA.5 (N = 605), D614G (N = 629), or weighted average (Wt. Avg.) (N = 629) or c, d non-naïve participants: c BA.1 (N = 356), Beta (N = 356), Delta (N = 356), BA.4/BA.5 (N = 356), D614G (N = 356), or weighted average (Wt. Avg.) (N = 356); d BA.1 (N = 356), Beta (N = 356), Delta (N = 356), BA.4/BA.5 (N = 351), D614G (N = 356), or weighted average (Wt. Avg.) (N = 356). D15 analyses adjusted for the force of infection score and risk score. Exposure-proximal analyses are calendar-time-based and adjusted for the risk score. Point estimates, 95% confidence intervals (CIs), and 2-sided Wald p-values are shown for the D15 titer analyses, and bootstrap percentile 95% CIs and 2-sided p-values are shown for the predicted-at-exposure analyses. P-values were not adjusted for multiple comparisons. Wt. Avg. = Maximum diversity-weighted geometric mean of the five nAb titers D614G reference, Beta, Delta, Omicron BA.1, and Omicron BA.4/BA.5. AU, arbitrary units; nAb-ID50, 50% inhibitory dilution neutralizing antibody titer.
Fig. 6
Fig. 6. Hazard ratio of COVID-19 relative to minimum predicted-at-exposure BA.1 titer by predicted-at-exposure BA.1 titer and calendar-time-based hazard ratios of COVID-19 per 10-fold increase in predicted-at-exposure BA.1 titer, shown separately in SARS-CoV-2 naïve and non-naïve participants.
a, c Hazard ratio of COVID-19 relative to minimum log10 predicted-at-exposure BA.1 titer (AU/ml) by predicted-at-exposure BA.1 titer (AU/ml), estimated using a Cox model, in a naïve participants and c non-naïve participants for follow-up 7–188 days post-D15. The curve was restricted to the middle 95% of the marker distribution. Shaded regions represent 95% confidence intervals. The green shaded region is a kernel density estimate of log10 predicted-at-exposure BA.1 titer (AU/ml). Analyses adjusted for risk score. b, d Calendar-time-based Cox model covariate-adjusted hazard ratios of COVID-19 per 10-fold increase in predicted-at-exposure BA.1 titer (AU/ml), in b naïve participants (All mRNA N = 629) and in the designated subgroups (mRNA Moderna N = 306, mRNA Pfizer-BioNTech N = 131, mRNA Prototype N = 105, mRNA Omicron-containing N = 459, mRNA Bivalent N = 352, mRNA Monovalent N = 107), or d non-naïve participants (All mRNA N = 356) and in the designated subgroup (mRNA Omicron-containing N = 285). Point estimates, 95% bootstrap percentile confidence intervals (CIs), and 2-sided bootstrap p-values are shown. P-values were not adjusted for multiple comparisons. Subgroup analyses were only conducted when the number of endpoints was equal to or exceeded 20, to ensure sufficient precision. AU arbitrary units nAb-ID50 50% inhibitory dilution neutralizing antibody titer.
Fig. 7
Fig. 7. SARS-CoV-2 lineages of COVID-19 endpoints and hazard ratios of BA.4/BA.5 COVID-19 per 10-fold increase in neutralizing antibody titer, shown separately in SARS-CoV-2 naïve and non-naïve participants.
a SARS-CoV-2 lineages among the 213 COVID-19 endpoints during follow-up 7–188 days post-D15, shown by calendar date of COVID-19 onset swab collection. Square: BA.2, circle: BA.4, triangle: BA.5, plus sign: XZ, rotated plus sign, XBB.1*. The asterisk designates the inclusion of any descendent lineages of XBB.1 (e.g. XBB.1.1). be Cox model covariate-adjusted hazard ratios of BA.4/BA.5 COVID-19 per 10-fold increase in b, d D15 BA.4/BA.5 titer (AU/ml) or c, e D15 D614G titer (AU/ml), in b, c naïve participants: b (All mRNA N = 629) and in the designated subgroups (mRNA Moderna N = 306, mRNA Pfizer-BioNTech N = 131, mRNA Prototype N = 105, mRNA Omicron-containing N = 459, mRNA Bivalent N = 352, mRNA Monovalent N = 107); c (All mRNA N = 629) and in the designated subgroups (mRNA Moderna N = 306, mRNA Pfizer-BioNTech N = 131, mRNA Prototype N = 105, mRNA Omicron-containing N = 459, mRNA Bivalent N = 352, mRNA Monovalent N = 107)or d, e non-naïve participants: d (All mRNA N = 356) and in the designated subgroup (mRNA Omicron-containing N = 285); e (All mRNA N = 356) and in the designated subgroup (mRNA Omicron-containing N = 285). Point estimates, 95% confidence intervals (CIs), and 2-sided Wald p-values are shown. P-values were not adjusted for multiple comparisons. Subgroup analyses were only conducted when the number of BA.4/BA.5 COVID-19 endpoints were equal to or exceeded 15, to ensure reasonable precision. AU arbitrary units.
Fig. 8
Fig. 8. Controlled relative vaccine efficacy curves.
The curves show the contrast in the estimated COVID-19 cumulative incidence at 188 days post-D15 for the hypothetical assignment of all participants to an Omicron-containing vaccine and the a D15 BA.1 titer or b D15 weighted average to a given fixed value with the overall estimated cumulative incidence of Prototype vaccine recipients [Stage 2 Pfizer-BioNTech vaccine arms 7 (Prototype), 8 (Beta + Omicron), 9 (Omicron), 12 (Prototype + Omicron)]. Estimation of the curve was restricted to the middle 95% of the marker distribution. Shaded regions represent 95% confidence intervals. The green shaded region is a smoothed histogram of log10 a D15 BA.1 titer (AU/ml) or b D15 weighted average titer. Analyses adjusted for the force of infection score, risk score, and baseline naïve/non-naïve status. Wt. Avg. = Maximum diversity-weighted geometric mean of the five neutralizing antibody titers D614G, Beta, Delta, BA.1, and BA.4/BA.5. AU, arbitrary units; nAb-ID50, 50% inhibitory dilution neutralizing antibody titer. Source data are provided as a Source Data file.

References

    1. US Food and Drug Administration. COVID-19 vaccines. https://www.fda.gov/emergency-preparedness-and-response/coronavirus-dise... (2024).
    1. Baden, L. R. et al. Efficacy and safety of the mRNA-1273 SARS-CoV-2 vaccine. N. Engl. J. Med.384, 403–416 (2021). - PMC - PubMed
    1. Heath, P. T. et al. Safety and efficacy of NVX-CoV2373 Covid-19 vaccine. N. Engl. J. Med.385, 1172–1183 (2021). - PMC - PubMed
    1. Polack, F. P. et al. Safety and efficacy of the BNT162b2 mRNA Covid-19 vaccine. N. Engl. J. Med. 383, 2603–2615 (2020). - PMC - PubMed
    1. Carabelli, A. M. et al. SARS-CoV-2 variant biology: immune escape, transmission and fitness. Nat. Rev. Microbiol.21, 162–177 (2023). - PMC - PubMed

Publication types

MeSH terms

Supplementary concepts