. 2025 Jan 18;16(1):798.
doi: 10.1038/s41467-025-56173-6.

Decoding the m6A epitranscriptomic landscape for biotechnological applications using a direct RNA sequencing approach

Affiliations

Decoding the m6A epitranscriptomic landscape for biotechnological applications using a direct RNA sequencing approach

Chuwei Liu et al. Nat Commun. .

Abstract

Epitranscriptomic modifications, particularly N6-methyladenosine (m6A), are crucial regulators of gene expression, influencing processes such as RNA stability, splicing, and translation. Traditional computational methods for detecting m6A from Nanopore direct RNA sequencing (DRS) data are constrained by their reliance on experimentally validated labels, often resulting in the underestimation of modification sites. Here, we introduce pum6a, an innovative attention-based framework that integrates positive and unlabeled multi-instance learning (MIL) to address the challenges of incomplete labeling and missing read-level annotations. By combining electrical signal features with base alignment data and employing a weighted Noisy-OR probability mechanism, pum6a achieves enhanced sensitivity and accuracy in m6A detection, particularly in low-coverage loci. Pum6a outperforms existing methods in identifying m6A sites across various cell lines and species, without requiring extensive parameter tuning. We further apply pum6a to study the dynamic regulation of m6A demethylases in gastric cancer under hypoxia, revealing distinct roles for FTO and ALKBH5 in modulating m6A modifications and uncovering key insights into m6A -mediated transcript stability. Our findings highlight the potential of pum6a as a powerful tool for advancing the understanding of epitranscriptomic regulation in health and disease, paving the way for biotechnological and therapeutic applications.


Conflict of interest statement

Competing interests: The authors declare no competing interests.

Figures

Fig. 1
Fig. 1. Overview of the pum6a framework and its evaluation on the MNIST bag dataset.
a Schematic of the pum6a framework, highlighting its key components for multi-instance learning and m6A site detection. b Dot plot illustrating attention weights and instance probabilities in positive bags. Dot size corresponds to attention weight, and color intensity represents the probability of specific digit identification, with the model focusing on digits 9, 7, and 4. c Comparative ROC AUC performance metrics of pum6a versus baseline models at varying label frequencies. Left: Bag-wise ROC AUC; Right: Instance-wise ROC AUC, demonstrating pum6a’s superior adaptability across complex datasets.
Fig. 2
Fig. 2. Comparative performance of pum6a and baseline models across diverse datasets.
a, b ROC AUC scores of pum6a and baseline models on 20 different datasets. a Bag-wise ROC AUC; b Instance-wise ROC AUC, showing pum6a’s consistent performance across various biological data. c, d Average rank of each method across all experiments and different label frequencies. c Bag level; d Instance level ranking, with pum6a outperforming other methods in predictive accuracy and model robustness.
Fig. 3
Fig. 3. Application of pum6a for m6A detection in ONT direct RNA sequencing data in HEK293T cells.
a Schematic diagram of the pum6a model tailored for m6A detection from ONT direct RNA sequencing. The conceptual structure of the workflow was inspired by previous works by Hendra et al. (Nature Methods) and Zhong et al. (Nature Communications), and independently designed and integrated. This figure was adapted from Hendra et al. (Nature Methods, 2022, 10.1038/s41592-022-01666-1) and Zhong et al. (Nature Communications, 2023, 10.1038/s41467-023-37596-5), both published under a CC-BY license (https://creativecommons.org/licenses/by/4.0/). Modifications were made. b Distribution of m6A modification sites identified in HEK293T cells across four experiment protocols. c, d Comparison of pum6a’s performance with EpiNano, MINES, Nanom6A, and Tombo using ROC (c), and PR curves (d) for datasets with at least 3 reads. e, f, ROC (e), and PR curves (f) for datasets with at least 5 reads, comparing pum6a with additional methods including ELIGOS. g, h ROC (g), and PR curves (h) for datasets with at least 20 reads, incorporating m6anet into the comparison. i Summary of precision, recall, and F1 scores for all evaluated models. j Precision analysis of the top 18,000 m6A sites across four protocols, showing pum6a’s superior precision.
Fig. 4
Fig. 4. Evaluation of pum6a on mouse embryonic stem cells and synthetic datasets.
a Distribution of m6A modification sites identified in HEK293T cells across two experiment protocols. b, c ROC (b), and PR curves (c) comparing pum6a to baseline models on datasets with at least 3 reads. d, e ROC (d), and PR curves (e) for datasets with at least 5 reads. f, g ROC (f), and PR curves (g) for datasets with at least 20 reads, showcasing pum6a’s performance relative to other models. h, i, j, k ROC (h, j), and PR (i, k) curves on synthetic data at the bag and instance levels, demonstrating pum6a’s accuracy. I Comparison of m6A modification sites distributions between species (HEK293T and mouse embryonic stem cells). Left: Ground truth set obtained from experiment protocol; Right: Pum6a inference set. m Proportion of m6A modification sites predicted by pum6a and experimental protocols for RRACH motifs in both species. n Summary of precision, recall, and F1 scores across two protocols, highlighting pum6a’s strong performance.
Fig. 5
Fig. 5. Dynamic regulation of m6A modification by hypoxia and m6A demethylases in gastric cancer cells.
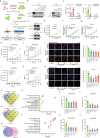
a Experimental workflow for assessing dynamic m6A modification under hypoxia and the effects of m6A demethylases. b, Validation of ALKBH5 and FTO knockdown efficiency by Western blot in AGS gastric cancer cells. c Gene count of ALKBH5 and FTO in AGS cells under different oxygen conditions. *p = 0.0475 by a t-test. d Western blot analysis showing differential expression of ALKBH5 and FTO in AGS cells under normoxic and hypoxic conditions. e AGS cell proliferation responses to hypoxia, showing suppressed growth. ****p < 0.0001 by a two-way ANOVA. f, g Impact of ALKBH5 or FTO overexpression on AGS cell growth under normoxia (f) and hypoxia (g), quantified by cell count. In f, ALKBH5-OE (**p = 0.0019), FTO-OE (***p = 0.0006) by a two-way ANOVA. h, i, j, k Effects of ALKBH5 and FTO knockdown on AGS cell proliferation and growth under normoxia (h, j) and hypoxia (i, k), quantified through cell count (hi) and growth rate (jk) measurements. ****p < 0.0001 by a two-way ANOVA. l,m Knockdown of ALKBH5 or FTO significantly reduced proliferation of AGS cells under hypoxia, as measured by EdU assay. Scale bars are 200 μm. Quantification of fold changes was performed using ImageJ. l: Normoxia; *p = 0.0268, *p = 0.0174, *p = 0.0118, *p = 0.0124, by a t-test. m: Hypoxia; *p = 0.0126, **p = 0.0014, *p = 0.0128, *p = 0.0359, by a t-test. n, o Distribution analysis of m6A-modified sites in AGS cells following ALKBH5 or FTO knockdown under normoxia (n) and hypoxia (o). p Overlap analysis showing common m6A-modified sites regulated by ALKBH5 and FTO under varying oxygen levels. q KEGG pathway enrichment analysis of m6A-modified sites regulated by m6A demethylases under normoxic conditions. Dot color indicates the number of genes, and dot size represents the –log10 p-value of the pathway term. r Gene Oncology (GO) enrichment analysis of m6A-modified sites regulated by m6A demethylases under hypoxia. Dot color indicates the number of genes, and dot size represents the –log10 p-value of the biological process term. Statistical analysis (q, r) was performed using a two-sided hypergeometric test with adjustment for multiple comparisons using the Benjamini-Hochberg (BH) method to control the false discovery rate (FDR). s, t Significant reduction of ATP levels in AGS cells following FTO/ALKBH5-knockdown under normoxic (s) and hypoxic (t) conditions. In s, **p = 0.0022, **p = 0.0018, **p = 0.0041, **p = 0.002, by a t-test. In t, ***p = 0.001, ***p = 0.0001, ****p < 0.0001, ***p = 0.0007, by a t-test. u, v Decreased NAD+ levels and NAD + /NADH ratio in AGS cells after FTO/ALKBH5 depletion under normoxic (u) and hypoxic (v) conditions. In u, *p = 0.011, **p = 0.0075, **p = 0.0049, **p = 0.0058, by a t-test. In v, **p = 0.0045, *p = 0.0136, **p = 0.0066, *p = 0.0129, by a t-test. Data are presented as mean ± S.D.  and are representative of three independent experiments. Source data are provided as a Source Data file.
Fig. 6
Fig. 6. Hypoxia-induced regulation of CXCL10 expression by m6A demethylases in gastric cancer cells.
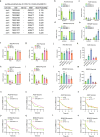
a Detection of m6A modification sites in CXCL10 mRNA in AGS cells following ALKBH5 knockdown, identified by pum6a analysis. b, c, d, e Knockdown of ALKBH5 upregulated CXCL10 mRNA expression in AGS cells (b, c) and MKN28 cells (d, e) under hypoxic conditions. In b, *p = 0.013, **p = 0.0086, by a t-test. In c, **p = 0.0098, **p = 0.0061, *p = 0.0103, ***p = 0.0001, by a t-test. In d, ***p = 0.0003, **p = 0.002, by a t-test. In e, *p = 0.029, *p = 0.0153, *p = 0.0129, ***p = 0.0004, by a t-test. f, g, h, i Knockdown of FTO upregulated CXCL10 mRNA expression in AGS cells (f, g) and downregulated CXCL10 expression in MKN28 cells (h, i) under hypoxia. In f, ***p = 0.0001, ***p = 0.0002, by a t-test. In g, ****p < 0.0001, ****p < 0.0001, *p = 0.0219, *p = 0.0147, by a t-test. In h, ****p < 0.0001, ****p < 0.0001, by a t-test. In i, **p = 0.0012, ***p = 0.0005, **p = 0.0041, **p = 0.0026, by a t-test. j, k, l, m ELISA validation of CXCL10 protein levels in AGS cells (j, k) and MKN28 cells (l, m) with ALKBH5 or FTO knockdown under normoxic and hypoxic conditions. In k, ***p = 0.0002, ****p < 0.0001, *p = 0.012, **p = 0.0021, by a t-test. In m, ***p = 0.0003, ***p = 0.0003, **p = 0.0031, *p = 0.0356, by a t-test. n, o, p, q Actinomycin D chase assays showing that ALKBH5 knockdown decelerated CXCL10 mRNA decay rates in AGS cells (n, o) and MKN28 cells (p, q) under hypoxia. In o, ****p < 0.0001, by a two-way ANOVA; In q, **p = 0.0024, by a two-way ANOVA. r, s, t, u FTO Knockdown decreased CXCL10 mRNA decay rates in AGS cells (r, s) under hypoxia but promoted mRNA stability in MKN28 cells (t, u). In s, ***p = 0.0003, by a two-way ANOVA. Data are presented as mean ± S.D.  and are representative of three independent experiments. Source data are provided as a Source Data file.

References

    1. Cohn, W. E. & Volkin, E. Nucleoside-5′-Phosphates from Ribonucleic Acid. Nature167, 483–484 (1951).
    1. Kemp, J. W. & Allen, F. W. Ribonucleic acids from pancreas which contain new components. Biochim. et. Biophys. Acta28, 51–58 (1958). - PubMed
    1. Boccaletto, P. et al. MODOMICS: a database of RNA modification pathways. 2017 update. Nucleic Acids Res.46, D303–D307 (2018). - PMC - PubMed
    1. Frye, M., Jaffrey, S. R., Pan, T., Rechavi, G. & Suzuki, T. RNA modifications: what have we learned and where are we headed? Nat. Rev. Genet17, 365–372 (2016). - PubMed
    1. Roundtree, I. A., Evans, M. E., Pan, T. & He, C. Dynamic RNA Modifications in Gene Expression Regulation. Cell169, 1187–1200 (2017). - PMC - PubMed

MeSH terms

LinkOut - more resources