. 2025 Jan 17;12(1):101.
doi: 10.1038/s41597-024-04194-z.

A time-varying index for agricultural suitability across Europe from 1500-2000

Affiliations

A time-varying index for agricultural suitability across Europe from 1500-2000

Alexander Lehner et al. Sci Data. .

Abstract

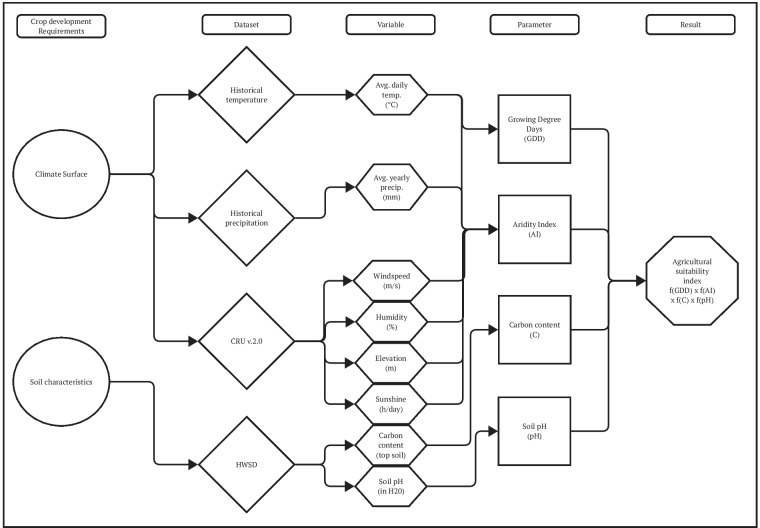
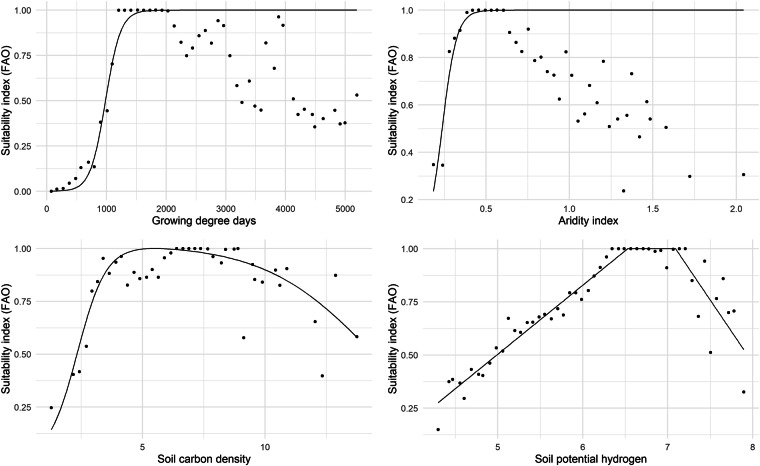
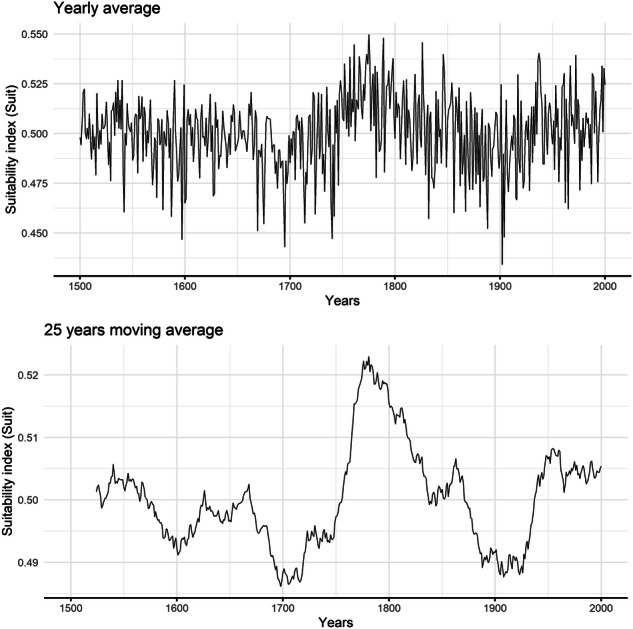
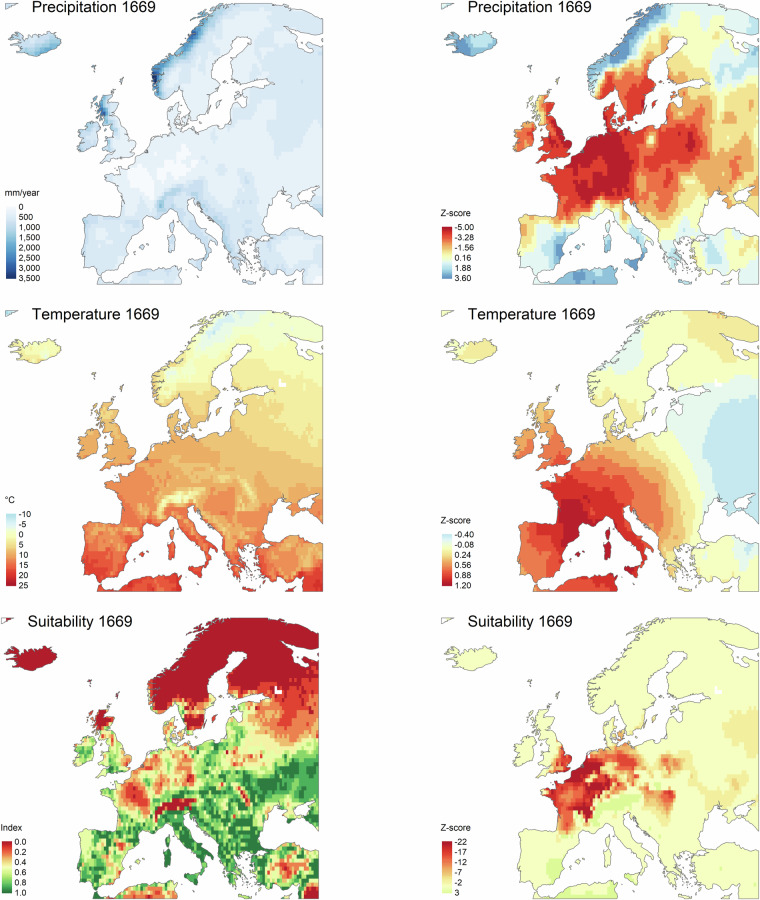
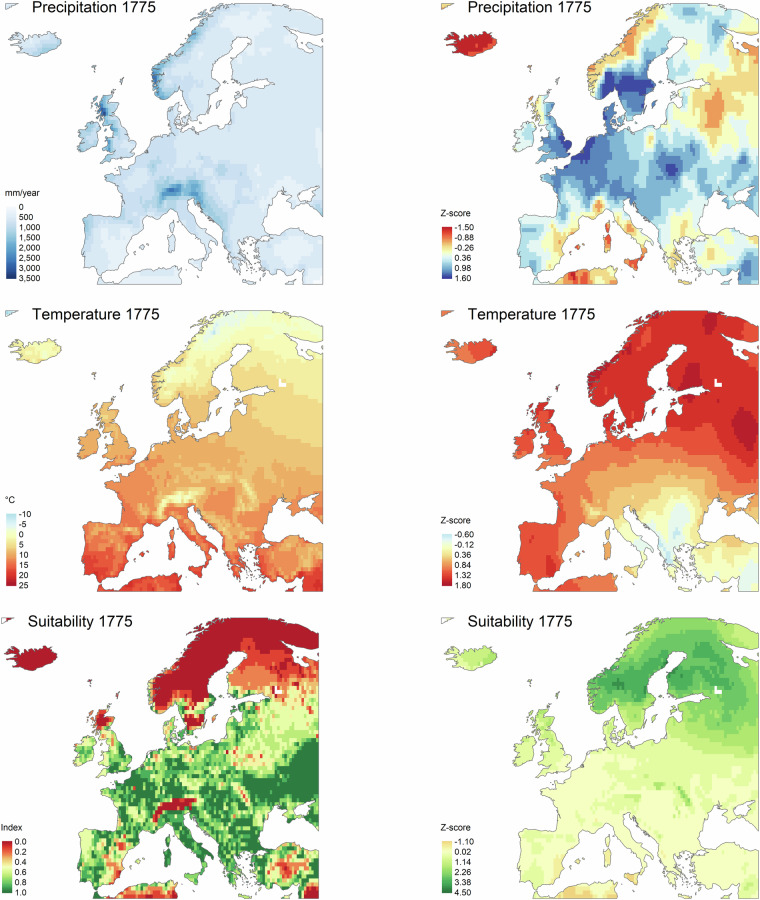
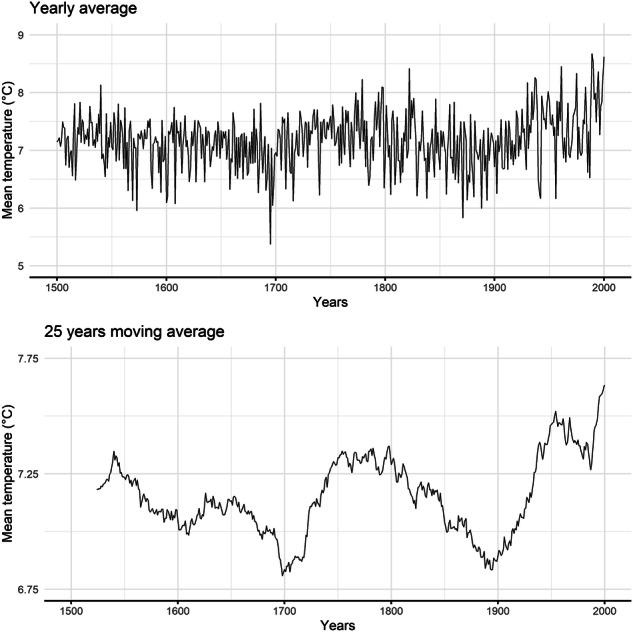
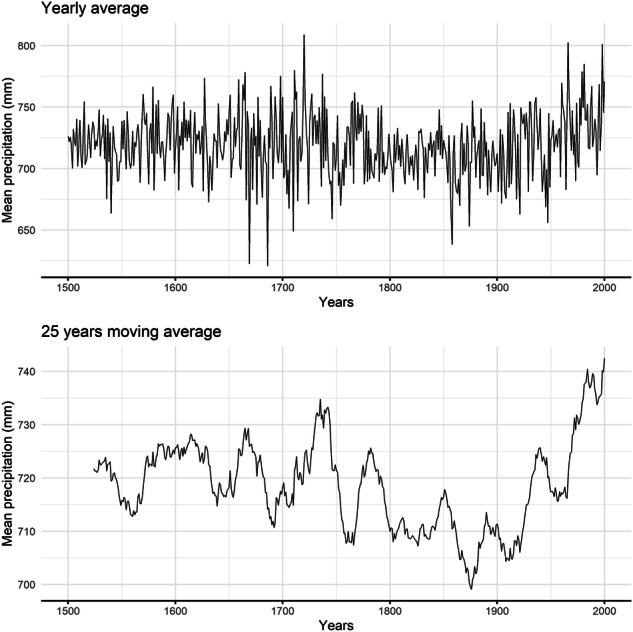
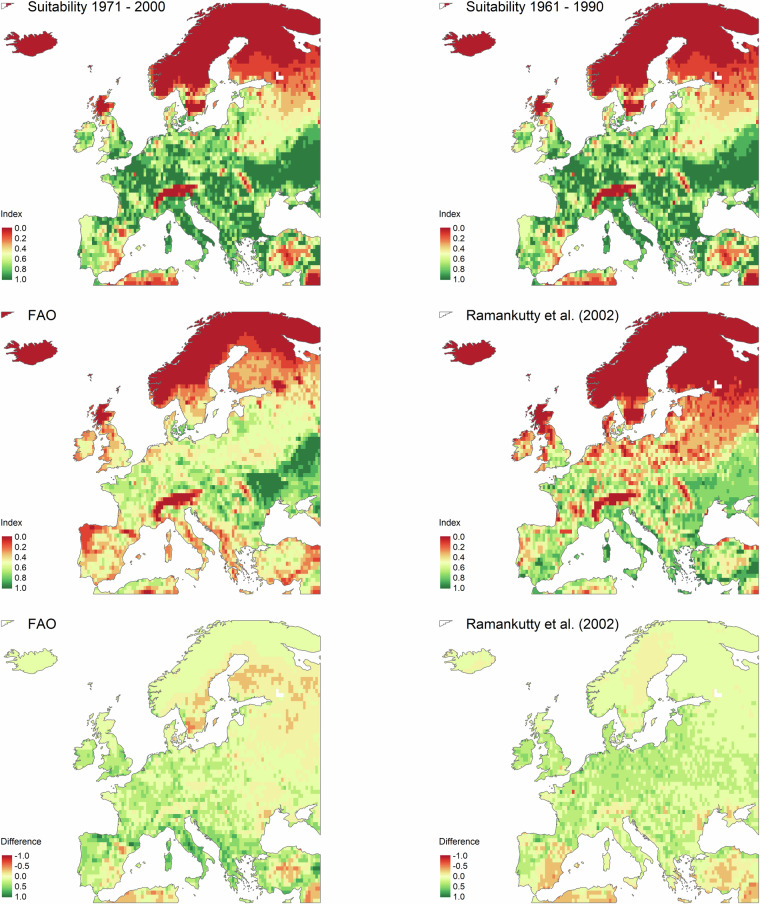
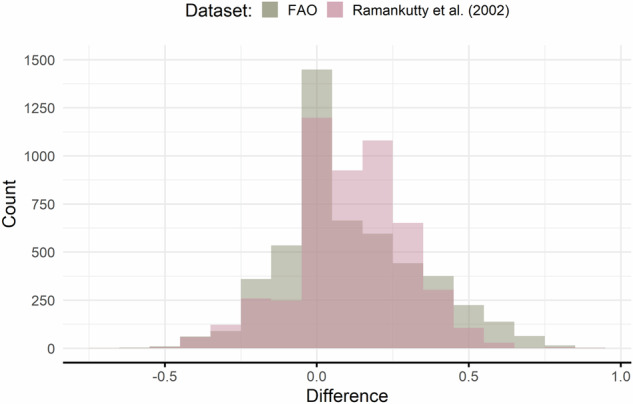
Throughout the last centuries, European climate changed substantially, which affected the potential to plant and grow crops. These changes happened not just over time but also had a spatial dimension. Yet, despite large climatic fluctuations, quantitative historical studies typically rely on static measures for agricultural suitability due to the non-availability of time-varying indices. Relying on recent advances in paleoclimatology, we bridge this gap by constructing a spatio-temporal measure for agricultural suitability across Europe for a period of 500 years. Our gridded index has a 0.5° resolution and is available at a yearly level. It relies on a simple surface energy and water balance model, focusing only on so-called exogenous geographic and climatic features. Our index captures not just long-term trends, such as the Little Ice Age, but also short-term climatic shocks. It will empower researchers to explore the interplay between climatic fluctuations and Europe's agricultural landscape, analyze human responses at a local and regional scale, and foster a deeper understanding of the region's historical dynamics.


Conflict of interest statement

Competing interests: The authors declare no competing interests.

Figures

Fig. 1
Fig. 1
Study design. Historical temperature data are taken from Luterbacher et al. and Xoplaki et al.. Historical precipitation data are from Pauling et al.. Windspeed, humidity, elevation, and sunshine hours are taken from the Climate Research Unit (CRU) CRU v.2.0 dataset. Soil characteristics such as carbon content and soil pH are from the Harmonized World Soil Database.
Fig. 2
Fig. 2
Calibration of the model using the FAO suitability index, growing degree days (GDD), the aridity index (AI), soil potential hydrogen, pH (in H20 −log(H+)) and carbon content, C (kg C/m2). Each point on the x-axis represents observations averaged over bins, and values on the y-axis correspond to the best suitability value reached by each bin. Selected points have for each calibration (except for their own): 4 < Csoil < 10, AI > 0.5, GDD > 1300, 6 < pHsoil < 8. The lines represent the different fitting curves: f(GDD), f(AI), f(C), f(pH).
Fig. 3
Fig. 3
The agricultural suitability index for Europe visualized over time using yearly variation (upper panel) and a 25-year moving average (lower panel).
Fig. 4
Fig. 4
Case study 1 (1669 AD). The left panels show the mean precipitation, mean temperature,, and our measure of agricultural suitability for the year 1669, where we register one of the lowest levels of precipitation across Europe (662.62 mm over the year). Z-score values (right panels) for each grid i have been computed using the standard formula: Z-scorex,i,t = (xi,t − μx,i)/σx,i where μxi,i and σx,i are the mean and standard deviation of variable x in grid i over the 1500-2000AD period respectively. xi,t is either yearly mean temperature, precipitation, or mean agricultural suitability for grid i at time t.
Fig. 5
Fig. 5
Case study 2 (1775 AD). The left panels show the mean precipitation, mean temperature,, and our measure of agricultural suitability for the year 1775, where we register the highest overall mean of agricultural suitability across Europe (0.55). Z-score values (right panels) for each grid i have been computed using the standard formula: Z-scorex,i,t = (xi,t − μx,i)/σx,i where μxi,i and σx,i are the mean and standard deviation of variable x in grid i over the 1500-2000AD period respectively. xi,t is either yearly mean temperature, precipitation, or mean agricultural suitability for grid i at time t.
Fig. 6
Fig. 6
Temperature time series for Europe using yearly observations (upper panel) and a 25-year moving average (lower panel).
Fig. 7
Fig. 7
Precipitation time series for Europe using yearly observations (upper panel) and a 25-year moving average (lower panel).
Fig. 8
Fig. 8
The left panel shows the correlation between the suitability index built in this study (Suit) with data averaged over the period 1971 - 2000 and a suitability index from FAO. The right panel shows the correlation between the suitability index built in this study (Suit) with data averaged over the period 1961 - 1990 and the suitability index from Ramankutty et al.. The red dashed line represents the 45° line, and the solid red line represents the linear model y = βx. The coefficient and R2 from the linear regression are shown in the top left corner.
Fig. 9
Fig. 9
Illustration of the spatial difference between suitability indices. The top panels show our measure of agricultural suitability averaged over the period 1971-2000 (as in FAO) and the period 1961-1990 (as in Ramankutty et al.) to allow consistent temporal comparison with the two benchmark indices. The middle panels represent the composite measure of agricultural suitability from FAO GAEZ and the measure of agricultural suitability by Ramankutty et al.. The lower panels show the spatial difference between suitability indices computed as follow: Difference = Suiti − Xi, where Suiti represents our measure of agricultural suitability (Suit1971−2000 for FAO and Suit1961−1990 for Ramankutty et al.) and Xi denotes the benchmark indices for grid i. Consequently, negative values indicate areas identified as more suitable by the other dataset, while positive values imply that our measure indicates grids with higher suitability conditions for cultivation.
Fig. 10
Fig. 10
The histogram shows the distribution of the differences for all 9100 grids as shown in the lower panel of Figure 9. Difference = Suiti − Xi, where Suiti represents our measure of agricultural suitability, and Xi denotes either the composite measure of agricultural suitability defined by the FAO GAEZ (FAO) or the measure of agricultural suitability by Ramankutty et al. for grid cell i. Consequently, negative values indicate areas identified as more suitable by the other dataset, while positive values imply that our measure indicates grids with higher suitability conditions for cultivation.

Similar articles

References

    1. Dowsett, H. Speaking to the past. Scientific Data7, 195, 10.1038/s41597-020-0531-6 (2020). - PMC - PubMed
    1. Lobell, D. B. & Gourdji, S. M. The Influence of Climate Change on Global Crop Productivity. Plant Physiology160, 1686–1697, 10.1104/pp.112.208298 (2012). - PMC - PubMed
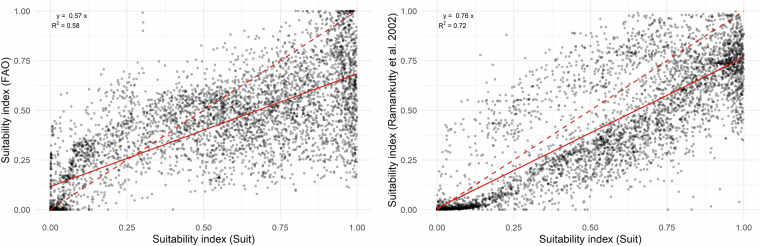
    1. Ramankutty, N., Foley, J. A., Norman, J. & McSweeney, K. The global distribution of cultivable lands: Current patterns and sensitivity to possible climate change. Global Ecology and Biogeography11, 377–392 (2002).
    1. Zabel, F., Putzenlechner, B. & Mauser, W. Global Agricultural Land Resources – A High Resolution Suitability Evaluation and Its Perspectives until 2100 under Climate Change Conditions. PLoS ONE9, 10.1371/journal.pone.0107522 (2014). - PMC - PubMed
    1. Cipolla, C. M. The Economic History of World Population (Penguin Books, Baltimore, 1962), 1 edn.