. 2025 Jan 17;15(1):2222.
doi: 10.1038/s41598-024-82500-w.

Dual RNA sequencing of a co-culture model of Pseudomonas aeruginosa and human 2D upper airway organoids

Affiliations

Dual RNA sequencing of a co-culture model of Pseudomonas aeruginosa and human 2D upper airway organoids

Cayetano Pleguezuelos-Manzano et al. Sci Rep. .

Abstract

Pseudomonas aeruginosa is a Gram-negative bacterium that is notorious for airway infections in cystic fibrosis (CF) subjects. Bacterial quorum sensing (QS) coordinates virulence factor expression and biofilm formation at population level. Better understanding of QS in the bacterium-host interaction is required. Here, we set up a new P. aeruginosa infection model, using 2D upper airway nasal organoids that were derived from 3D organoids. Using dual RNA-sequencing, we dissected the interaction between organoid epithelial cells and WT or QS-mutant P. aeruginosa strains. Since only a single healthy individual and a single CF subject were used as donors for the organoids, conclusions about CF-specific effects could not be deduced. However, P. aeruginosa induced epithelial inflammation, whereas QS signaling did not affect the epithelial airway cells. Conversely, the epithelium influenced infection-related processes of P. aeruginosa, including QS-mediated regulation. Comparison of our model with samples from the airways of CF subjects indicated that our model recapitulates important aspects of infection in vivo. Hence, the 2D airway organoid infection model is relevant and may help to reduce the future burden of P. aeruginosa infections in CF.

Keywords: Pseudomonas aeruginosa; 2D co-culture; Airway organoids; Dual RNA-sequencing; Infection model; Quorum sensing.


Conflict of interest statement

Declarations. Competing interests: HC is the head of Pharma Research and Early Development at Roche, Basel and holds several patents related to organoids technology. HC’s full disclosure is given at https://www.uu.nl/staff/JCClevers/. The other authors declare no conflict of interest.

Figures

Fig. 1
Fig. 1
Co-culture establishment of 2D-airway organoids with P. aeruginosa PAO1. (a) Schematic representation of line establishment, 3D organoid expansion and 2D ALI differentiation. (b) HE staining of the major cell types present in ALI differentiated airway organoids, goblet cells stained by MUC5AC, ciliated cells by acetylated (Ac) tubulin and basal cells by TP63. Scale bar indicates 25 μm (c) Schematic representation of co-culture establishment of PAO1-GFP and differentiated airway organoids. (d) Z projections and (e) cross-section of confocal imaging of the co-culture after 14 h. Red: F-Actin; green: PAO1-GFP; blue: DAPI. Scale bar indicates 10 μm. (f) CFU assay of WT PAO1 bacteria and PAO1 ΔQS and ΔpqsA strains following co-culture with organoids and in liquid medium at time points 0 h and 14 h. The mean of the triplicates was plotted and error bars represent standard error of the mean (SEM). To determine statistical significance between the time points, log-transformed data was analyzed using two-way ANOVA, corrected for multiple comparisons using Sidak’s test (*P < 0.05; **P < 0.005; ****P < 0.0001).
Fig. 2
Fig. 2
Co-culture characterization by Dual RNA-seq. (a) Schematic representation of the Dual RNA-seq experiment. (b) Distribution of human and bacterial reads across the different samples (technical replicates in triplicate) included in the run after performing the mapping and count assignment (as in Supplementary Fig. 1, see Supplementary Table 3). (c) Knock-out validation by gene expression. Normalized counts of pqsA, lasI and rhlI across the different samples of the cohort. Color code indicates culture condition (Green: mono-culture; magenta: co-culture) and PAO1 genotype (Dark: WT; middle: ΔpqsA; light: ΔQS). (d) PCA plot of PAO1 samples. (e) PCA plot of 2D organoid samples. Color code indicates PAO1 genotype, culture condition (co-culture or mono-culture) and organoid genotype (Healthy or CF).
Fig. 3
Fig. 3
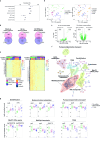
Transcriptional response of the epithelium to infection with the different PAO1 strains. (a) Schematic representation of the analysis. (b) Volcano plot showing the log2 fold change and -log10 adjusted p-value of all genes, when comparing the transcriptome of 2D organoids exposed to PAO1 WT or PAO1 ΔQS. (c) Volcano plot showing the Log2 fold change and -log10 adjusted p-value per gene comparing the transcriptome of 2D organoids exposed to PAO1 WT or unexposed controls. Green indicates differentially expressed genes (DEGs) (log2 fold change > 1 and adjusted p value < 0.05). (d) Gene ontology enrichment analysis showing top 10 categories enriched in 2D organoids exposed to PAO1 WT. Left panel: Healthy organoid line. Right: CF organoid line. (e) Gene expression heat map of genes from “Response to lipopolysaccharide” GO term category (GO:0032496). Color code indicates culture condition (co-culture or mono-culture) and PAO1 genotype (WT, ΔpqsA or ΔQS). Heatmaps were plotted using the pheatmap function of DESeq279 (version 1.36.0) in Rstudio.
Fig. 4
Fig. 4
Transcriptional response of PAO1 to the presence of airway epithelium. (a) Schematic representation of the analysis. (b) Volcano plot displaying the Log2 fold change and –log10 adjusted p-value of all genes, when comparing the PAO1 transcriptomes of co-culture and bacterial mono-culture samples. Green indicates differentially expressed genes (DEGs) (log2 fold change > 1 and adjusted p value < 0.05). The number of genes upregulated in co-culture and bacterial mono-culture is indicated. (c) Gene ontology enrichment analysis showing top 10 categories enriched in PAO1 exposed to airway epithelium in co-culture. (d) Normalized count plots of genes involved in CCR pathway, crc and crcZ. (e) KEGG pathway pae00910 plot displaying the log2 fold change of genes involved in denitrification. DEGs from co-culture vs. bacterial culture mono-culture comparison of PAO1 transcriptomes. (f) Normalized count plots of genes involved in P. aeruginosa antibiotic resistance. (g) Heat map displaying expression of genes involved in P. aeruginosa T6SS. Genes grouped by H1, H2 or H3 T6SS subtype,. Samples grouped by culture condition. Color code indicates culture condition (Green: bacterial mono-culture; magenta: co-culture) and PAO1 genotype (Dark: WT; middle: ΔpqsA; light: ΔQS). Heatmaps were plotted using the pheatmap function of DESeq279 (version 1.36.0) in Rstudio.
Fig. 5
Fig. 5
Epithelial effect on PAO1 QS regulation. (a) Gene expression heat map of genes involved in PQS, Las or Rhl QS pathways. (b) Volcano plots displaying gene log2 fold change and –log10 adjusted p-value when comparing the transcriptomes of WT and ΔpqsA PAO1 to those of ΔQS in co-culture (top) and in pure bacterial cultures (bottom). Venn diagrams display the overlap between genes up (right) and downregulated (left) in the comparisons. (c) Gene ontology enrichment analysis showing top 10 categories enriched in genes that are specifically upregulated in co-culture in WT and ΔpqsA PAO1 transcriptomes compared to ΔQS. (d) Gene expression heat map showing top 50 co-culture-specific DEGs. Genes are color-coded according to the following categories (Yellow: T6SS; purple: T2SS; green: Leucine metabolism; red: other pathways). (e) Gene expression heat map of T6SS eukaryotic and prokaryotic effectors. Sample color code indicates culture condition (Green: bacterial culture mono-culture; magenta: co-culture) and PAO1 genotype (Dark: WT; middle: ΔpqsA; light: ΔQS). Heatmaps were plotted using the pheatmap function of DESeq2 (version 1.36.0) in Rstudio.
Fig. 6
Fig. 6
Benchmarking co-culture model with in vivo P. aeruginosa transcriptomic datasets directly isolated from the airways of CF subjects. (a) Accuracy analysis using gene-wise mean and standard deviation values from in vivo samples in Lewin et al., 2023 as reference. Genes were considered accurate if their expression was within 2 standard deviations of the mean in the in vivo sample. (b) PCA plots showing sample distribution by condition (Magenta: co-culture; green: bacterial culture in isolates; purple: in vivo) or by study of origin (Orange: this study; purple: Cornforth et al., 2018; pink: Kordes et al., 2019; blue: Rossi et al., 2018). (c) Volcano plots displaying gene log2 fold change and -log10 adjusted p-value comparing transcriptomes of in vivo P. aeruginosa (left) or co-cultured PAO1 (right) to those of all pure bacterial culture samples. Green indicates differentially expressed genes (DEGs) (log2 fold change > 1 and adjusted p value < 0.05). Indicated in the boxes the number of up- or downregulated DEGs. (d) Venn diagrams displaying the overlap between genes that are upregulated (left), downregulated (middle), or both (right) in the previous in vivo and co-culture comparison to in vitro and mono-culture samples (b). (e) Expression heat map displaying the common up-(left) and downregulated (right) genes. Samples clustered based on the expression of all genes plotted per heat map. Color-code indicates condition (Magenta: co-culture; green: pure bacteria; purple: in vivo) and study of origin (Orange: this study; purple: Cornforth et al., 2018; pink: Kordes et al., 2019; blue: Rossi et al., 2018). Heatmaps were plotted using the pheatmap function of DESeq2 (version 1.36.0) in Rstudio. (f) Protein-protein interaction network of common DEGs (in vivo and co-culture. Each node represents a protein encoded by a DEG. Edges represent known protein-protein association (either physical or functional) with a confidence level higher than 0.7. Node color represent clusters generated MCL method. Highlighted the pathway to which the cluster proteins belong. (g) Log2 normalized count plots of representative genes from pathways highlighted by the network analysis. Color-code indicates Magenta: co-culture, green: pure bacteria and purple: in vivo.

Similar articles

Cited by

References

    1. Malhotra, S., Hayes, D. & Wozniak, D. J. Cystic fibrosis and Pseudomonas aeruginosa: the host-microbe interface. Clin. Microbiol. Rev.32, 1–46 (2019). - PMC - PubMed
    1. Quinton, P. M. Cystic fibrosis: Impaired bicarbonate secretion and mucoviscidosis. Lancet372, 415–417 (2008). - PubMed
    1. Kunzelmann, K., Schreiber, R. & Hadorn, H. B. Bicarbonate in cystic fibrosis. J. Cyst. Fibros.16, 653–662 (2017). - PubMed
    1. Forbes, E. & Abu-Sbaih, R. Cystic fibrosis. Nat. Rev. Dis. Primers. 10.1038/nrdp.2015.49 (2015).
    1. De Boeck, K. Cystic fibrosis in the year 2020: A disease with a new face. Acta Paediatr. Int. J. Paediatrics. 109, 893–899 (2020). - PubMed

MeSH terms