. 2025 Jan 17;15(1):2245.
doi: 10.1038/s41598-025-86134-4.

Integrative genetics and multiomics analysis reveal mechanisms and therapeutic targets in vitiligo highlighting JAK STAT pathway regulation of CTSS

Affiliations

Integrative genetics and multiomics analysis reveal mechanisms and therapeutic targets in vitiligo highlighting JAK STAT pathway regulation of CTSS

Zi-Yue Dong et al. Sci Rep. .

Abstract

Vitiligo is a complex autoimmune disease characterized by the loss of melanocytes, leading to skin depigmentation. Despite advances in understanding its genetic and molecular basis, the precise mechanisms driving vitiligo remain elusive. Integrating multiple layers of omics data can provide a comprehensive view of disease pathogenesis and identify potential therapeutic targets. The study aims to delineate the genetic and molecular mechanisms of vitiligo pathogenesis using an integrative multiomics strategy. We focus on exploring the regulatory influence of the JAK/STAT pathway on Cathepsin S, a potential therapeutic target in vitiligo. Our GWAS-meta analysis pinpointed five druggable genes: ERBB3, RHOH, CDK10, MC1R, and NDUFAF3, and underwent drug target exploration and molecular docking. SMR analysis linked CTSS, CTSH, STX8, KIR2DL3, and GRHPR to vitiligo through pQTL and eQTL associations. Microarray and single-cell RNA-seq data showed differential expression of CTSS and STAT1/3 in vitiligo patients' blood and skin lesions. Our study offers novel perspectives on vitiligo's genetic and molecular basis, highlighting the JAK/STAT pathway's role in regulating CTSS for antigen processing in melanocytes. Further research is needed to confirm these results and assess the therapeutic potential of CTSS and related genes.

Keywords: Bioinformatics; CTSS; GWAS; Multiomics; Therapeutic targets; Vitiligo.


Conflict of interest statement

Declarations. Competing interests: The authors declare no competing interests. Ethics statement: The data used in this study were derived from previously published research, which obtained ethical approval from their respective committees. Therefore, no additional ethical permission was required for our study. Consent for publication: In the manuscript, consent was obtained from each individual for any form of personal data included.

Figures

Fig. 1
Fig. 1
Study design overview. Part 1: Genome-Wide Association Study (GWAS) Meta-Analysis and Druggability Analysis. Part 2: Causal Gene Identification and Regulatory Network Construction. Part 3: Transcriptomic Analysis and Mechanistic Exploration.
Fig. 2
Fig. 2
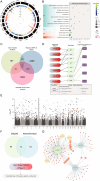
Comprehensive Analysis of Genome-Wide Association Study (GWAS) Meta-Analysis and Druggability. (A) Genome-wide Manhattan plot illustrating the distribution of single nucleotide polymorphism (SNP) associations across all chromosomes. (B) Gene set enrichment analysis results from Multi-marker Analysis of Genomic Annotation (MAGMA), highlighting pathways associated with vitiligo. (C) Venn diagram showing the intersection of genes identified from MAGMA gene-based analysis, the Open Targets Platform, and Functional Mapping and Annotation (FUMA) Mapping SNPs to Genes. (D) Schematic representation of the relationship between existing vitiligo drugs, their targets, and the five newly identified druggable genes. (E) Locations of the five druggable genes on the genome-wide Manhattan plot. (F) Identification of related drugs for the five druggable genes using Drug Signatures Database (DSigDB) and Network Analyst, followed by further screening through the Open Targets Platform to obtain three candidate drugs. (G) NetworkAnalyst visualization of the relationships between the three candidate drugs and the three candidate genes.
Fig. 3
Fig. 3
Docking results of the target drugs with their respective proteins. (A) Docking results of ERBB3 with Chloroquine. (B) Docking results of ERBB3 with Lapatinib. (C) Docking results of ERBB3 with Quercetin. (D) Docking results of RHOH with Quercetin. The figure includes three-dimensional (3D) structures of the target proteins and their interactions with the drugs, as well as 2D interaction diagrams highlighting key bonds and interaction sites. ERBB3: Receptor tyrosine-protein kinase erbB-3; RHOH: Rho-related GTP-binding protein RhoH.
Fig. 4
Fig. 4
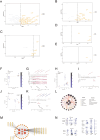
(A) Protein quantitative trait loci (pQTL) discovery set from the deCODE database identified 55 causal proteins. (B) pQTL validation set from the UK Biobank Proteomics Project (UKB-PPP) database confirmed 23 of these proteins as causal. (C) Expression quantitative trait loci (eQTL) discovery set from eQTLGen found 9 of the 23 pQTL causal proteins with consistent causal relationships at the eQTL level. (D, E) Cross-tissue validation using Genotype-Tissue Expression (GTEx) V8 in blood (D) and skin (E) confirmed the causal relationships of glyoxylate reductase/hydroxypyruvate reductase (GRHPR), cathepsin H (CTSH), cathepsin S (CTSS), syntaxin 8 (STX8), and killer cell immunoglobulin-like receptor 2DL3 (KIR2DL3) with vitiligo. (F, H, J) Scatter plots for CTSS, STX8, and GRHPR respectively, using GTEx skin eQTL data as examples. Each point represents a SNP, with the x-axis showing its effect size in eQTLs and the y-axis showing its effect size in GWAS studies. The red triangle indicates the most significant cis-eQTL SNP, while other SNPs are color-coded by their linkage disequilibrium (R2) with the top SNP (color mapping shown in the legend). (G, I, K) Chromosome locus plots for CTSS, STX8, and GRHPR, respectively. The top panel shows GWAS SNPs as grey circles along the chromosome region, while the diamonds represent gene expression probes. Maroon diamonds indicate probes passing the Summary-based Mendelian Randomization (SMR) threshold, navy diamonds indicate probes not passing the SMR threshold, solid diamonds indicate probes passing the Heterogeneity in Dependent Instruments (HEIDI) threshold, and hollow diamonds indicate probes not passing the HEIDI threshold. (L) Protein-protein interaction network for the four pathogenic genes (proteins) constructed using Gene Multiple Association Network Integration Algorithm (GeneMANIA). (M) Transcription factor (TF) prediction network identifying signal transducer and activator of transcription 1 (STAT1), STAT3, and CCCTC-binding factor (CTCF) as key TFs regulating STX8, CTSH, and CTSS. (N) Validation of TF binding using Encyclopedia of DNA Elements (ENCODE) chromatin immunoprecipitation sequencing (ChIP-seq) data showing peak heights in Integrative Genomics Viewer (IGV) software with Autoscale; global IGV view provided in the Supplementary Fig. 4.
Fig. 5
Fig. 5
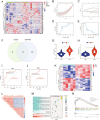
(A) Heatmap of differentially expressed genes (DEGs) between vitiligo patients and healthy controls. (B, C) Feature genes identified by Least Absolute Shrinkage and Selection Operator (LASSO) regression analysis, showing 13 feature genes. (D, E) Feature genes identified by Support Vector Machine-Recursive Feature Elimination (SVM-RFE) analysis, showing 24 feature genes. (F) Venn diagram of intersecting feature genes from LASSO and SVM-RFE analyses, identifying 11 common feature genes: leukocyte immunoglobulin-like receptor subfamily B member 4 (LILRB4), protein phosphatase 2 regulatory subunit 4 (PPP2R4), peptidase inhibitor 3 (PI3), lipocalin 2 (LCN2), MHC class I polypeptide-related sequence B (MICB), RAP1 GTPase activating protein 2 (RAP1GAP2), collagen type XIII alpha 1 chain (COL13A1), CTSS, STAT3, ubiquitously transcribed tetratricopeptide repeat gene on the Y chromosome (UTY), and coagulation factor II receptor (F2R). (G, H) Violin plots showing the differential expression of CTSS and its transcription factor STAT3 between vitiligo patients and healthy controls. (I, J) Receiver operating characteristic (ROC) curves for CTSS and STAT3, indicating diagnostic value with area under the curve (AUC) values greater than 0.85. (K) Heatmap of single-gene grouping for CTSS, highlighting significant differences in gene expression. (L) Co-expression heatmap of CTSS with other genes, indicating co-expression with STAT3 in peripheral blood. (M) Gene Ontology (GO)/Kyoto Encyclopedia of Genes and Genomes (KEGG) enrichment analysis of CTSS single-gene grouping, showing the 15 significant pathways. (N) Gene Set Enrichment Analysis (GSEA) of gene sets enriched in the high CTSS expression group, highlighting apoptosis and Janus kinase/signal transducer and activator of transcription (JAK/STAT) signaling pathways among the top 5 pathways.
Fig. 6
Fig. 6
(A) Uniform Manifold Approximation and Projection (UMAP) plot of cell clustering from single-cell RNA sequencing (scRNA-seq) data of vitiligo lesions (GSE203262), showing the distribution of different cell types. (B) CTSS exhibits the highest expression levels in dendritic cells, followed by melanocytes, making it a cellular marker for dendritic cells. (C) Violin plots for STAT1, STAT2, STAT3, interferon gamma receptor 1 (IFNGR1), IFNGR2, and CTSS, illustrating their differential expression across different cell types in vitiligo lesions. Detailed information on cell markers and differentially expressed genes across cell types can be found in the Supplementary Tables S12–S14.

Similar articles

Cited by

References

    1. Alikhan, A., Felsten, L. M., Daly, M. & Petronic-Rosic, V. Vitiligo: a comprehensive overview Part I. Introduction, epidemiology, quality of life, diagnosis, differential diagnosis, associations, histopathology, etiology, and work-up. J. Am. Acad. Dermatol.65(3), 473–491 (2011). - PubMed
    1. Ezzedine, K., Eleftheriadou, V., Whitton, M. & van Geel, N. Vitiligo. Lancet Lond Engl.386(9988), 74–84 (2015). - PubMed
    1. Rodrigues, M. et al. Current and emerging treatments for vitiligo. J. Am. Acad. Dermatol.77(1), 17–29 (2017). - PubMed
    1. Jin, Y. et al. Genome-wide association analyses identify 13 new susceptibility loci for generalized vitiligo. Nat. Genet.44(6), 676–680 (2012). - PMC - PubMed
    1. Jin, Y. et al. Genome-wide association studies of autoimmune vitiligo identify 23 new risk loci and highlight key pathways and regulatory variants. Nat. Genet.48(11), 1418–1424 (2016). - PMC - PubMed

Publication types