

Exploration of linear and interpretable models for quantification of cell parameters via contactless short-wave infrared hyperspectral sensing
- PMID: 39824926
- PMCID: PMC11742655
- DOI: 10.1038/s41598-025-85930-2
Exploration of linear and interpretable models for quantification of cell parameters via contactless short-wave infrared hyperspectral sensing
Abstract
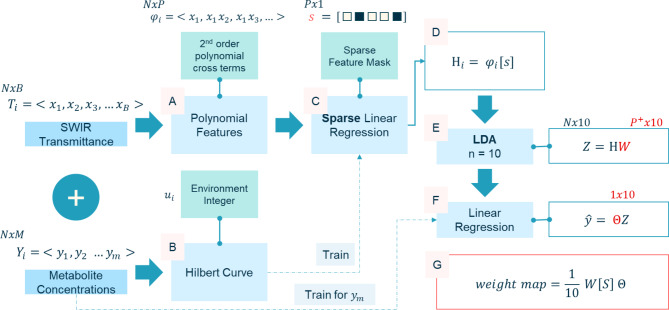
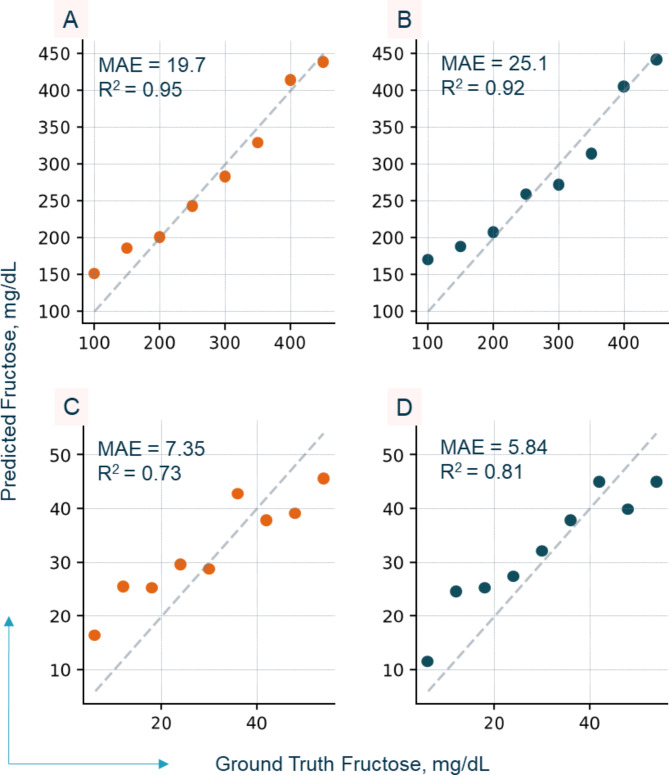
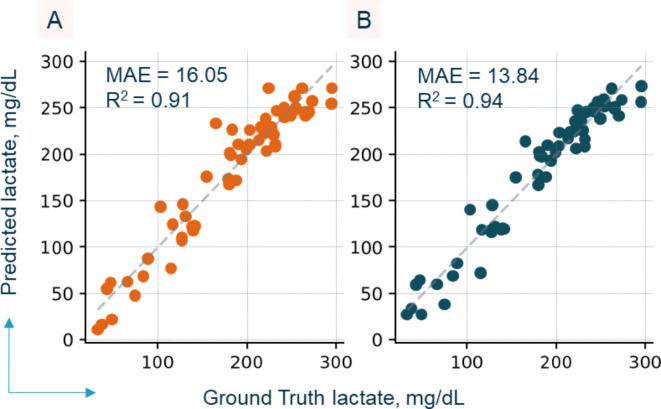
The development of optical sensors for label-free quantification of cell parameters has numerous uses in the biomedical arena. However, using current optical probes requires the laborious collection of sufficiently large datasets that can be used to calibrate optical probe signals to true metabolite concentrations. Further, most practitioners find it difficult to confidently adapt black box chemometric models that are difficult to troubleshoot in high-stakes applications such as biopharmaceutical manufacturing. Replacing optical probes with contactless short-wave infrared (SWIR) hyperspectral cameras allows efficient collection of thousands of absorption signals in a handful of images. This high repetition allows for effective denoising of each spectrum, so interpretable linear models can quantify metabolites. To illustrate, an interpretable linear model called L-SLR is trained using small datasets obtained with a SWIR HSI camera to quantify fructose, viable cell density (VCD), glucose, and lactate. The performance of this model is also compared to other existing linear models, namely Partial Least Squares (PLS) and Non-negative Matrix Factorization (NMF). Using only 50% of the dataset for training, reasonable test performance of mean absolute error (MAE) and correlations (r2) are achieved for glucose (r2 = 0.88, MAE = 37 mg/dL), lactate (r2 = 0.93, MAE = 15.08 mg/dL), and VCD (r2 = 0.81, MAE = 8.6 × 10⁵ cells/mL). Further, these models are also able to handle quantification of a metabolite like fructose in the presence of high background concentration of similar metabolite with almost identical chemical interactions in water like glucose. The model achieves reasonable quantification performance for large fructose level (100-1000 mg/dL) quantification (r2 = 0.92, MAE = 25.1 mg/dL) and small fructose level (< 60 mg/dL) concentrations (r2 = 0.85, MAE = 4.97 mg/dL) in complex media like Fetal Bovine Serum (FBS). Finally, the model provides sparse interpretable weight matrices that hint at the underlying solution changes that correlate to each cell parameter prediction.
Keywords: Contactless bio-sensor; Machine learning; Near infrared (NIR); Short wave infrared (SWIR).
© 2025. The Author(s).
Conflict of interest statement
Declarations. Competing interests: The authors declare no competing interests.
Figures


References
-
- Costariol, E. et al. Demonstrating the manufacture of human CAR-T cells in an automated stirred-tank bioreactor. Biotechnol. J.15, 2000177 (2020). - PubMed
-
- Kruszynska, Y. T., Meyer-Alber, A., Wollen, N. & McIntyre, N. Energy expenditure and substrate metabolism after oral fructose in patients with cirrhosis. J. Hepatol.19, 241–251 (1993). - PubMed
-
- Schwarz, H., Mäkinen, M. E., Castan, A. & Chotteau, V. Monitoring of amino acids and antibody N-glycosylation in high cell density perfusion culture based on Raman spectroscopy. Biochem. Eng. J.182, 108426 (2022).
-
- Ishigaki, M. et al. Development of an amino acid sequence-dependent analytical method for peptides using near-infrared spectroscopy. Analyst147, 3634–3642 (2022). - PubMed
Publication types
MeSH terms
Substances
Grants and funding
- 1840340/National Science Foundation Graduate Research Fellowship Program
- P30 CA134274/CA/NCI NIH HHS/United States
- 1UL1TR003098/National Center for Advancing Translational Sciences (NCATS) Clinical Translational Science Award (CTSA)
- P30CA134274/National Cancer Institute-Cancer Center Support Grant
- CH-649-CRFT/Maryland Department of Health's Cigarette Restitution Fund Program
LinkOut - more resources
Full Text Sources
Miscellaneous
