Observational Study
. 2025 Mar;31(3):807-818.
doi: 10.1038/s41591-024-03424-6. Epub 2025 Jan 17.

Somatic CAG repeat expansion in blood associates with biomarkers of neurodegeneration in Huntington's disease decades before clinical motor diagnosis

Affiliations
Observational Study

Somatic CAG repeat expansion in blood associates with biomarkers of neurodegeneration in Huntington's disease decades before clinical motor diagnosis

Rachael I Scahill et al. Nat Med. 2025 Mar.

Abstract

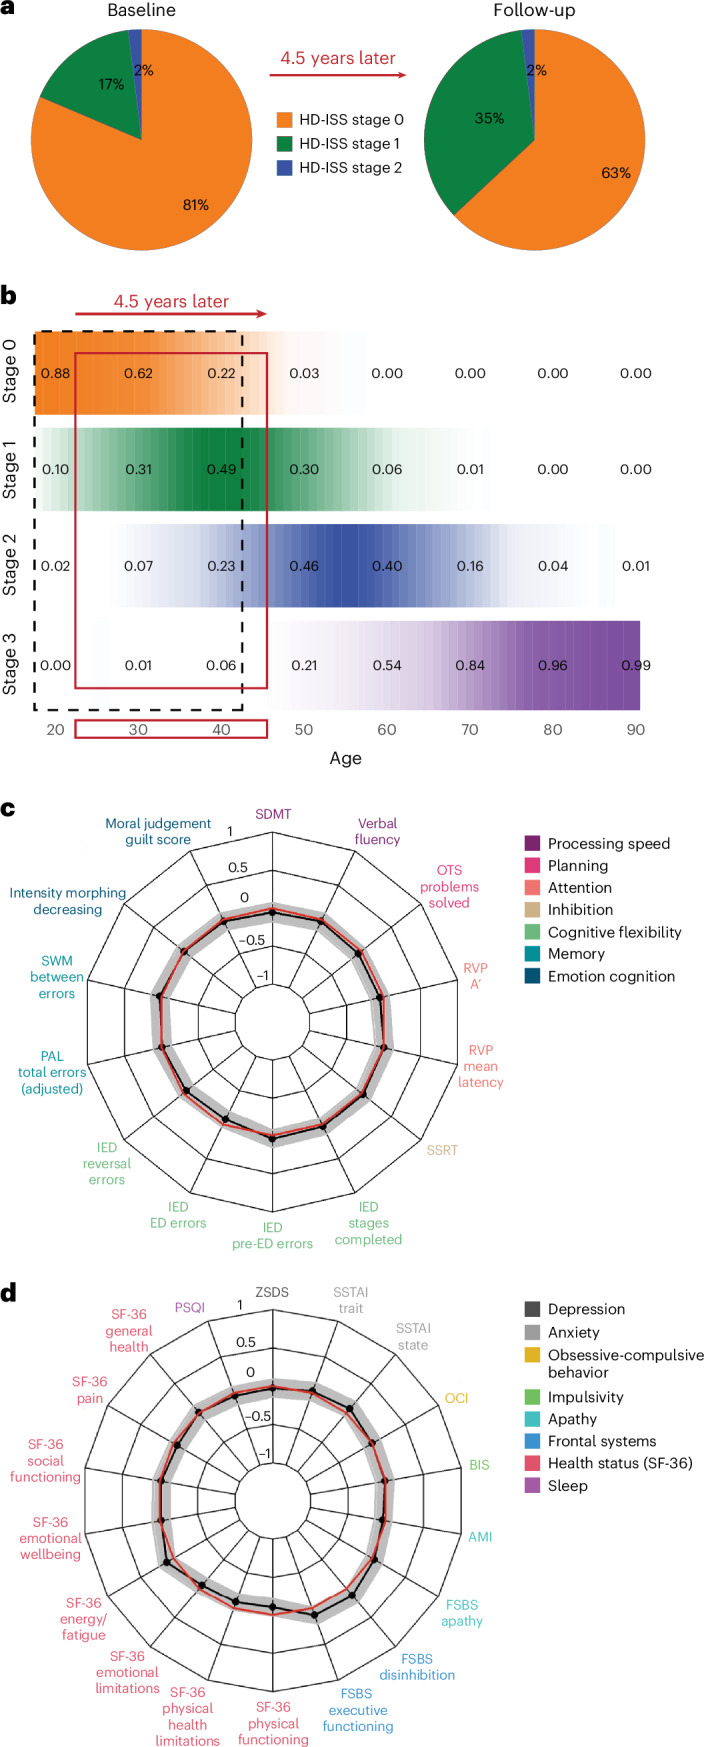
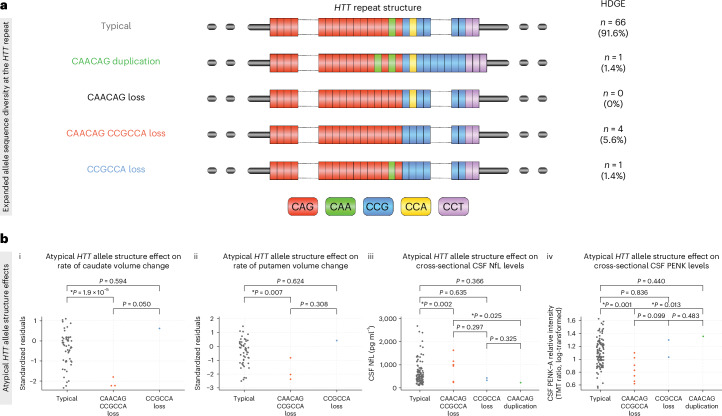
Huntington's disease (HD) is an autosomal dominant neurodegenerative disease with the age at which characteristic symptoms manifest strongly influenced by inherited HTT CAG length. Somatic CAG expansion occurs throughout life and understanding the impact of somatic expansion on neurodegeneration is key to developing therapeutic targets. In 57 HD gene expanded (HDGE) individuals, ~23 years before their predicted clinical motor diagnosis, no significant decline in clinical, cognitive or neuropsychiatric function was observed over 4.5 years compared with 46 controls (false discovery rate (FDR) > 0.3). However, cerebrospinal fluid (CSF) markers showed very early signs of neurodegeneration in HDGE with elevated neurofilament light (NfL) protein, an indicator of neuroaxonal damage (FDR = 3.2 × 10⁻¹²), and reduced proenkephalin (PENK), a surrogate marker for the state of striatal medium spiny neurons (FDR = 2.6 × 10⁻³), accompanied by brain atrophy, predominantly in the caudate (FDR = 5.5 × 10⁻¹⁰) and putamen (FDR = 1.2 × 10⁻⁹). Longitudinal increase in somatic CAG repeat expansion ratio (SER) in blood was a significant predictor of subsequent caudate (FDR = 0.072) and putamen (FDR = 0.148) atrophy. Atypical loss of interruption HTT repeat structures, known to predict earlier age at clinical motor diagnosis, was associated with substantially faster caudate and putamen atrophy. We provide evidence in living humans that the influence of CAG length on HD neuropathology is mediated by somatic CAG repeat expansion. These critical mechanistic insights into the earliest neurodegenerative changes will inform the design of preventative clinical trials aimed at modulating somatic expansion. ClinicalTrials.gov registration: NCT06391619 .


Conflict of interest statement

Competing interests: J.B.R. is supported by the Wellcome Trust (220258), the Medical Research Council (MC_UU_00030/14; MR/T033371/1) and the NIHR Cambridge Biomedical Research Centre (NIHR203312). The views expressed are those of the authors and not necessarily those of the NIHR or the Department of Health and Social Care. J.B.R. has undertaken paid consultancy for Asceneuron, Astronautx, Astex, ClinicalInk, CumulusNeuro, Curasen, Invivro, Prevail and SVHealth; received research funding unrelated to the current work from AstraZeneca, Lily, GSK and Janssen; and is Chief Scientific Advisor to Alzheimer’s Research UK. D.G.M. has been a scientific consultant and/or received honoraria/grants from AMO Pharma, Dyne, F. Hoffman-La Roche, Function Rx, LoQus23, MOMA Therapeutics, Novartis, Ono Pharmaceuticals, Pfizer Pharmaceuticals, Rgenta Therapeutics, Sanofi and Sarepta Therapeutics. J.G. is supported by Alzheimerfonden (AF-980746) and Stiftelsen för Gamla tjänarinnor (2022-01324). J.B.R. has appeared as an expert witness to the Medicines and Healthcare products Regulatory Agency, unrelated to the current work. D.G.M. is on the Scientific Advisory Board of the Myotonic Dystrophy Foundation and EuroDyMA (European Dystrophia Myotonica Association), is a scientific advisor to the Myotonic Dystrophy Support Group and is a vice president for research of Muscular Dystrophy UK. G.R. is a nonexecutive director of UCL Business. D.R.L. is an unpaid academic member of the Critical Path Institute HD-RSC Consortium Coordinating Committee. B.J.S. is a co-inventor of the Cambridge Neuropsychological Test Automated Battery. I.B.M. is an associate editor for Frontiers in Neurology. The other authors declare no competing interests.

Figures

Fig. 1
Fig. 1. Longitudinal change in clinical, cognitive and neuropsychiatric measures.
a, The distribution of HD-ISS stages at baseline and at follow-up 4.5 years later. b, A probability matrix for being in each HD-ISS stage across different ages for individuals with a mean CAG repeat length of 42, which is comparable to the HD-YAS cohort. These probabilities are derived from data in the Enroll-HD, PREDICT-HD and TRACK-HD studies, which were used to develop the HD-ISS. The black dashed box highlights the HD-YAS cohort at baseline, while the red box indicates their position at follow-up after 4.5 years. c, A radar plot showing group differences in longitudinal changes in cognitive measures. d, A radar plot showing group differences in longitudinal changes for neuropsychiatric and functional measures. The black line represents the standardized mean difference between the HDGE and control groups, with conventional frequentist 95% CI shaded in gray. The red circle denotes no difference between means; values within this circle indicate greater change over time in the HDGE group. After FDR correction for multiple comparisons, there were no significant longitudinal group differences in any cognitive or neuropsychiatric measures. Further details on longitudinal changes in cognitive measures can be found in Supplementary Table 1 and neuropsychiatric measures in Supplementary Table 2. Cross-sectional changes in cognitive measures are presented in Supplementary Table 3 and neuropsychiatric changes in Supplementary Table 4. Cross-sectional findings are visualized in Supplementary Fig. 1. AMI, Apathy Motivation Index; BIS, Barratt Impulsivity Scale; CI, confidence interval; ED, extra dimensional; FSBS, Frontal Systems Behavioral Scale; IED, intra–extra-dimensional set shifting; OCI, Obsessive-Compulsive Inventory; OTS, One Touch Stockings; PAL, paired associates learning; PSQI, Pittsburgh Sleep Quality Index; RVP, rapid visual processing; RVP A’, a signal detection theory measure of target sensitivity and mean response latency; SDMT, Symbol Digit Modalities Test; SF-36, 36-item self-report survey; SSRT, stop-signal reaction time; SSTAI, Speilberger State-Trait Anxiety Inventory; SWM, spatial working memory; ZSDS, Zung Self-rating Depression Score.
Fig. 2
Fig. 2. Annualized changes in volumetric measures longitudinally.
af, Putamen (a), caudate (b), gray matter (c), white matter (d), whole brain (e) and ventricles (f) are shown. For each structure, we present (i) comparison of standardized residuals (age- and sex-adjusted) for the annualized rate of change in HDGE (n = 54; red) and control (n = 34; gray) groups, (ii) comparison of standardized residuals for annualized rate of change within HDGE by follow-up HD-ISS stage 0 (orange) and stage 1 (green) and (iii) scatterplots of volume by CAP100 score, colored by HD-ISS stage within HDGE. Repeated visits per participant are connected by black lines, with baseline shown as squares and follow-up as circles. HD-ISS stages are represented as follows: stage 0 (orange), stage 1 (green) and stage 2 (blue). Negative standardized residuals denote a rate of change below the adjusted mean across groups. Each box plot displays the median (horizontal line), interquartile range (box) and whiskers extending to 1.5× IQR. Sample sizes (n) reflect biological replicates per group, with n = 54 for HDGE and n = 34 for controls; data represent longitudinal measures per participant, with no technical replicates. Volumetric change analyses for brain structures, excluding the putamen, used a single boundary-shift integral measure or voxel-based morphometry measure of scan pairs per participant (baseline to follow-up) converted to annual rates and modeled by ordinary least squares regression. Putamen changes were calculated by subtracting baseline MALP-EM segmentations from follow-up segmentations and dividing the result by the follow-up duration. Analysis results and residual adjustments reflect control for baseline age, sex and their interaction. Statistical two-sided group comparisons were adjusted for multiple comparisons using the FDR, with P values, degrees of freedom and confidence limits provided in Extended Data Table 2. CAP, CAG-Age Product; ICV, intracranial volume; IQR, interquartile range.
Fig. 3
Fig. 3. Annualized changes in biofluid markers longitudinally.
ac, CSF NfL (a), CSF PENK (b) and CSF YKL-40 (c) are shown. For each biofluid biomarker, we present (i) comparison of standardized residuals (age- and sex-adjusted) for the annualized rate of change in HDGE (n = 48; red) and control (n = 30; gray) groups, (ii) comparison of standardized residuals for annualized rate of change within HDGE by HD-ISS stage 0 (orange) and stage 1 (green) and (iii) scatterplots of biofluid marker levels by CAP100 score, colored by HD-ISS stage within HDGE. Repeated visits per participant are connected by black lines, with baseline shown as squares and follow-up as circles. HD-ISS stages are represented as follows: stage 0 (orange), stage 1 (green) and stage 2 (blue). Negative standardized residuals denote a rate of change below the adjusted mean across groups. Each box plot displays the median (horizontal line), interquartile range (box) and whiskers extending to 1.5× IQR. Sample sizes (n) reflect biological replicates per group, with n = 48 for HDGE and n = 30 for controls; data represent longitudinal measures per participant. All statistical analyses were conducted using mixed-effect linear models with a participant-specific random effect, controlling for age, sex and their interaction. Natural log-transformed concentrations served as the outcomes in these models. Statistical two-sided group comparisons were adjusted for multiple comparisons using the FDR, with P values, degrees of freedom and confidence limits provided in Supplementary Table 17. Please note one prominent outlier in the control group with marked NfL elevation, as previously reported at baseline. This outlier showed no additional cause on further investigation, with normal T1 MRI brain scan and normal CSF white and red cell counts. Additionally, this control participant did not deviate from other biofluid or cognitive parameters and was, therefore, not excluded from the analysis.
Fig. 4
Fig. 4. Effects of somatic expansion.
a, Longitudinal changes in SER—(i) SER trajectories by CAP100 and HD-ISS stage with baseline visits represented by squares and follow-up visits by circles, and lines connecting data from the same individual, where stage 0 is shown in orange, stage 1 in green, and stage 2 in blue; (ii) changes in SER between visits and (iii) changes in SER by age and CAG repeat length. b,c, Associations between longitudinal SER increase and caudate (b) and putamen (c) volume change, (i) before and (ii) after age-by-CAG correction. d,e, Associations of baseline SER with cross-sectional CSF NfL (d) and CSF PENK (e) levels, with (i) before and (ii) after age-by-CAG correction. Associations were modeled via mixed effects regression using the measure on the vertical axis as the outcome and controlled for age, sex and age-by-sex interaction. Longitudinal caudate change based on a single boundary-shift integral measure per participant was an exception where an analogous ordinary least-squares model was employed.
Fig. 5
Fig. 5. Effects of CAG architecture and allelic variants.
a, Illustration of the HTT repeat structure and allelic variations in the HDGE cohort (n = 72), including the typical structure and four atypical variants—CAACAG duplication (green), CAACAG loss (black, not observed in cohort), CAACAG CCGCCA loss (red) and CCGCCA loss (blue). b, Illustration of atypical allele differences for key biomarker measures. The ANOCOVA models controlled for CAG length, sex and age, including age interactions with CAG and sex. Participant-specific random effects were included except for caudate change based on one boundary-shift integral per participant. (i) The effect on caudate volume change, with significant differences between typical alleles and CAACAG CCGCCA loss (P < 0.0001) and a trend with CCGCCA loss (P = 0.050). (ii) The effect on putamen volume change, with significant differences between typical alleles and CAACAG CCGCCA loss (P = 0.007). (iii and iv) Cross-sectional effects on CSF NfL (iii) and CSF PENK (iv) levels, respectively, with significant differences noted for CAACAG CCGCCA loss. Statistically significant comparisons (P < 0.05) are indicated by asterisks. Please note no longitudinal imaging for CAACAG duplication, hence no plot in (i) or (ii).
Fig. 6
Fig. 6. Graphical abstract.
This graphical abstract illustrates the proposed pathways linking somatic expansion and its effects on biomarkers in HD-YAS. Inherited CAG repeat length is identified as the primary driver of disease progression in HD. Red arrows represent observed data associations in HD-YAS and blue arrows reflect assumed causal relationships. The black bidirectional arrow under mechanisms indicates somatic expansion in WBCs as a proxy for CNS expansion, based on shared inherited genetic modifiers,. The black bidirectional arrow under biomarkers shows associations between elevated CSF NfL (marker of neuroaxonal damage) and reduced CSF PENK (surrogate of striatal MSN state) with the earliest caudate and putamen volume changes. Somatic expansion is influenced by inherited CAG repeat length, age and DNA mismatch repair gene variants,. DNA mismatch repair, highlighted in the schematic and shown as a repeat loop-out mismatch icon, is a key mechanism linking inherited CAG repeat length to somatic expansion with repair activity increasing with longer CAG repeat lengths. Within the CNS, somatic expansions substantially contribute to disease progression, as supported by recent postmortem research. While brain biopsy would be the gold standard for direct assessment of CNS somatic expansion in vivo, WBC-derived somatic expansion is detectable peripherally, showing early and longitudinal changes by HD-ISS stages 0 and 1. The biomarkers section shows associations of somatic expansion with the earliest caudate and putamen volume changes, and CSF NfL and PENK levels. The age continuum from HD-ISS stage 0 to stage 1 illustrates early detection of somatic expansion and biomarker changes, influencing pathology from stage 0 onward. HD-YAS provides in vivo evidence that somatic expansion drives early pathology during these early stages, highlighting its potential as a promising therapeutic target in proof-of-concept clinical trials at HD-ISS stages 0 and 1 to slow or prevent further neurodegeneration before clinical motor diagnosis. WBC, white blood cell. The figure is created with BioRender.com.
Extended Data Fig. 1
Extended Data Fig. 1. Flowchart of recruitment, follow-up and total cumulative assessments.
Flowchart detailing participant enrollment at baseline (2017–2019) and the retention and recruitment of new participants at follow-up (2022–2024) in the Huntington’s Disease Young Adult Study (HD-YAS). CSF, cerebrospinal fluid; DBS, disease burden score; FHx, family history; HDGE, HD gene expanded; IVF, in vitro fertilization; LP, lumbar puncture; TMS, Total Motor Score; UHDRS, Unified Huntington’s Disease Rating Scale.
Extended Data Fig. 2
Extended Data Fig. 2. Annualized rate of change in non-significant biofluid markers.
Panel shows comparison of standardized residuals for annualized rate of change in the HDGE vs. control groups for: (a) CSF Tau, (b) CSF GFAP, (c) CSF UCH-L1, (d) plasma Tau, (e) plasma GFAP, (f) plasma UCH-L1, (g) CSF IL-6, (h) CSF IL-8 and (i) plasma NfL. Negative standardized residuals indicate that the rate of change was less than the adjusted mean rate of change across both groups. The horizontal lines represent medians, boxes indicate the upper and lower quartiles, and whiskers are 1.5× IQR. All statistical analyses were conducted using mixed-effect linear models with a participant-specific random effect, controlling for age, sex and their interaction. Natural log-transformed concentrations served as the outcomes in these models. Statistical two-sided group comparisons and correlations controlled for the effects of age and sex and were corrected for multiple comparisons using the FDR. CSF, cerebrospinal fluid; FDR, false discovery rate; GFAP, glial fibrillary acidic protein; HDGE, HD gene expanded; IL, interleukin; IQR, interquartile range; NfL, neurofilament light; UCH-L1, ubiquitin carboxyl-terminal hydrolase L1; YKL-40, also known as chitinase-3 like-protein-1 (CHI3L1).
Extended Data Fig. 3
Extended Data Fig. 3. The effect of atypical HTT allele structure on blood somatic expansions does not explain their effect on HD phenotypes and biomarkers.
(a) Schematic representation of the absence of effect of the atypical HTT allele structure on blood somatic expansion in the HD-YAS cohort and of their relative effect on caudate and putamen volumes and on CSF NfL levels after age-by-CAG correction. (b) Graphical representation of the HTT allele structures observed in the HD-YAS cohort. On the left-hand side is the pure CAG tract, which is likely the primary substrate of the somatic HTT repeat instability machinery and is the primary determinant of the rate of somatic HTT repeat expansion and HD pathology. Center, the sequence variants intervening between the CAG and CCG tracts, which define the atypical HTT allele structures observed (that is, CAACAG duplication, CCGCCA loss and CAACAG CCGCCA loss).
Extended Data Fig. 4
Extended Data Fig. 4. Conceptual causal model.
Conceptual model illustrating the causal relationships among age-related CAG repeat length (age, CAG), CNS somatic expansion, WBC somatic expansion and biomarkers. The squares in gray depict measured data, while the circles in purple represent unobservable quantities. The black, bidirectional arrow signifies the assumption that somatic expansion in WBCs serves as a proxy for somatic expansion in the CNS. Red arrows indicate correlations between observable data and the underlying biological processes of interest. Blue arrows are presumed to reflect true causal pathways indirectly. We note that DNA mismatch repair is a key mechanism linking inherited CAG repeat length to somatic expansion, with mismatch repair activity increasing with longer CAG repeat lengths. *Note additional pathways could be involved due to the imprecise and indirect measurement of actual CNS expansion. Abbreviations: CNS=Central Nervous System. WBC=White Blood Cell.

Comment in

References

    1. Vonsattel, J. P. et al. Neuropathological classification of Huntington’s disease. J. Neuropathol. Exp. Neurol.44, 559–577 (1985). - PubMed
    1. Tabrizi, S. J. et al. Potential disease-modifying therapies for Huntington’s disease: lessons learned and future opportunities. Lancet Neurol.21, 645–658 (2022). - PMC - PubMed
    1. Lee, J.-M. et al. CAG repeat expansion in Huntington disease determines age at onset in a fully dominant fashion. Neurology78, 690–695 (2012). - PMC - PubMed
    1. Monckton, D. G. The contribution of somatic expansion of the CAG repeat to symptomatic development in Huntington’s disease: a historical perspective. J. Huntingtons Dis.10, 7–33 (2021). - PMC - PubMed
    1. Kennedy, L. et al. Dramatic tissue-specific mutation length increases are an early molecular event in Huntington disease pathogenesis. Hum. Mol. Genet.12, 3359–3367 (2003). - PubMed

Publication types

MeSH terms

Associated data