

Integrating univariate and multivariate stability indices for breeding clime-resilient barley cultivars
- PMID: 39825255
- PMCID: PMC11748582
- DOI: 10.1186/s12870-024-05530-6
Integrating univariate and multivariate stability indices for breeding clime-resilient barley cultivars
Abstract
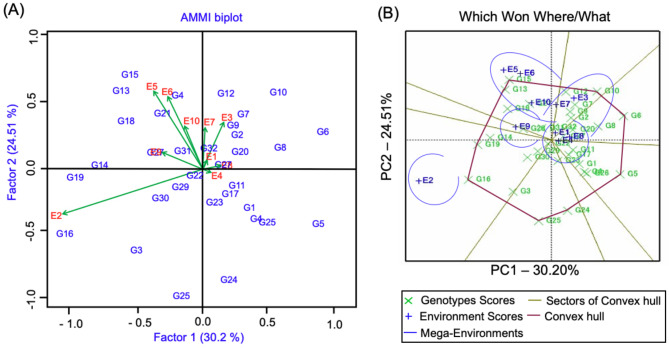
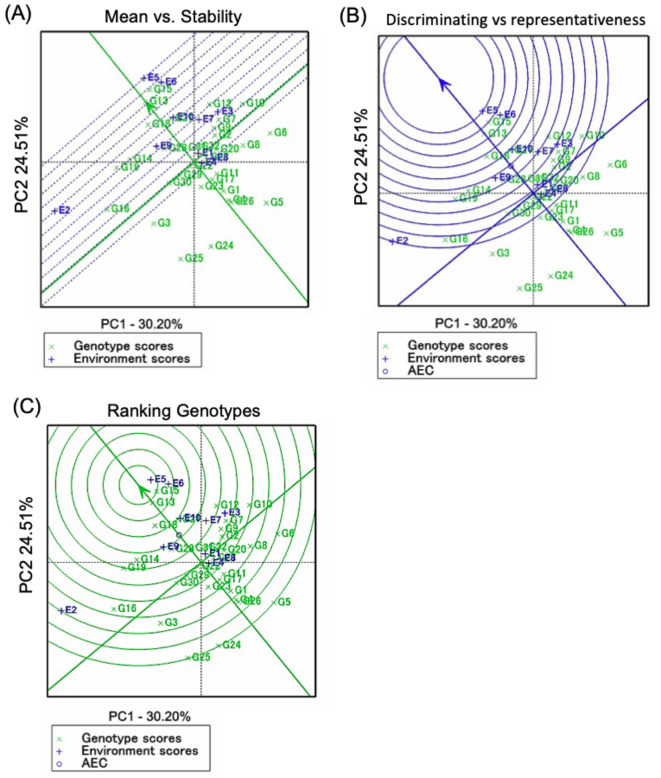
Studying genetic variability through the phenotypic performance of genotypes is crucial in the breeding program. Therefore, evaluating both yield performance and stability across diverse environments is essential in yield trials to identify high-yield potential and stable cultivars. In this study, we employed 12 univariate and 10 multivariate stability models to analyze how genotype (G), environment (E), and their interaction (G × E) affect the yield performance of 32 barley genotypes across 10 environments. The environmental main effect explained 81.3% of the total variation, compared to 18.6% for genotypes and G × E interaction effects. Using the GGE biplot 'which-won-where' polygon, we categorized environments into five groups and genotypes into six groups, identifying eight genotypes with mean grain yield (GY) superior to the overall mean (4.43 tons ha- 1). Spearman's correlation analysis indicated significant positive correlations (P < 0.01) between GY and various stability parameters such as linear regression coefficients (bi), Perkins and Jinks's stability parameters (Bi), environmental variance (Sxi2) and Tai's environmental effects (αi), among others, as univariate stability measures. Additionally, nonparametric measures such as Nassar and Huhn's (SI 6 and SI 3) and Thennarasu's (NP I (3) and NP I (4)), TOP-rank stability and the yield stability index (YSI), showed significant correlations with GY. Both univariate and multivariate stability models highlighted genotypes G32, G1, and G27 as the most stable, exhibiting minimal yield variation across environments. Furthermore, G15, followed by G13, G7, and G9, demonstrated high stability based on multivariate measures. Accordingly, it might be safe to utilize the stability parameters of different groups concerning static and dynamic concepts of stability to avoid the possibility of estimating the same concept of stability. This study emphasizes the importance of utilizing a combination of univariate and multivariate stability models to assess genotype stability comprehensively and select "ideal genotypes" that offer both high yield potential and stability.
Keywords: AMMI; Barley; Environmental variance; GGE biplot; Multi-environment trials.
© 2024. The Author(s).
Conflict of interest statement
Declarations. Ethics approval and consent to participate: Not applicable. Consent for publication: Not applicable. Competing interests: The authors declare no competing interests.
Figures


References
-
- FAOSTAT. Database on Agriculture. In.; 2022.
-
- Elakhdar A, Solanki S, Kubo T, Abed A, Elakhdar I, Khedr R, Hamwieh A, Capo-chichi LJA, Abdelsattar M, Franckowiak JD et al. Barley with improved drought tolerance: challenges and perspectives. Environ Exp Bot 2022, 201.
-
- Lobell DB, Schlenker W, Costa-Roberts J. Climate trends and global crop production since 1980. Science. 2011;333(6042):616–20. - PubMed
-
- Blake T, Blake V, Bowman J, Abdel-Haleem H. Barley: Production, Improvement, and Uses. In. Edited by Ullrich SE: Wiley-Blackwell; 2011.
MeSH terms
LinkOut - more resources
Full Text Sources
Research Materials
Miscellaneous
