. 2025 Jan 18;24(1):25.
doi: 10.1186/s12943-024-02207-4.

Intercellular TIMP-1-CD63 signaling directs the evolution of immune escape and metastasis in KRAS-mutated pancreatic cancer cells

Affiliations

Intercellular TIMP-1-CD63 signaling directs the evolution of immune escape and metastasis in KRAS-mutated pancreatic cancer cells

Chu-An Wang et al. Mol Cancer. .

Abstract

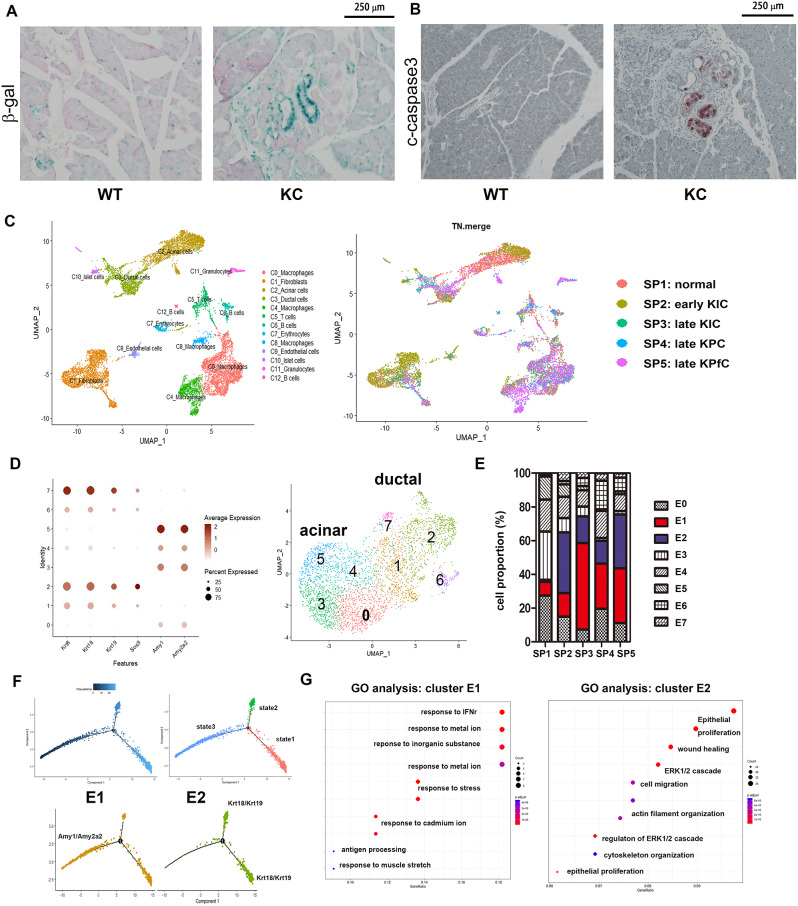
Background and aims: Oncogenic KRAS mutations are present in approximately 90% of pancreatic ductal adenocarcinoma (PDAC). However, Kras mutation alone is insufficient to transform precancerous cells into metastatic PDAC. This study investigates how KRAS-mutated epithelial cells acquire the capacity to escape senescence or even immune clearance, thereby progressing to advanced PDAC.

Methods: Single-cell RNA sequencing and analysis of primary PDAC tumors were conducted. Genetically engineered pancreas-specific Kras-mutated, dual specificity phosphatase-2 (Dusp2) knockout mouse models were established. Human and mouse primary pancreatic cancer cell lines were used for in vitro assessment of cancer characteristics. Tumor progression was studied via pancreas orthotopic and portal vein injection in the immune-competent mice. Clinical relevance was validated by digital spatial transcriptomic analysis of PDAC tumors.

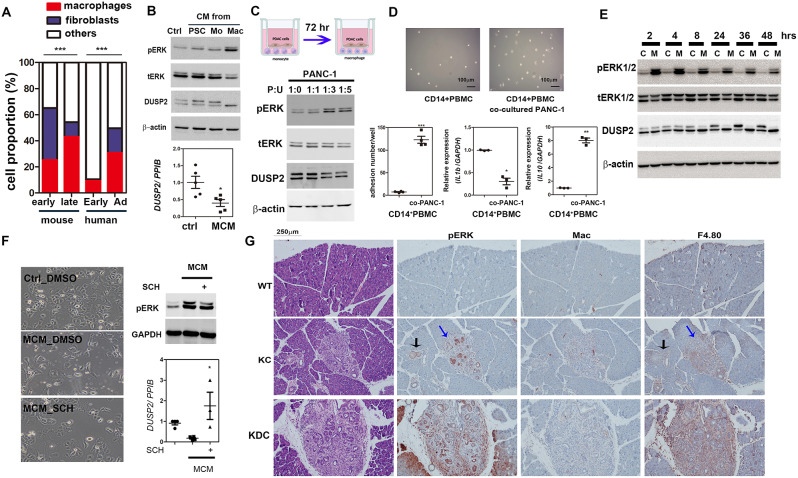
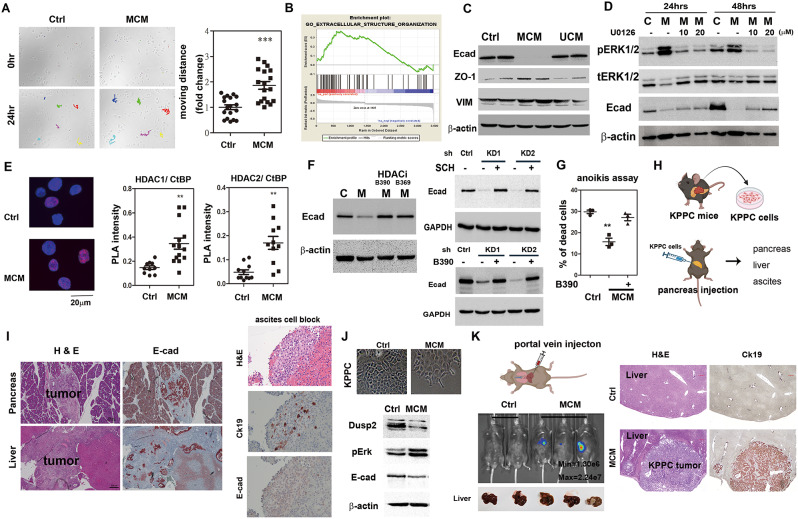
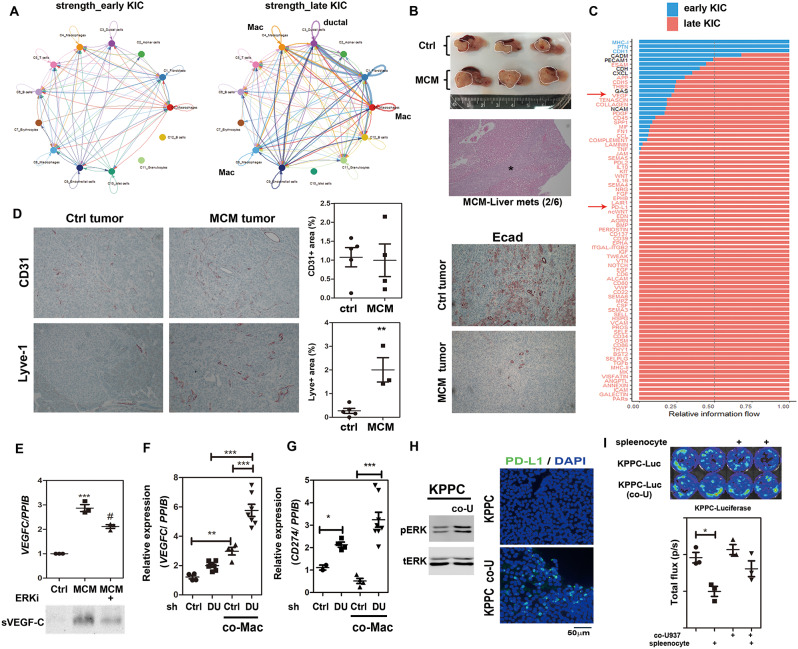
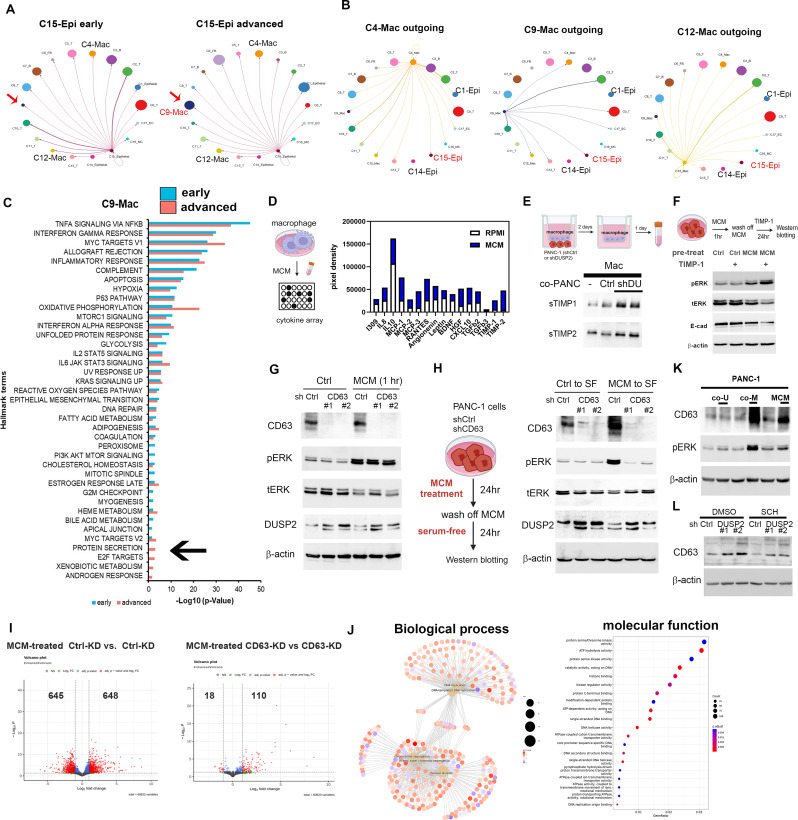
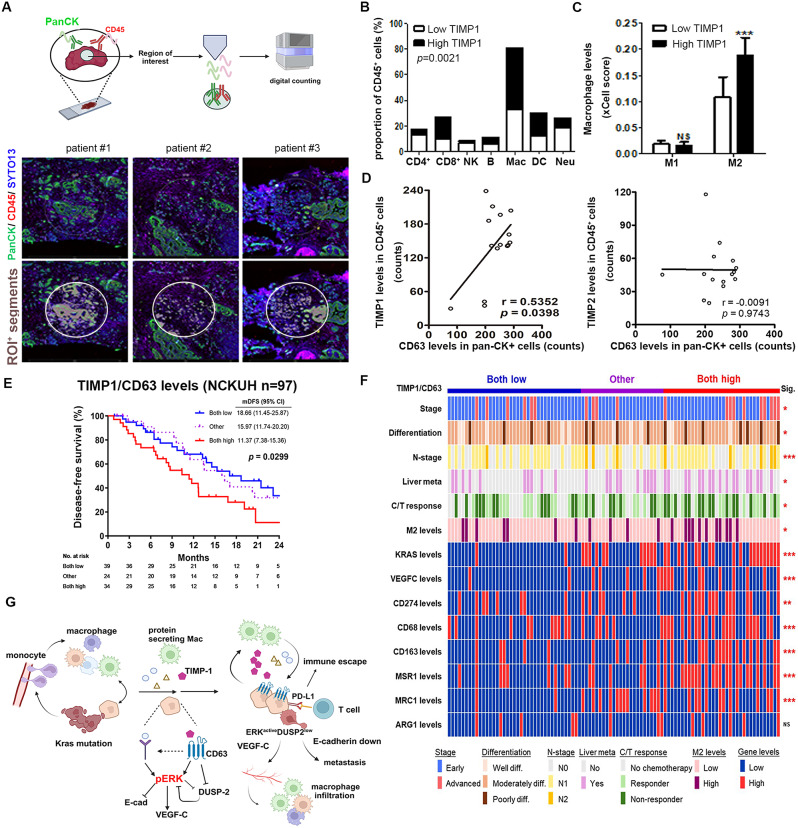
Results: Kras mutation induces the formation of pancreatic intraepithelial neoplasia (PanIN), these lesions also exhibit significant apoptotic signals. Single-cell RNA sequencing identified a subset of ERKactiveDUSP2low cells continuing to expand from early to advanced stage PDAC. In vitro and in vivo studies reveal that early infiltrating macrophage-derived tissue inhibitor of metallopeptidase 1 (TIMP-1) is the key factor in maintaining the ERKactiveDUSP2low cell population in a CD63-dependent manner. The ERKactiveDUSP2low cancer cells further exacerbate macrophage-mediated cancer malignancy, including loss of epithelial trait, increased lymphangiogenesis, and immune escape. Digital spatial profiling analysis of PDAC samples demonstrates the colocalization of TIMP-1high macrophages and CD63high cancer cells. The presence of TIMP-1high macrophages and CD63high epithelial cells correlates with poor prognosis in PDAC.

Conclusions: Our study reveals the vicious cycle between early infiltrating macrophages and pancreatic cancer cells, providing a mechanistic insight into the dynamic regulation directing pancreatic cancer progression.


Conflict of interest statement

Declarations. Ethical approval: Experimental procedures of animal studies were approved by the Institutional Animal Care and Use committee at the National Chung Kung University. Tumor specimens were obtained from PDAC patients undergoing surgical resection at the National Cheng Kung University Hospital (NCKUH) under Institutional Review Board (IRB)-approved protocol (IRB number: NCKUH B-ER-110-420). Competing interests: The authors declare no competing interests.

Figures

Fig. 1
Fig. 1
A subset of Kras mutant epithelial cells expands as tumor progresses. (A) The expression of SA-β-Gal, which is present only in senescent cells, was detected in control and KC pancreas (abcam 65351). (B) Apoptosis in control and KC pancreas was detected by immunohistochemical staining for cleaved caspase-3. (C) Uniform Manifold Approximation and Projection (UMAP) plot of the normal, early/late lesion pancreas (KrasLSL−G12D/+, Ink4afl/fl, Ptf1aCre/+, KIC), and PDAC (KrasLSL−G12D/+, Trp53LSL − R172H/+, Ptf1aCre/+, KPC; KrasLSL−G12D/+, Trp53 fl/fl, Pdx1Cre/+, KPfC) composing 13 distinct cell populations. (D) A dot plot shows the relative expression of selected genes in the epithelial cells (E0-E7) in mouse pancreatic tissue (left). UMAP plot of epithelial sub-clustering (right). (E) The proportion of each epithelial subsets in different stages of the pancreas. (F) Pseudotemporal ordering of epithelial cells (E0-E7) reveals a branched trajectory. The distribution of the 3 subpopulations is plotted on each of the branches (upper). The distribution of E1 and E2 subgroups on the pseudotime trajectory is shown (lower). (G) Gene ontology (GO) analysis of differentially expressed genes (DEGs) in E1 and E2
Fig. 2
Fig. 2
Identify DUSPs expressing epithelial subsets and gene expression pathways. Schematic showing early and advanced PDAC were collected after surgery and processed for 10x scRNA-seq (left). UMAP plots of distinct populations are clustered by the average gene expression in early and advanced PDAC tumors. Each dot represents the transcriptome of a single cell, with color coding defining clusters of cells having similar transcriptional identities (right). (B) UMAP plots of distinct populations from early and advanced PDAC (left). Percentage frequency of cell populations in the scRNA-seq data between early and advanced PDAC are shown (right). (C) A dot-plot showing the relative expression of a subset of epithelial/ ductal marker genes (left). The color of each dot represents the average expression across the cluster, the size of each dot represents the percentage of cells in the cluster expressing the gene. (D) Hallmark pathway enrichment analysis of DEGs in three epithelial subsets (C1-Epi, C14-Epi, and C15-Epi) detected in a Stage II PDAC tumor. (E) A dot-plot showing the relative expression of KRAS, DUSP1, DUSP2, DUSP4, DUSP5, and DUSP6 in clusters of different cell type. (F) Violin plots showing the distribution of expression levels DUSP1, DUSP2, DUSP4, and DUSP6 in three subsets of epithelial populations in early and advanced tumors. (G) DUSP2 regulates ERK1/2 activity in PANC-1 cells. PANC-1 cells were transfected with GFP, DUSP2-GFP, and phosphatase dead DUSP2-GFP (PD) for 24 h. Western blotting was performed to determine pERK1/2. β-actin is the loading control. GFP was used for the detection of exogenous DUSP2 expression (left). Western blotting was performed to determine pERK1/2 and total EKR1/2 (tERK1/2) in control and DUSP2-KD PANC-1 cells (right). (H) Representative (left) and quantification (right) of immunohistochemical staining images show expression of cleaved caspase-3 in the lesion of KC (KrasLSL−G12D/+, Pdx1Cre/+) and KDC (KrasLSL−G12D/+, Dusp2fl/fl, Pdx1Cre/+) transgenic mouse
Fig. 3
Fig. 3
Macrophage induces ERK phosphorylation in pancreatic cancer cells. (A) The proportion of macrophages, fibroblasts, and other types of cells in scRNA sequencing performed in mouse and human pancreatic tissue. Chi-square analysis was performed to compare the number of macrophages in mouse and human scRNA-seq data in their distribution between early and advanced disease statuses. (B) Western blot (upper) result shows the expression of ERK1/2 phosphorylation (pERK), total ERK1/2 (tERK), DUSP2, and β-actin in PANC-1 cells treated with control medium (Ctrl) or conditioned medium (CM) from human pancreatic stellate cells (PSC), U937 (undifferentiated naïve monocyte Mo), and macrophages (Mac) for 48 h. RT-qPCR (lower) for the expression of DUSP2 in control and macrophage-CM (MCM) treated PANC-1 cells. (C) Illustration of the co-culture system of PANC1 cells with monocytes (U937) by Transwell for 72 h (upper). The expression of DUSP2, pERK, tERK, and β-actin was detected in PANC-1 co-cultured with different ratio of U937. (D) Attachment of CD14 + PBMCs to tissue culture plate after co-culture with PANC-1 cells. Quantification of number of attached CD14 + PBMCs cells after co-culture with PANC-1 cells for 3 days (left). qRT-PCR for gene expression of IL1B and IL10 in CD14 + PBMCs cells and CD14 + PBMCs co-cultured with PANC-1 cells for 3 days (right). (E) Western blot result shows the expression levels of pERK1/2, tERK1/2, and DUSP2 in control and MCM treated PANC-1 cells in different time points. (F) PANC-1 cell morphology of control, MCM treated, and MCM plus ERK inhibitor (SCH772984) treatment (left). Western blot (right, upper) and RT-qPCR (right, lower) showed the expression of DUSP2 is reversed if treated with ERK inhibitor (SCH772984). (G) Representative histology and immunohistochemical staining images (serial section) show expression of phosphorylated ERK1/2 (pERK), monocyte/macrophage (Mac) and macrophage (F4/80) in the lesion of KC (KrasLSL−G12D/+, Pdx1Cre/+), and KDC (KrasLSL−G12D/+, Dusp2fl/fl, Pdx1Cre/+) transgenic mouse compared to pancreata in control mice
Fig. 4
Fig. 4
MCM epigenetically suppresses E-cadherin expression and promotes metastasis. (A) Control and MCM treated PANC-1 cells were plated in petri dish and recorded by live cell imaging (JuLiBr, supplementary movie 1). The images were taken every 10 min in a total of 24 h. The track of sequence image was measured and quantified by ImageJ (right panel). Analysis was derived from results of three independent experiments with six cells of each time. (B) Analysis of gene sets (GSE109110) comparing PANC-1-co-cultured TAMs vs. PANC-1-alone control indicates the enrichment of extracellular/structure signature. (C) Representative Western blot results show the expression of E-cadherin, ZO-1, Vimentin and β-actin in control, MCM or UCM treated PANC-1 cells. (D) PANC-1 cells were pre-treated with MEK inhibitor (U0126) for 15 min and then treated with MCM for 24 and 48 h. Representative western blot results show the expression of pERK, E-cadherin, ERK and β-actin. (E) Proximity ligation assays (PLA) was performed to detect the HDAC1-CtBP and HDAC2-CtBP interaction Representative image (left) and quantification (right) was shown. (F) Suppressed E-cadherin is restored if HDAC inhibitor (B369 and B390) was employed (left). DUSP2-KD PANC-1 cells were treated with HDAC or ERK inhibitor and MCM for 24 h. Whole cell lysate was collected for the detection of E-cadherin and GAPDH. (G) Control, MCM, and MCM plus HDAC inhibitor treated PANC-1 cells were plated in low-attachment plate for 24 h. Annexin V positive cells were measured by flow cytometry. (H) Illustration of the isolation of KPPC cells and experimental design. KPPC cells were injected into the pancreas of immunocompetent mice. After one month of injection, pancreas, liver, and ascites were collected for further analysis. (I) H&E stain and immunohistochemistry staining for E-cadherin in pancreas, liver, and ascites blocks of mice injected with KPPC cells. Mice harbor KPPC tumors develop ascites which were pelleted and processed for cell block. H&E stain and immunohistochemistry staining for E-cadherin and Ck19 in the ascites cell block. (J) KPPC cells treated with MCM showed morphology change (upper), and decreased Dup2 and E-cadherin, and increased pERK measured by Western blotting (lower). (K) KPPC cells labeled with luciferase were injected into mice via portal vein. IVIS imaging was used to track the development of liver metastases in mice. After one month, mice were sacrificed and livers were taken (left). H&E stain and immunohistochemistry staining for Ck19 expression in the liver of mice injected with control or MCM-treated KPPC cells (right)
Fig. 5
Fig. 5
Macrophage exacerbates ERKactiveDUSP2low mediated lymphangiogenesis and immune escape. (A) Cellchat analysis for cellular communication among distinct cell populations in early and late KIC pancreas. Circle plot was served as visualization outputs and different colors represent different cell groups. (B) Picture of pancreatic tumors developed from SCID mice orthotopically injected with control or MCM-selected PANC1. The dotted lines show tumor mass. H&E stain of mouse liver from MCM-selected PANC-1 group. The asterisk indicates tumor mass. Numbers of mice with metastatic lesions and total numbers of mice in MCM-selected PANC-1 group is indicated at the bottom of micrographs (upper). IHC staining showed the expression of E-cadherin in control or MCM-selected pancreatic tumors (lower). (C) All the significant signaling pathways in early and late KIC were ranked based on their differences of overall information flow. The overall information flow of a signaling network is calculated by summarizing all the communication probabilities in that network. The top signaling pathways colored by red are more enriched in late KIC, and the pathways colored by blue were more enriched in the early KIC pancreas. (D) IHC staining for LYVE-1 and CD31 in control or MCM-selected pancreatic tumors (left). Quantification of LYVE-1 and CD31 in control and MCM-selected pancreatic tumors (right). (E) The expression of VEGF-C in control, MCM, MCM plus ERK inhibitor treated PANC-1 cells measured by RT-qPCR (upper) and Western blotting (lower). (F) RT-qPCR for VEGF-C expression in control and DUSP2-KD PANC-1 cells co-cultured with macrophages for 2 days. (G) RT-qPCR for the expression of PD-L1 (CD274) in pancreatic cancer cells. U937 cells were first differentiated into macrophages and co-cultured with control or DUSP2-KD PANC-1 cells for 2 days. (H) KPPC cells co-cultured with U937 for 5 days showed increased ERK phosphorylation (left). Immunocytochemistry for PD-L1 expression in KPPC and KPPC which has been co-cultured with U937 (right). (I) Total flux was determined to represent cell numbers of KPPC cells which are luciferase labeled. KPPC cells were first co-cultured with U937 for 5 days and then incubated with freshly isolated mouse splenocytes for 2 days
Fig. 6
Fig. 6
Decipher the signaling interaction between macrophage and ERKactiveDUSP2low epithelial cells. (A) Circle plot showing the inferred signaling networks from C15-Epi subset toward subsets of other epithelial, macrophage and T cells in early and advanced stages. The round loops along with cell type represent the interactions within the same cell type. (B) Circle plots showing the outgoing signals from each macrophage subset (C4, C9, and C12) in the early PDAC. (C) Hallmark pathway enrichment analysis of DEGs in C9-Mac in early and advanced PDAC tumor. (D) Cytokine array (RayBiotech) was used to identify potential factors secreted from macrophage (MCM) compared to RPMI which contains 10% FBS. (E) The expression of TIMPs in macrophages. Macrophages were first co-cultured with PANC-1 for 2 days and then cultured alone by serum-free RPMI medium for an additional day. Conditioned medium was collected and concentrated to measure the expression of TIMP-1 and TIMP-2 by Western blotting. (F) PANC-1 cells were initially treated with MCM for 1 h, after which they were cultured in serum-free medium with or without recombinant TIMP-1 (Peprotech) for 24 h. Western blotting was then performed to assess the expression of DUSP2, pERK, E-cadherin, and β-actin. (G) The expression of CD63, pERK, tERK, DUSP2, and internal control β-actin in control and CD63 knockdown (KD) PANC-1 cells after being treated with MCM for 1 h. (H) Control and CD63-KD PANC-1 cells were first treated with or without MCM for 24 h and the medium was replaced by serum-free RPMI for an additional 24 h. The expression of CD63, pERK, tERK, DUSP2, and internal control β-actin was determined by Western blotting. (I) The volcano plot illustrates the number of genes that are significantly upregulated or downregulated in MCM-treated cells compared to untreated cells under both Ctrl-KD and CD63-KD conditions, with a fold change greater than 2. (J) GO analysis was conducted on differentially expressed genes comparing MCM-treated Ctrl-KD and MCM-treated CD63-KD cells, focusing on their involvement in biological processes and molecular functions, as illustrated in cnetplots and dotplots. (K) The expression of CD63, pERK, and internal control β-actin in PANC-1 cells that have been co-cultured with monocyte (co-U) for 3 days, with macrophage (co-M) for 2 days, or treated with MCM for 2 days. (L) The expression of CD63 and β-actin in control and DUSP2-KD PANC-1 cells treated with DMSO or ERK inhibitor (SCH772984)
Fig. 7
Fig. 7
The expression of Mac-TIMP-1 and Epi-CD63 predicts poor prognosis in PDAC. (A) The simple workflow of DSP. Antibodies covalently linked to DNA indexing oligonucleotide are used to stain tissue section. Several repeats of UV light liberates indexing oligonucleotide from the region of interest (ROI), and oligonucleotides are hybridized to NanoString fluorescent barcodes and quantified by NGS (NovaSeq 10B 150PE) (upper). Fluorescent imaging establishes the overall architecture of the tissue. Tissue-specific morphological features were highlighted by PanCK (green), CD45 (red) and SYTO13 (blue). PanCK, CD45, and SYTP13 identify epithelium, immune cells, and nucleic acid respectively. Representative ROI for PanCK and CD45 are shown (lower). (B) Cell-type enrichment analysis (xCell) was performed for the prediction of cell types within the CD45+ population. (C) TIMP1 expression in M1 and M2 macrophage. M1 and M2 macrophages was predicted by webtool xCell. (D) Expression correlation between TIMP1 or TIMP2 in CD45+ immune population and CD63 in PanCK+ epithelial population. (E) Kaplan-Meier analysis of overall survival based on the expression of TIMP1 and CD63 levels in NCKUH cohort. (F) Waterfall plot (oncoplot) for the proportion of patient cases with disease status (stage, differentiation, lymph node, liver metastasis, chemotherapy response) in different levels of TIMP1/CD63. Others: TIMP1highCD63low or TIMP1lowCD63high. The mean value was used as the optimal cut-off values of TIMP1 and CD63. chi-square test was used for the correlation analysis. (G) A schematic illustration showing the interaction between macrophage and pancreatic cancer cells by the TIMP-1/CD63/ERKactive axis, and the leading consequence of the interaction. The working model was created in https://BioRender.com

References

    1. Cerami E, et al. The cBio cancer genomics portal: an open platform for exploring multidimensional cancer genomics data. Cancer Discov. 2012;2(5):401–4. - PMC - PubMed
    1. Lohr M, et al. Frequency of K-ras mutations in pancreatic intraductal neoplasias associated with pancreatic ductal adenocarcinoma and chronic pancreatitis: a meta-analysis. Neoplasia. 2005;7(1):17–23. - PMC - PubMed
    1. Eser S, et al. Oncogenic KRAS signalling in pancreatic cancer. Br J Cancer. 2014;111(5):817–22. - PMC - PubMed
    1. Aguirre AJ, et al. Activated Kras and Ink4a/Arf deficiency cooperate to produce metastatic pancreatic ductal adenocarcinoma. Genes Dev. 2003;17(24):3112–26. - PMC - PubMed
    1. Hingorani SR, et al. Trp53R172H and KrasG12D cooperate to promote chromosomal instability and widely metastatic pancreatic ductal adenocarcinoma in mice. Cancer Cell. 2005;7(5):469–83. - PubMed

MeSH terms

Substances