Muscle Loss During First-Line Chemotherapy Impairs Survival in Advanced Pancreatic Cancer Despite Adapted Physical Activity
- PMID: 39825571
- PMCID: PMC11788588
- DOI: 10.1002/jcsm.13595
Muscle Loss During First-Line Chemotherapy Impairs Survival in Advanced Pancreatic Cancer Despite Adapted Physical Activity
Abstract
Background: Advanced pancreatic ductal adenocarcinoma (aPDAC) is often accompanied by significant muscle mass loss, contributing to poor prognosis. SarcAPACaP, an ancillary study of the GERCOR-APACaP phase III trial, evaluated the role of adapted physical activity (APA) in aPDAC Western patients receiving first-line chemotherapy. The study aimed to assess (1) the potential impact of computed tomography (CT)-quantified muscle mass before and during treatments on health-related quality of life (HRQoL) and overall survival (OS) and (2) the role of APA in mitigating muscle mass loss.
Methods: In the APACaP trial, aPDAC patients with ECOG performance status (PS) 0-2 were randomized 1:1 to usual care including first-line chemotherapy or usual care plus a 16-week home-based APA program. In the SarcAPACaP study, the surface muscular index (SMI) was determined from L3 CT scan slices. Two patient populations were analysed: those with CT scan available at baseline (modified[m] intent-to-treat [ITT]1-W0) and those with CT scans available at both W0 and W16 (mITT2 W0-W16). Low muscle mass was defined by low SMI with SMI < 41 cm2/m2 for women and < 43 and < 53 cm2/m2 for men with body max index < 25.0 and ≥ 25.0 kg/m2, respectively. Muscle loss was defined by the relative difference of SMI between W0 and W16 (100*[SMI W16-SMI W0]/SMI W0). In mITT2 W0-W16, patients were stratified into three groups based on the severity of muscle loss: none, moderate (0%-10%) and high (≥ 10%). Associations between muscle mass loss and OS, time until definitive deterioration (TUDD) of HRQoL and the effect of APA on loss of muscle mass were assessed.
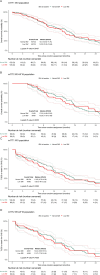
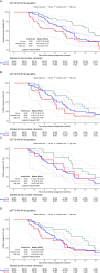
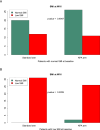
Results: Between October 2014 and May 2020, 313 patients were prospectively enrolled, with 225 in mITT1 W0 and 128 in mITT2 W0-W16, with 65 assigned to the APA arm. Both groups had similar baseline characteristics with comparable OS and TUDD. A low SMI at W0 was not associated with OS and TUDD of HRQoL in either group. Among mITT2 W0-W16 patients, high muscle mass loss (n = 27) independently predicted OS (p = 0.012) and showed a trend toward negatively affecting TUDD of HRQoL. Notably, APA did not mitigate muscle loss in our study population.
Conclusions: Longitudinal muscle mass loss emerged as a predictive factor for both OS and HRQoL in aPDAC patients undergoing chemotherapy, while a low SMI at diagnosis did not provide prognostic value. APA did not impact muscle mass loss in this population.
Keywords: CT scan; adapted physical activity; muscular mass loss; pancreatic cancer; quality of life; sarcopenia.
© 2025 The Author(s). Journal of Cachexia, Sarcopenia and Muscle published by Wiley Periodicals LLC.
Conflict of interest statement
The authors declare no conflicts of interest.
Figures


References
-
- Siegel R. L., Miller K. D., Wagle N. S., et al., “Cancer Statistics, 2023,” CA: Cancer Journal for Clinicians 73, no. 1 (2023): 17–48. - PubMed
-
- Fearon K., Strasser F., Anker S. D., et al., “Definition and Classification of Cancer Cachexia: An International Consensus,” Lancet Oncology 12, no. 5 (2011): 489–495. - PubMed
Publication types
MeSH terms
Grants and funding
LinkOut - more resources
Full Text Sources
Medical

