

doi: 10.1182/bloodadvances.2024014928.
Primary cutaneous CD8+ aggressive epidermotropic cytotoxic T-cell lymphoma with novel FGFR1 fusion treated with pemigatinib
Affiliations
- PMID: 39825823
- PMCID: PMC12008514
- DOI: 10.1182/bloodadvances.2024014928
Item in Clipboard
Primary cutaneous CD8+ aggressive epidermotropic cytotoxic T-cell lymphoma with novel FGFR1 fusion treated with pemigatinib
Blood Adv.
.
No abstract available
Conflict of interest statement
Figures
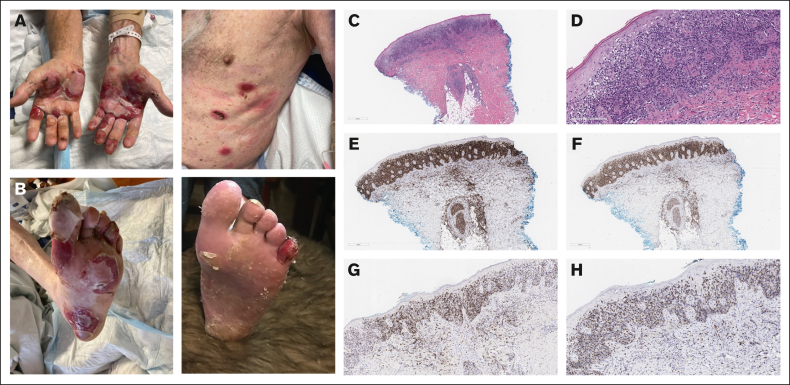
Clinical and histopathological appearance of primary cutaneous aggressive epidermotropic cytotoxic T-cell lymphoma with SATB1::FGFR1 fusion. (A) Clinical presentation of rapidly progressing ulcerated lesions on upper extremities and chest. (B) Ulcerated lesions on the left foot showing clinical remission after 4 weeks of therapy with pemigatinib. (C) Skin biopsy. Histological section shows a markedly epidermotropic and adnexotropic lymphoma (original magnification ×40; hematoxylin and eosin [H&E]). (D) The epidermotropic lymphocytes show cytologic atypia and hyperchromasia (original magnification ×200; H&E). (E) The atypical lymphocytes are positive for CD3 (original magnification ×100; immunohistochemistry). (F) The lymphoma cells express CD8 (original magnification ×100; immunohistochemistry). (G) The lymphoma cells express TCR βF1, indicating that the phenotype of the lymphoma cells is α/β (original magnification ×200; immunohistochemistry). (H) The atypical epidermotropic cells are positive for TIA-1, supporting a cytotoxic phenotype of this lymphoma (original magnification ×400; immunohistochemistry).
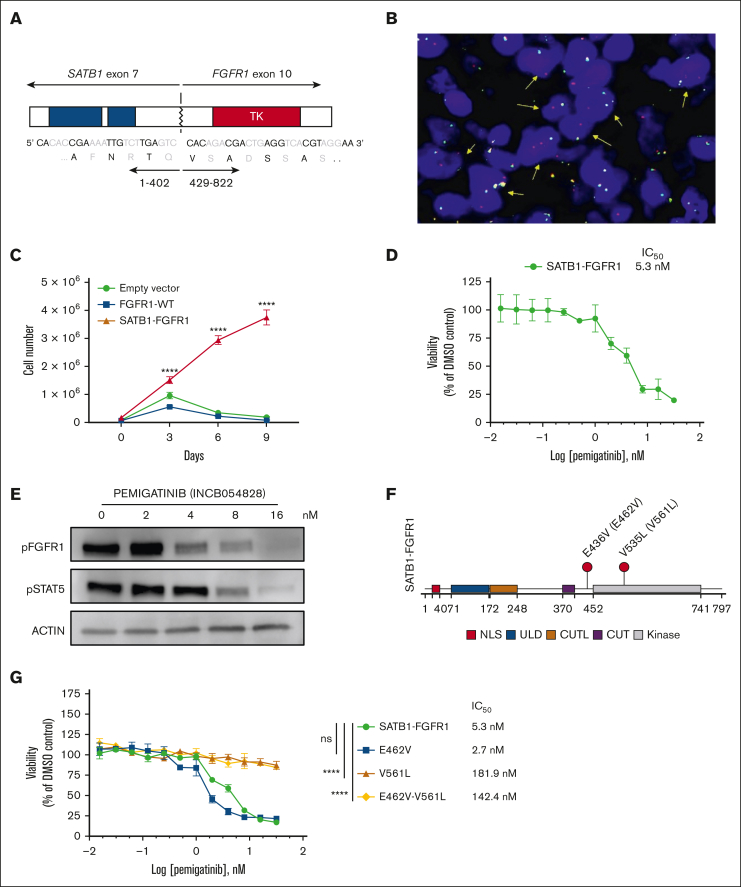
SATB1::FGFR1 rearrangement demonstrated by next-generation sequencing and fluorescence in situ hybridization (FISH).SATB1::FGFR1 can be inhibited by pemigatinib in vitro but FGFR1 V561L mutation drives drug resistance. (A) SATB1::FGFR1 fusion transcript detected by anchored multiplex polymerase chain reaction. An in-frame fusion involving SATB1 (exon 7) and FGFR1 (exon 10) results in juxtaposition of amino acid 402 of SATB1 and amino acid 429 of FGFR1. Of note, the FGFR1 TK domain starts at amino acid 478. (B) FISH analysis using FGFR1 break apart probe, 5′FGFR1 (centromeric [green])/3′FGFR1 (telomeric [red]), showed 1 red 1 fusion signal pattern, indicating 5′FGFR1 deletion and unbalanced FGFR1 rearrangement. (C) Cell viability assays. SATB1:FGFR1 cDNA (Twist Bioscience) was mutagenized by Gibson cloning, subcloned into pCDH-CMV-MCS-EF1-copGFP vector (Systems Biosciences), and chemically transfected by FuGENE (Promega Corp) into 293-LentiX viral packaging cells. Retroviruses encoding empty vector control, wild-type FGFR1, and SATB1-FGFR1 were transduced into Ba/F3 cells. Successfully transduced Ba/F3 cells were seeded at a cell density of 1 × 10⁶/mL in a 96-well plate in the presence or absence of interleukin-3 (IL-3; 10 ng/mL; PepoTech). Transduced Ba/F3 cells were cell sorted based on green fluorescent protein positivity. On day 0, cells were seeded without IL-3 at 106 cells per mL. Results show cell counts and represent the mean ± standard deviation (SD) of triplicates. Statistical differences were tested using multiple comparison 2-way analysis of variance (ANOVA); ∗∗∗P < .0001. (D) Cell viability assay to determine 50% inhibitory concentration (IC50) values of pemigatinib in SATB1-FGFR1–expressing Ba/F3 cells without IL-3. A total of 106 cell per mL were cultured with pemigatinib (INCB054828, Selleckchem) or vehicle control in a 96-well plate. CellTiter-Glo luminescent reagent (Promega) was added after 48 hours (BioTek Cytation 5). IC50 values were determined using a nonlinear regression model in GraphPad Prism version 10 (GraphPad Software). Results show cell counts and represent the means ± SD of triplicates. (E) Western blots of SATB1-FGFR1–expressing Ba/F3 cells. Cells were transduced with SATB1-FGFR1 and treated with pemigatinib for indicated concentrations for 48 hours. Antibodies against pSTAT5 (4322), pFGFR1 (52928), and β-actin (4970) were obtained from Cell Signaling Technology. (F) Fusion protein with domains of SATB1 and FGFR1. The NLS, ULD, the CUTL DNA binding domain, and a truncated CUT domain are preserved in SATB1. The kinase domain of FGFR1 is retained. Point mutations are given in fusion protein coordinates and original FGFR1 coordinates in parentheses. WGS was performed by Admera (South Plainfield, NJ) using the Kapa Hyper Prep (Roche) kit. RNA sequencing was performed by Admera (South Plainfield, NJ) using the KAPA RNA HyperPrep kit with RiboErase (HMR) (Roche) kit. Raw paired-end Fastq reads from whole-exome sequencing were aligned to GRCh38.p13 and standardized using GATK 4.4.0.0 best practices. Additionally, mutations in FGFR1 were manually verified with Integrative Genomics Viewer. Raw paired-end RNA-sequencing Fastq reads were aligned to GRCh38.p13 with GENCODE version 30 transcripts using STAR version 2.7.10. Splice junctions were separated and realigned to the genome using GATK4.4.0.0. HaplotypeCaller was used to identify single-nucleotide changes compared with reference genome. STAR-fusion was performed on raw Fastq reads to identify expressed fusion transcripts. (G) Cell viability assay to determine IC50 values of pemigatinib in Ba/F3 cells expressing SATB1-FGFR1 variants. Cells were cultured as in panel D and harvested after 48 hours. Results show cell counts and represent the means ± SD of triplicates. Statistical differences were tested using multiple comparisons 2-way ANOVA; ∗∗∗∗P < .0001. CUTL, CUT1-like; DMSO, dimethyl sulfoxide; Log, base 10 logarithm; NLS, nuclear localization signal; NR, not reached; ns, not significant; ULD, ubiquitin-like domain.
Similar articles
-
[Facial ulcerated nodules revealing primary cutaneous CD8-positive aggressive epidermotropic cytotoxic T-cell lymphoma].Ann Dermatol Venereol. 2020 Nov;147(11):764-768. doi: 10.1016/j.annder.2020.04.014. Epub 2020 Jun 8. Ann Dermatol Venereol. 2020. PMID: 32527516 French.
-
Vulvar Primary Cutaneous CD8+ Aggressive Epidermotropic Cytotoxic T-Cell Lymphoma.Int J Gynecol Pathol. 2021 May 1;40(3):229-233. doi: 10.1097/PGP.0000000000000648. Int J Gynecol Pathol. 2021. PMID: 33741766
-
Primary cutaneous aggressive epidermotropic CD8(+) cytotoxic T-cell lymphoma with atypical presentation.J Dermatol. 2006 Sep;33(9):632-4. doi: 10.1111/j.1346-8138.2006.00147.x. J Dermatol. 2006. PMID: 16958809
-
Aggressive epidermotropic cutaneous CD8+ lymphoma: a cutaneous lymphoma with distinct clinical and pathological features. Report of an EORTC Cutaneous Lymphoma Task Force Workshop.Histopathology. 2015 Oct;67(4):425-41. doi: 10.1111/his.12371. Epub 2015 Feb 24. Histopathology. 2015. PMID: 24438036
-
Primary cutaneous aggressive epidermotropic CD8+ T-cell lymphoma.J Am Acad Dermatol. 2010 Feb;62(2):300-7. doi: 10.1016/j.jaad.2009.02.035. Epub 2009 Nov 26. J Am Acad Dermatol. 2010. PMID: 19944484 Review.
Cited by
-
TRAF3IP3::FGFR1: a novel FGFR1 fusion identified in an aggressive case of acute myeloid leukemia.Ann Hematol. 2025 Jul 1. doi: 10.1007/s00277-025-06494-9. Online ahead of print. Ann Hematol. 2025. PMID: 40590913 No abstract available.
References
-
- Zheng Z, Liebers M, Zhelyazkova B, et al. Anchored multiplex PCR for targeted next-generation sequencing. Nat Med. 2014;20(12):1479–1484. - PubMed
LinkOut - more resources
Full Text Sources
Research Materials
Miscellaneous
