. 2025 Mar 21;6(1):103574.
doi: 10.1016/j.xpro.2024.103574. Epub 2025 Jan 16.

Protocol for identifying Mycobacterium tuberculosis infection status through airway microbiome profiling

Affiliations

Protocol for identifying Mycobacterium tuberculosis infection status through airway microbiome profiling

Geoffrey Olweny et al. STAR Protoc. .

Abstract

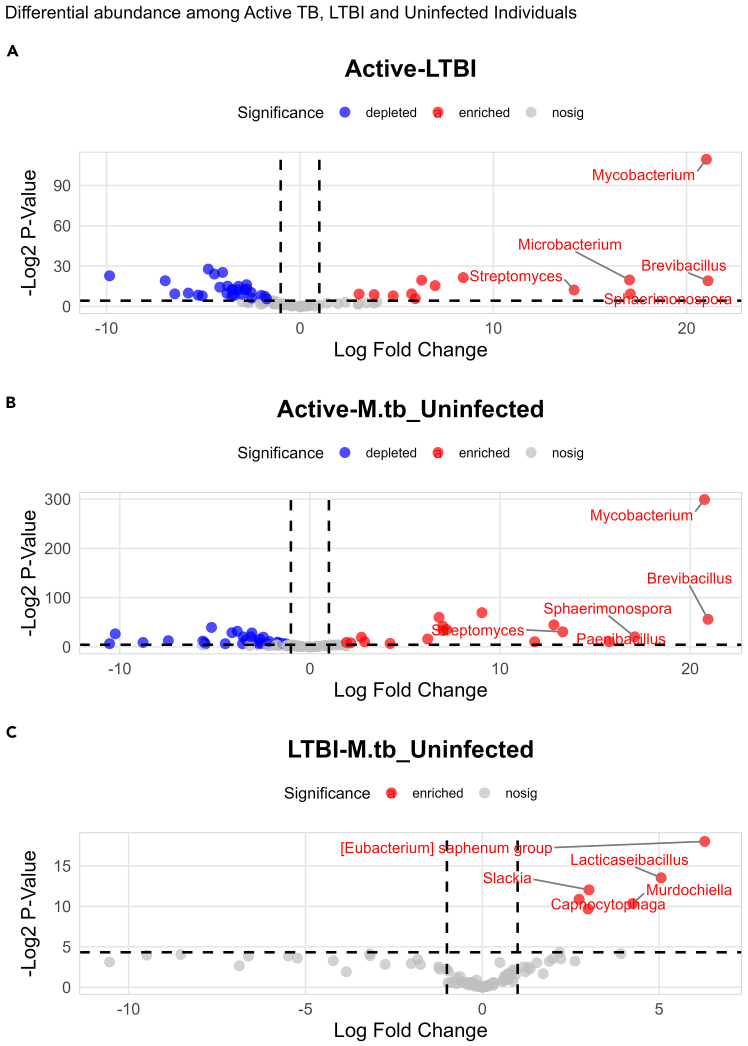
This protocol describes the steps to determine an airway microbiome signature for identifying Mycobacterium tuberculosis infection status. We outline procedures for processing microbiome data, calculating diversity measures, and fitting Dirichlet multinomial mixture models. Additionally, we provide steps for analyzing taxonomic relative and differential abundances, as well as identifying potential biomarkers associated with infection status. For complete details on the use and execution of this protocol, please refer to Kayongo et al.1.

Keywords: bioinformatics; immunology; microbiology.


Conflict of interest statement

Declaration of interests The authors declare no competing interests.

Figures

None
Graphical abstract
Figure 1
Figure 1
A combined plot showing microbiome alpha diversity measures according to Mycobacterium tuberculosis Infection Status
Figure 2
Figure 2
A principal component analysis and density plot showing the microbiome beta diversity according to Mycobacterium tuberculosis Infection Status
Figure 3
Figure 3
Dirichlet Multinomial Mixture (DMM) model clusters the airway microbiome into four pulmotypes Adopted from Kayongo et al. with some modifications.
Figure 4
Figure 4
A heatmap showing associations between DMM community types and alpha indices. MetadeconfoundR was used for analysis Cofounded results are shown with a circle, while deconfounded results are shown with a star. Cliff’s delta and FRD values are shown. ∗∗∗ FDR<0.001, ∗∗FDR<0.01 and ∗FDR<0.1.
Figure 5
Figure 5
A PCoA plot showing the microbiome beta diversity among the DMM microbial pulmotypes Adopted from Kayongo et al. with some modifications.
Figure 6
Figure 6
Phylum relative abundance of taxa according to Mycobacterium tuberculosis Infection Status (A) A stacked bar plot showing the most abundant phyla according to Mycobacterium tuberculosis Infection Status. (B) An alluvial plot showing the most abundant phyla according to Mycobacterium tuberculosis Infection Status.
Figure 7
Figure 7
Genus relative abundance of taxa according to Mycobacterium tuberculosis Infection Status (A) A stacked bar plot showing the most abundant genus according to Mycobacterium tuberculosis Infection Status. (B) An alluvial plot showing the most abundant genus according to Mycobacterium tuberculosis Infection Status.
Figure 8
Figure 8
Volcano plots showing enriched and depleted genera according to Mycobacterium tuberculosis Infection Status (A) Shows the enriched and depleted genera between individuals with Active TB and those with Latent TB Infection. (B) Shows the enriched and depleted genera between individuals with Active TB and those that are Uninfected. (C) Shows the enriched and depleted genera between individuals with Latent TB Infection and those that are Uninfected.
Figure 9
Figure 9
A circular tree plot showing taxa with significant LDA scores according to Mycobacterium tuberculosis Infection Status
Figure 10
Figure 10
A bar plot showing phyla with significant LDA scores according to Mycobacterium tuberculosis Infection Status Adopted from Kayongo et al. with some modifications.
Figure 11
Figure 11
Machine Learning Model Performance of rf, SVM and GLM machine learning models (A) Performance of the Random Forest machine learning model, showing an AUC of 99.7. (B) Performance of the Support Vector Machines (SVM) machine learning model, showing an AUC of 59.8%. (C) Performance of the Generalized Linear Model (GLM), showing an AUC of 55.3%.
Figure 12
Figure 12
Significant taxa loaded by the Random Forest machine learning model differentiating Mycobacterium tuberculosis Infection Status Adopted from Kayongo et al. with some modifications.
Figure 13
Figure 13
Cross Validation when running the Random Forest model

References

    1. Kayongo A., Ntayi M.L., Olweny G., Kyalo E., Ndawula J., Ssengooba W., Kigozi E., Kalyesubula R., Munana R., Namaganda J., et al. Airway microbiome signature accurately discriminates Mycobacterium tuberculosis infection status. iScience. 2024;27 doi: 10.1016/J.ISCI.2024.110142. - DOI - PMC - PubMed
    1. Bolyen E., Rideout J.R., Dillon M.R., Bokulich N.A., Abnet C.C., Al-Ghalith G.A., Alexander H., Alm E.J., Arumugam M., Asnicar F., et al. Reproducible, interactive, scalable and extensible microbiome data science using QIIME 2. Nat. Biotechnol. 2019;37:852–857. doi: 10.1038/s41587-019-0209-9. - DOI - PMC - PubMed
    1. Callahan B.J., McMurdie P.J., Rosen M.J., Han A.W., Johnson A.J.A., Holmes S.P. DADA2: High-resolution sample inference from Illumina amplicon data. Nat. Methods. 2016;13:581–583. doi: 10.1038/nmeth.3869. - DOI - PMC - PubMed
    1. Edgar R.C. UPARSE: highly accurate OTU sequences from microbial amplicon reads. Nat. Methods. 2013;10:996–998. doi: 10.1038/nmeth.2604. - DOI - PubMed
    1. Hildebrand F., Tadeo R., Voigt A.Y., Bork P., Raes J. LotuS: an efficient and user-friendly OTU processing pipeline. Microbiome. 2014;2:30–37. doi: 10.1186/2049-2618-2-30/TABLES/3. - DOI - PMC - PubMed

MeSH terms

LinkOut - more resources