. 2025 Apr;45(4):486-490.
doi: 10.1002/cac2.12663. Epub 2025 Jan 18.

Inhibition of mTOR attenuates the initiation and progression of BRCA1-associated mammary tumors

Affiliations

Inhibition of mTOR attenuates the initiation and progression of BRCA1-associated mammary tumors

Hye Jung Baek et al. Cancer Commun (Lond). 2025 Apr.
No abstract available


Conflict of interest statement

The authors declare no conflict of interest.

Figures
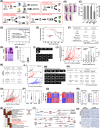
FIGURE 1
FIGURE 1
Contribution of mTOR in the initiation and progression of BRCA1‐associated mammary tumors. (A) Overview of the experimental designs to investigate the attenuation of tumor initiation and progression by mTOR inhibition in Brca1‐mutant mice. (B) Representative whole‐mount staining of mammary glands from 2‐month‐old mice with the indicated genotypes. Arrows indicate the presence of sprouting ducts in the mammary glands. Scale bar, 5 mm. (C) Total length (light gray) and branch numbers (dark gray) of ducts between the lymph node and the end tip in the 4th mammary glands of 2‐month‐old Brca1co/co (n = 9), Brca1co/coMtorco/co (n = 16), Brca1co/coMMTV‐Cre (n = 18), and Brca1co/coMtorco/coMMTV‐Cre (n = 25) mice, estimated using Branch software (**P < 0.01, one‐way ANOVA with Tukey's post hoc correction). (D) Kaplan‐Meier curves of tumor‐free survival showing normal survival (100%) of Brca1co/co (n = 28) and Brca1co/coMtorco/co (n = 30) mice and significantly diminished tumor‐free survival in Brca1co/coMMTV‐Cre mice (n = 24) compared with Brca1co/coMtorco/coMMTV‐Cre mice (n = 29) (*P  =  0.008, log‐rank test). (E‐F) Kaplan‐Meier curves (E) and Summary data (F) showing tumor‐free survival of Brca1co/coMMTV‐Cre mice treated with vehicle (n = 14) or everolimus (EVE, n = 11, 20 mg/kg, oral, 5 times/week). (G) Representative whole‐mount staining of non‐tumor‐baring mammary glands from 15‐month‐old Brca1co/coMMTV‐Cre mice treated with vehicle or everolimus for 11 months. Small arrowheads indicate abnormal foci. The panels on the right are magnifications of the boxed areas in adjacent panels. Scale bar, 5 mm. (H) Number of foci per mammary gland in vehicle‐ (n = 6) and everolimus‐treated (n = 11) non‐tumor‐baring mammary glands (**P < 0.01). (I) Upon spontaneous tumor appearance, tumor‐bearing mice were randomized into vehicle (n = 11) or everolimus (n = 15, 20 mg/kg, oral, 5 times/week) treatment. Tumor growth progression was monitored weekly by MRI. Representative MRI scans of tumor‐bearing mice at baseline and following the indicated treatments. (J) Graphs showing RTVs (left panel) between post‐treatment and baseline (start of treatment) and analysis of weekly progression (right panel). Tumor growth was assessed by the RTV = tumor volume at a given time (cm3)/tumor volume at the initiation of treatment (cm3). Weekly progression in the everolimus‐treated group was significantly lower than that in the vehicle‐treated group (P = 0.0002, chi‐square test). (K) Summary data showing tumor progression and mouse survival following vehicle or everolimus treatment. (L) Responsiveness of spontaneously developed mammary tumors from Brca1co/coMMTV‐Cre mice to everolimus, segregated based on mouse survival: non‐responder (NR), survival ≤ 9 weeks; responder (R), survival > 9 weeks. (M) Representative MRI scans of non‐responder and responder tumor‐bearing mice at baseline and the indicated times. (N) Summary data showing everolimus‐responsiveness of tumor progression (RTV) and mouse survival. (O) Graph showing calculated RTVs for engrafted tumors treated with vehicle (black lines) or everolimus (red lines). Spontaneously developed mammary tumors (n = 22) were collected from Brca1co/coMMTV‐Cre mice and transplanted into nude mice. Growth of the corresponding tumors in sham‐treated mice versus mice treated with everolimus (5 mg/kg, oral, 5 times/week) was tested. All mice were sacrificed when any tumors from a shared origin reached ∼3 cm3. (P) Comparison of RTVs and tumor weights at the end of the study between vehicle‐treated (n = 22) and everolimus‐treated (n = 22) mice. (Q) Heat maps showing protein (prot1 and prot2) and phosphopeptide (phos1 and phos2) signatures (rows) defining Sub1 and Sub2. The numbers of proteins and phosphopeptides are indicated in parentheses. (R) Box plots showing ratios of RTVs (left panel) and tumor weights (right panel) at endpoints in everolimus‐treated samples compared with their paired vehicle‐treated samples in Sub1 and Sub2. **, P < 0.01; *, P < 0.05 from two‐sample t‐test. (S) Cellular pathways significantly enriched by proteins (prot1 and 2) and phosphoproteins of selected phosphopeptides (phos1 and phos2) defining Sub1 and Sub2. The heat map shows pathway enrichment significance, represented as z‐scores computed as ‐N−1(P‐value), where P‐value is the enrichment P‐value from DAVID or ConsensusPathDB, and N−1(P‐value) is the inverse normal distribution. (T) Network model showing interactions between proteins and phosphorylated proteins involved in leukotriene metabolic process (top), actin cytoskeleton regulation (bottom left), and neutrophil extracellular trap formation (NETosis, bottom right). Pink nodes indicate proteins (prot2) defining Sub2, while circled P on a node indicates phosphoproteins containing the phosphopeptides (phos2) defining Sub2. Solid arrows indicate direct activation; dotted arrows indicate indirect activation; arrows with “+p” denote phosphorylation. (U) Representative immunohistochemistry images of ALOX5 for the indicated responder and non‐responder. Scale bar, 50 µm. Abbreviations: AA, arachidonic acid; DAG, diacylglycerol; PI, phosphatidylinositol.

References

    1. Venkitaraman R. Triple‐negative/basal‐like breast cancer: clinical, pathologic and molecular features. Expert Rev Anticancer Ther. 2010;10(2):199–207. - PubMed
    1. Nanda R. “Targeting” triple‐negative breast cancer: the lessons learned from BRCA1‐associated breast cancers. Semin Oncol. 2011;38(2):254–262. - PubMed
    1. Chen S, Parmigiani G. Meta‐analysis of BRCA1 and BRCA2 penetrance. J Clin Oncol. 2007;25(11):1329–1333. - PMC - PubMed
    1. Baek HJ, Kim SE, Kim JK, Shin DH, Kim TH, Kim KG, et al. Inhibition of AKT suppresses the initiation and progression of BRCA1‐associated mammary tumors. Int J Biol Sci. 2018;14(13):1769–1781. - PMC - PubMed
    1. Zou Z, Tao T, Li H, Zhu X. mTOR signaling pathway and mTOR inhibitors in cancer: progress and challenges. Cell Biosci. 2020;10:31. - PMC - PubMed

LinkOut - more resources