. 2025 Feb 12;33(2):235-251.e7.
doi: 10.1016/j.chom.2024.12.017. Epub 2025 Jan 17.

Fiber- and acetate-mediated modulation of MHC-II expression on intestinal epithelium protects from Clostridioides difficile infection

Affiliations

Fiber- and acetate-mediated modulation of MHC-II expression on intestinal epithelium protects from Clostridioides difficile infection

José L Fachi et al. Cell Host Microbe. .

Abstract

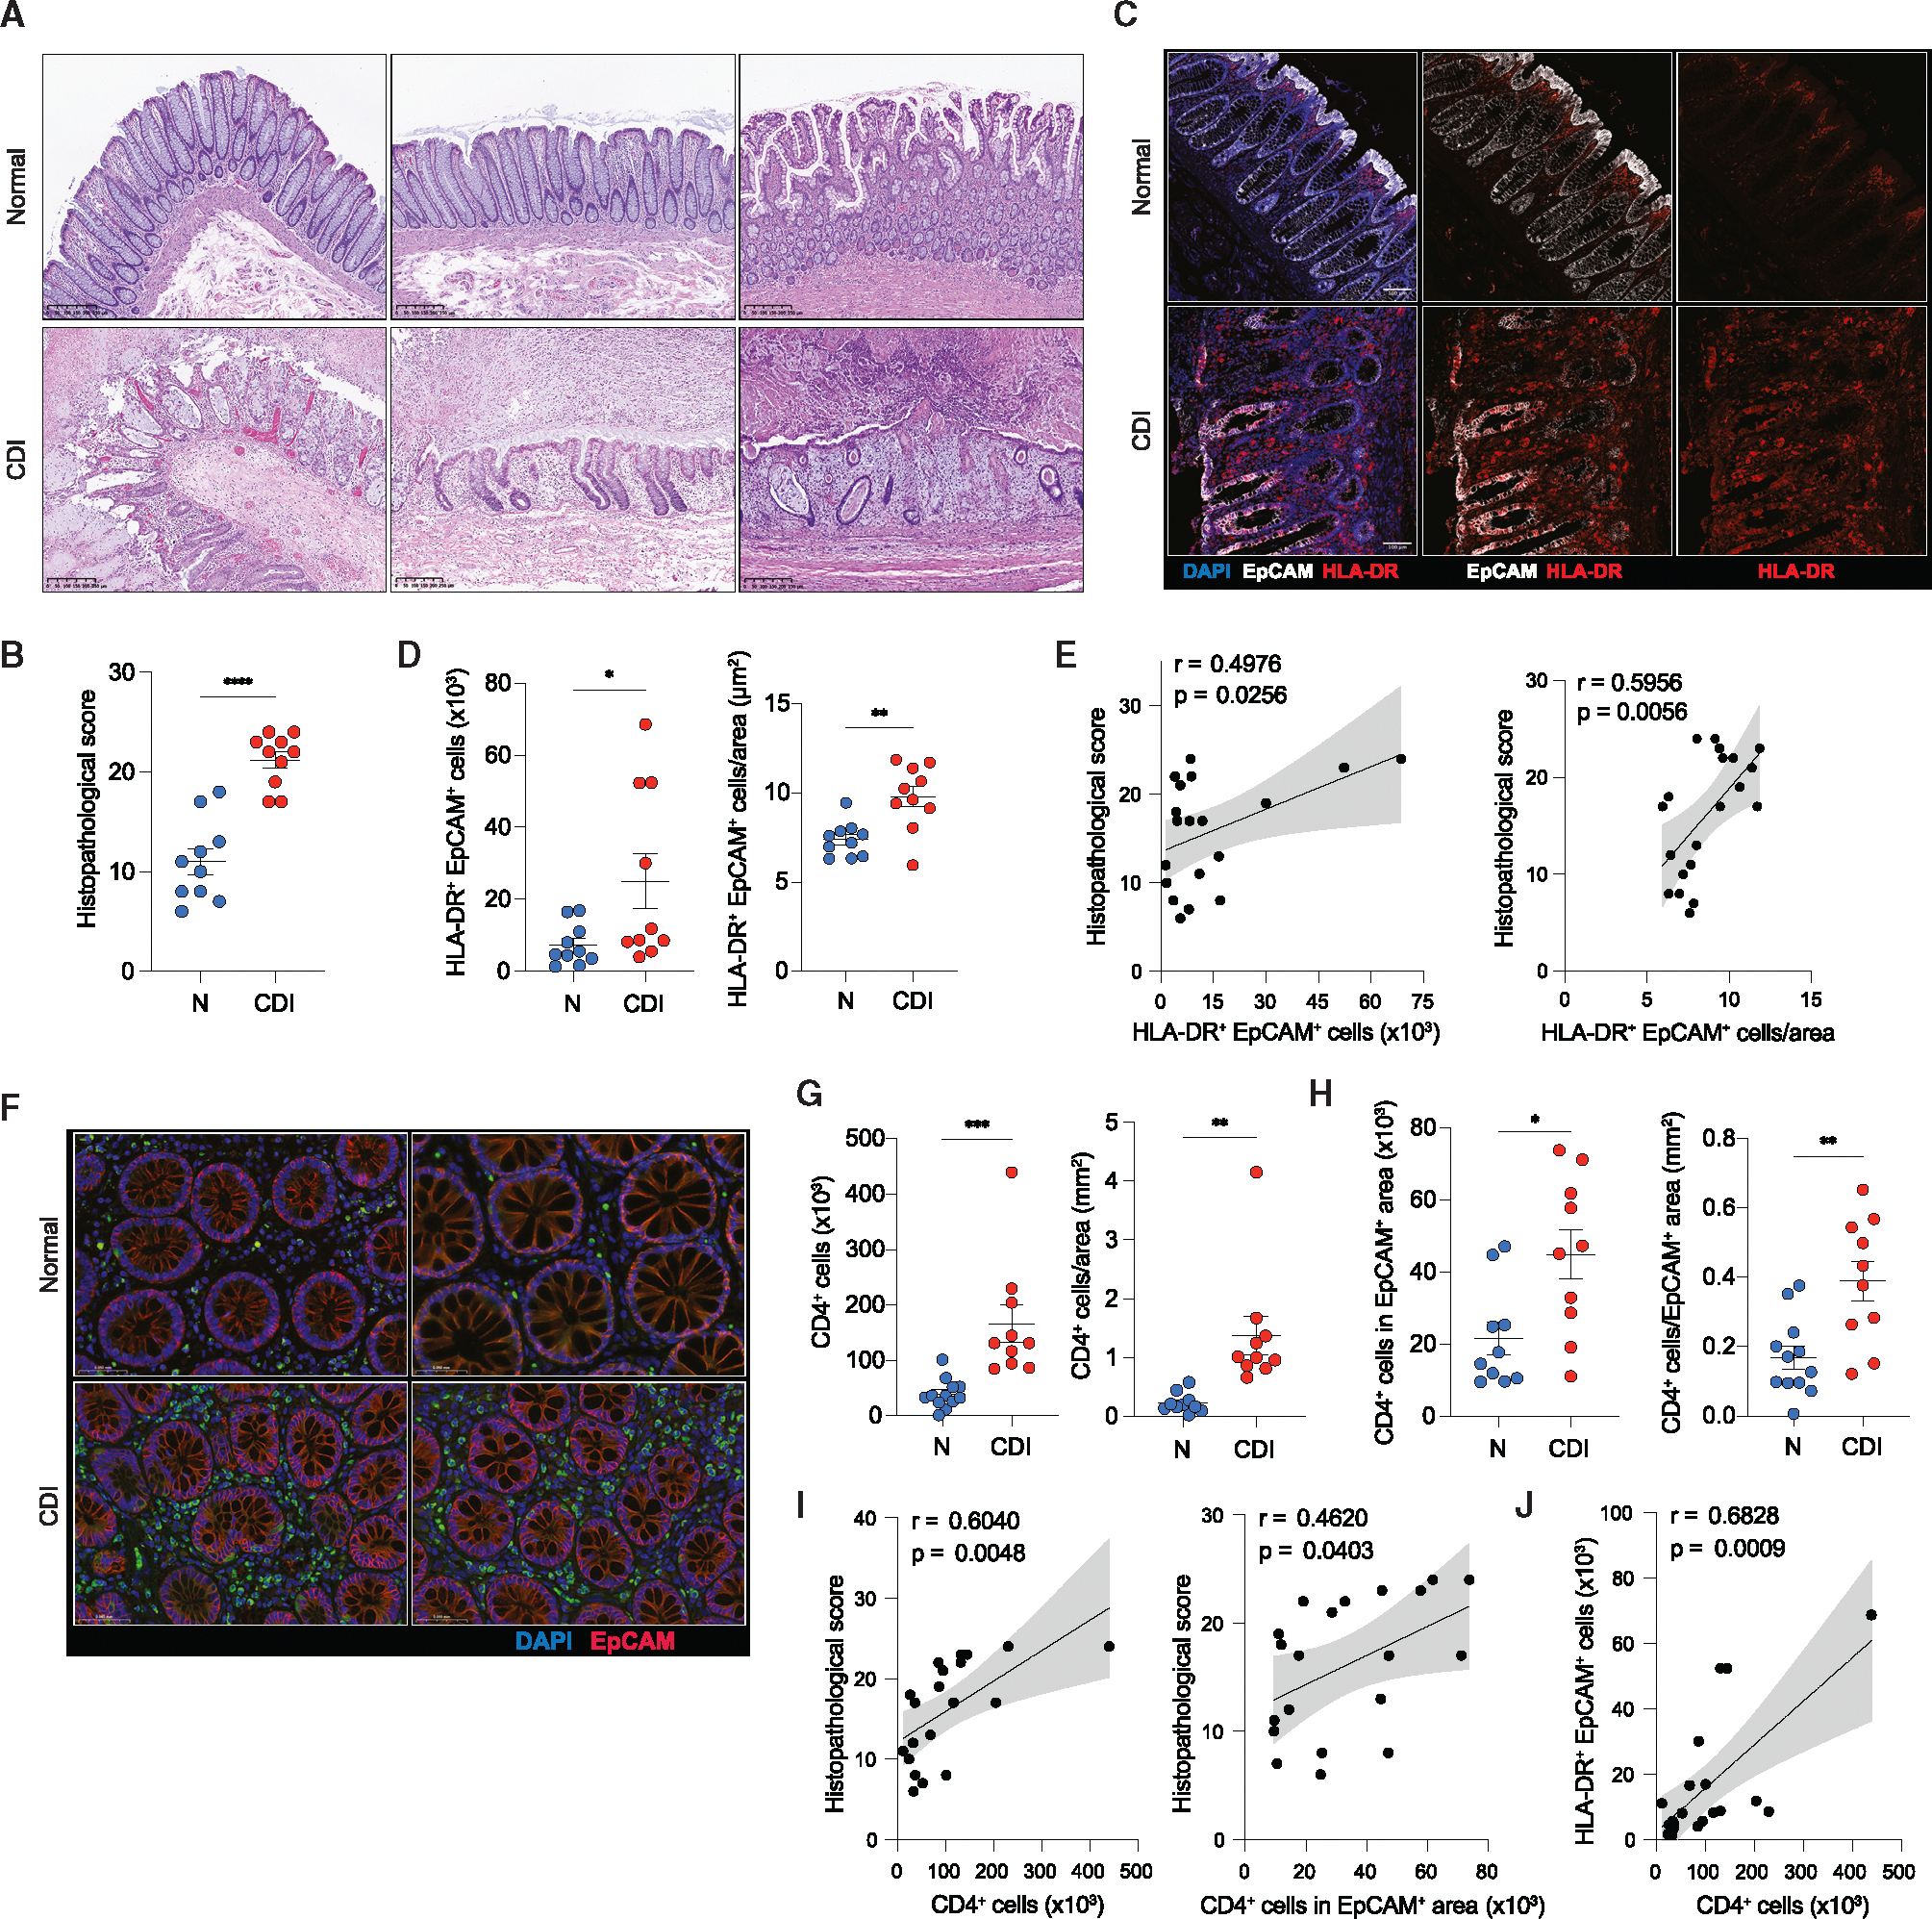
Here, we explore the relationship between dietary fibers, colonic epithelium major histocompatibility complex class II (MHC-II) expression, and immune cell interactions in regulating susceptibility to Clostridioides difficile infection (CDI). We find that a low-fiber diet increases MHC-II expression in the colonic epithelium, which, in turn, worsens CDI by promoting the development of pathogenic CD4+ intraepithelial lymphocytes (IELs). The influence of dietary fibers on MHC-II expression is mediated by its metabolic product, acetate, and its receptor, free fatty acid receptor 2 (FFAR2). While acetate activation of FFAR2 on epithelial cells helps resist CDI, it does not directly regulate MHC-II expression. Instead, MHC-II is regulated by FFAR2 in type 3 innate lymphoid cells (ILC3s). Acetate enhances interleukin-22 (IL-22) production by ILC3s, which then suppresses MHC-II expression on the colonic epithelium. In conclusion, a low-fiber diet reduces acetate-induced IL-22 production by ILC3s, leading to increased MHC-II on the colonic epithelium. This change affects recovery from CDI by expanding the population of pathogenic CD4+ IELs.

Keywords: Clostridioides difficile; MHC-II; diet; fibers; group 3 innate lymphoid cells; gut microbiota; interleukin-22; intestinal epithelial cells; intraepithelial lymphocytes; short-chain fatty acids.


Conflict of interest statement

Declaration of interests The authors declare no competing interests.

Figures

Figure 1.
Figure 1.. Dietary fibers influence disease severity in a mouse model of CDI
(A) Experimental design: mice were fed SD, LFiD, or HFiD, followed by antibiotics and C. difficile infection (108 CFU). (B–D) Survival rates (B), body weight (C), and clinical score (D) during CDI (n= 20). (E) C. difficile abundance in feces after infection (n = 10). (F) Colon and cecum length 4 d.p.i. (n= 4–5). (G) Fecal lipocalin-2 levels 4 d.p.i. (n = 5). (H) Frequency of CD11b+ Ly6G+ neutrophils and CD11b+ Ly6C+ inflammatory monocytes in the colonic LP 4 d.p.i. (n= 3–4). (I) Representative H&E cecum and colon sections 4 d.p.i. Scale bars, 50–100 μm. (J) Histopathological score of colonic sections 4 d.p.i. (n= 4–5). (K) Ki67 staining for intestinal cell proliferation (n= 4). (L and M) Goblet cell analysis by Alcian blue (AB) and periodic acid Schiff (PAS) staining of colon sections 4 d.p.i. (n = 4). Scale bars, 50 μm. Error bars, mean ± SEM. Statistical analysis: t test or one-way ANOVA with Tukey’s post hoc test. *p < 0.05, **p < 0.01, ***p< 0.001.
Figure 2.
Figure 2.. HFiD enhances epithelial integrity and reduces MHC-II expression in colonic epithelial cells during CDI
(A) Representative TUNEL staining of colon and cecum sections 4 d.p.i. Scale bars, 20 μm (40×) or 50 μm (20×). (B) Scoring of TUNEL+ epithelial cells (n= 4). (C) Intestinal permeability 4 d.p.i. measured by FITC-dextran assay (n = 3–4). (D) Bacterial translocation in liver, spleen, and mLN 4 d.p.i. (n= 4). (E) H2-Ab1 and Ciita mRNA levels in proximal colon during CDI (n= 3–7). (F) Immunofluorescence of colon sections for MHC-II expression in epithelial cell adhesion molecule (EpCAM)+ cells 4 d.p.i. Scale bars, 20 μm. DAPI(4′,6-diamidino-2-phenylindole) stains nuclei. (G and H) Representative fluorescence-activated cell sorting (FACS) plots (G) and quantification of frequency and gMFI of MHC-II expression (H) in colonic epithelial cells 4 d.p.i. (n = 3–4). (I) FACS plots and frequency of CD3+ CD4+ T cells in epithelium and LP 4 d.p.i. (n= 3–4). (J) mRNA levels of cytokines in proximal colon 4 d.p.i. (n = 4). Error bars, mean ± SEM. Statistical analysis: t test or one-way ANOVA with Tukey’s post hoc test. *p < 0.05, **p < 0.01, ***p < 0.001, ****p < 0.0001; ns, not significant.
Figure 3.
Figure 3.. MHC-II deficiency in intestinal epithelial cells mitigates CDI outcomes
(A) Body weight and clinical score during CDI in WT or H2-Ab1−/− mice on different diets (n = 5). (B) C. difficile burden in feces 4 d.p.i. (n= 4). (C) Intestinal permeability assessed by FITC-dextran 4 d.p.i. (n= 4). (D) Number of CD11b+ Ly6G+ neutrophils in the colonic LP 4 d.p.i. (n = 4). (E) Experimental design of bone marrow (BM) chimera: CD45.2 WT or H2-Ab1−/− mice were reconstituted with CD45.1 WT BM (n = 5). Mice were maintained on SD. (F) Body weight and clinical score of WT or H2-Ab1−/− BM chimeric mice in CDI (n= 5). (G) C. difficile burden 4 d.p.i. (n = 5). (H) Intestinal permeability measured by FITC-dextran assay 4 d.p.i. (n = 5). (I) Body weight and clinical score of H2-Ab1fl/fl and H2-Ab1ΔIEC mice during CDI (n= 5). Mice were fed SD. (J) Fecal C. difficile burden 5 d.p.i. (n= 5). (K) Colon length in H2-Ab1fl/fl and H2-Ab1ΔIEC mice uninfected 5 d.p.i. (n = 4–5). (L) Bacterial translocation in liver, spleen, and mLN (n= 5). (M) Representative H&E colon sections and cumulative histopathological score 5 d.p.i. (n = 5). Scale bars, 100 μm. (N) Fecal lipocalin-2 levels 5 d.p.i. (n= 3). (O) Number of CD11b+ Ly6G+ neutrophils and CD11b+ Ly6C+ monocytes in colonic LP 5 d.p.i. (n= 4–9). (P) S100a8 mRNA levels in proximal colon 5 d.p.i. (n = 4–5). (Q and R) Frequency of CD3+ CD4+ T cells (Q) and CD4+ Foxp3+ Treg or CD4+ T-bet+ Th1 (R) cells in the epithelium of H2-Ab1fl/fl and H2-Ab1ΔIEC mice either uninfected or 5 d.p.i. (n= 4–9). (S) Quantification of CD3+ CD4+, CD4+ Foxp3+, and CD4+ T-bet+ T cells in colonic LP 5 d.p.i. (n = 4–9). (T) mRNA expression of cytokines in the proximal colon 5 d.p.i. (n = 4–5). Error bars, mean ± SEM. Statistical analysis: one-way ANOVA with Tukey’s post hoc test. *p< 0.05, **p< 0.01, ***p< 0.001, ****p< 0.0001; ns, not significant.
Figure 4.
Figure 4.. SCFA suppresses epithelial MHC-II expression in the colon during CDI
(A) Experimental design: mice were fed LFiD or HFiD from day −28. On day −14, HFiD mice received either a 7-day antibiotic regimen (VNAM) or no treatment. SCFA was provided in the drinking water to a group of HFiD + VNAM mice from day −6 until the end of the experiment. All mice received CDI antibiotics and were infected with C. difficile. (B) Body weight and clinical score of mice on different fiber diets with/without VNAM and SCFA treatment (n = 4). (C) Colon length of mice on different fiber diets, with/without VNAM and SCFA, 4 d.p.i. (n = 4). (D) H&E colon sections and histopathological score 4 d.p.i. Scale bars, 100 μm. (E) Bacterial translocation in liver, spleen, and mLN by 16S rDNA 4 d.p.i. (n= 4). (F) MHC-II expression on colonic epithelial cells 4 d.p.i. (n= 4). (G) Frequency of CD3+ CD4+ IELs 4 d.p.i. (n= 4). (H) Body weight and clinical score of SCFA-treated mice (n = 4). Mice received acetate (Ac), butyrate (Bt), propionate (Pr), or water (control, Ct) from day −7, followed by antibiotics and C. difficile infection (day 0). All mice were maintained on SD. (I and J) Colon length (I) and H&E colon sections with respective histopathological scores (J) of SCFA-treated mice 5 d.p.i. (n = 4). Scale bars, 100 μm. (K and L) Frequency of MHC-II+ CD45 EpCAM+ cells (K) and CD45+ CD3+ CD4+ IELs (L) in SCFA-treated mice 5 d.p.i. (n= 4). (M) Ifng and Il10 mRNA levels in proximal colon 5 d.p.i., normalized to control (n = 4). Error bars, mean ± SEM. Statistical analysis: one-way ANOVA with Tukey’s post hoc test. *p< 0.05, **p< 0.01, ***p< 0.001, ****p< 0.0001; ns, not significant.
Figure 5.
Figure 5.. FFAR2-deficiency exacerbates gut inflammation during CDI
(A) Body weight and clinical score of Ffar2−/− mice on different fiber diets during CDI (n = 5). (B–E) Colon length (B), fecal lipocalin-2 levels (C), bacterial translocation to the liver, spleen, and mLN (D), and representative H&E colon sections with histopathological scores (E) 4 d.p.i. of Ffar2−/− mice on SD, LFiD, and HFiD. Scale bars, 100 μm. (F) H2-Ab1 and Ciita mRNA levels in colonic epithelial cells from Ffar2−/− mice 4 d.p.i., normalized to SD group (n= 4). (G) mRNA levels of Ifng and Il10 in the proximal colon of Ffar2−/− mice 4 d.p.i. (n = 4). (H) Body weight, clinical score, and colon length of Ffar2fl/fl and Ffar2ΔIEC mice maintained on SD during CDI (n = 5). (I–J) Representative H&E colon sections with histopathological scores (I), and bacterial translocation (J) 5 d.p.i. Scale bars, 100 μm. (K) MHC-II expression in CD45 EpCAM+ epithelial cells 5 d.p.i. (n = 4). (L) Frequency of colonic CD3+ CD4+ IELs 5 d.p.i. (n= 4). (M) Ifng and Il10 mRNA expression in the proximal colon 5 d.p.i. (n = 4). (N) Schematic of experimental design and representative immunofluorescence images of small intestine organoids for MHC-II and EpCAM expression, with or without IFN-γ and acetate (n= 3). Scale bars, 50 μm. DAPI stains nuclei. (O) FACS plot and MHC-II gMFI of CD45 EpCAM+ cells from organoid cultures stimulated or not with IFN-γ and acetate (n = 4). Error bars, mean ± SEM. Statistical analysis: t test or one-way ANOVA with Tukey’s post hoc test. *p< 0.05, **p < 0.01; ns, not significant.
Figure 6.
Figure 6.. Fiber and acetate-induced IL-22 production by ILC3s suppresses epithelial MHC-II expression during CDI
(A) Body weight and clinical score of Ffar2fl/fl and Ffar2ΔVAV mice during CDI (n = 5). Mice were fed SD. (B–E) Intestinal permeability by FITC-dextran (B), MHC-II gMFI in CD45 EpCAM+ cells and frequency of CD3+ CD4+ IELs (C), and cytokines mRNA levels 5 d.p.i. (D and E) (n = 4). (F–I) Body weight, clinical score, and colon length (F); relative fecal C. difficile abundance (G); MHC-II gMFI in CD45 EpCAM+ cells and frequency of CD3+ CD4+ IELs (H); and Ifng and Il10 mRNA in proximal colon (I) of WT mice on SD treated with anti-IgG isotype or anti-IL-22 neutralizing antibody 1 and 3 d.p.i. (n= 4–5). (J) Frequency of IL-22-producing ILC3s and CD4+ T cells in colonic LP at steady state (n = 4). (K) Experimental design: CD45.1 mice were irradiated (11 Gy) and received a mixture of 3 × 10⁶ CD45.1/2 (WT) and 3 × 10⁶ CD45.2 (Ffar2−/−) BM cells. Mice were allowed to reconstitute for 8 weeks, then treated with CDI antibiotics and infected with C. difficile. Mice were maintained on SD. (L) Representative FACS plots showing BM reconstitution in the spleen and frequency of colonic ILC3s in mixed BM chimera mice 4 d.p.i. (n= 4). (M) Frequency of CD45.1/2+ or CD45.2+ IL-22-producing ILC3s 4 d.p.i. after ex vivo isolation and incubation under different conditions: unstimulated (US), 10 ng/mL IL-23, or 50 ng/mL PMA + 500 ng/mL ionomycin (n = 4). (N) FACS plots and frequency of MHC-II-expressing epithelial cells in WT, Rag2−/−, and Rag2yc−/− mice fed either LFiD or HFiD 4 d.p.i. (n = 4). (O–R) Body weight, clinical score, and colon length (O); Il22 mRNA in proximal colon (P); MHC-II gMFI in CD45 EpCAM+ cells and frequency of CD3+ CD4+ IELs (Q); and Ifng and Il10 mRNA (R) in proximal colon of AhRfl/fl and AhRΔRORγt mice on SD (n = 5). Error bars, mean ± SEM. Statistical analysis: t test or one-way ANOVA with Tukey’s post hoc test. *p< 0.05, **p < 0.01, ***p < 0.001; ns, not significant.
Figure 7.
Figure 7.. Histopathological and immunological analysis of human colon biopsies in uninfected controls and CDI patients
(A) Representative H&E-stained colon sections from uninfected controls displaying normal histological features (N) and CDI patients (n= 10). Scale bars, 250 μm. (B) Histopathological scoring of controls (N) and CDI patients (n= 10), evaluated across 10 parameters, each scored from 0 to 3. (C) HLA-DR and EpCAM staining in colon sections from controls and CDI patients (n = 10). Scale bars, 100 μm. DAPI stains nuclei. (D) Quantification of HLA-DR+ EpCAM+ cells in controls vs. CDI patients (n= 10). (E) Correlation between histopathological score and HLA-DR+ EpCAM+ cells in CDI (n= 10). (F) CD4 and EpCAM staining of colon sections from controls and CDI patients (n= 10). Scale bars, 100 μm. DAPI stains nuclei. (G) Quantification of CD4+ cells in controls vs. CDI patients (n= 10). (H) Relative CD4+ cell numbers in EpCAM+ cells area (n= 10). (I and J) Correlation of CD4+ cell numbers (I) and CD4+ cells in EpCAM+ area (J) with histopathological score and number of HLA-DR+ EpCAM+ cells (n= 10). Error bars, mean ± SEM. Statistical analysis: t test for comparisons; Pearson’s test for correlations. *p < 0.05, **p < 0.01, ***p< 0.001, ****p < 0.0001.

References

    1. Lawley TD, Clare S, Deakin LJ, Goulding D, Yen JL, Raisen C, Brandt C, Lovell J, Cooke F, Clark TG, et al. (2010). Use of purified Clostridium difficile spores to facilitate evaluation of health care disinfection regimens. Appl. Environ. Microbiol. 76, 6895–6900. 10.1128/AEM.00718-10. - DOI - PMC - PubMed
    1. Koenigsknecht MJ, Theriot CM, Bergin IL, Schumacher CA, Schloss PD, and Young VB (2015). Dynamics and establishment of Clostridium difficile infection in the murine gastrointestinal tract. Infect. Immun. 83, 934–941. 10.1128/IAI.02768-14. - DOI - PMC - PubMed
    1. Theriot CM, Bowman AA, and Young VB (2016). Antibiotic-induced alterations of the gut microbiota alter secondary bile acid production and allow for Clostridium difficile Spore germination and outgrowth in the large intestine. mSphere 1, e00045–15. 10.1128/mSphere.00045-15. - DOI - PMC - PubMed
    1. Theriot CM, Koenigsknecht MJ, Carlson PE, Hatton GE, Nelson AM, Li B, Huffnagle GB, Z Li J, and Young VB (2014). Antibiotic-induced shifts in the mouse gut microbiome and metabolome increase susceptibility to Clostridium difficile infection. Nat. Commun. 5, 3114. 10.1038/ncomms4114. - DOI - PMC - PubMed
    1. Carter GP, Chakravorty A, Pham Nguyen TA, Mileto S, Schreiber F, Li L, Howarth P, Clare S, Cunningham B, Sambol SP, et al. (2015). Defining the roles of TcdA and TcdB in localized gastrointestinal disease, systemic organ damage, and the Host Response during Clostridium difficile Infections. mBio 6, e00551. 10.1128/mBio.00551-15. - DOI - PMC - PubMed

MeSH terms