

Longitudinal association between DNA methylation and type 2 diabetes: findings from the KORA F4/FF4 study
- PMID: 39827095
- PMCID: PMC11748594
- DOI: 10.1186/s12933-024-02558-8
Longitudinal association between DNA methylation and type 2 diabetes: findings from the KORA F4/FF4 study
Erratum in
-
Correction: Longitudinal association between DNA methylation and type 2 diabetes: findings from the KORA F4/FF4 study.Cardiovasc Diabetol. 2025 Jun 14;24(1):252. doi: 10.1186/s12933-025-02760-2. Cardiovasc Diabetol. 2025. PMID: 40517252 Free PMC article. No abstract available.
Abstract
Background: Type 2 diabetes (T2D) has been linked to changes in DNA methylation levels, which can, in turn, alter transcriptional activity. However, most studies for epigenome-wide associations between T2D and DNA methylation comes from cross-sectional design. Few large-scale investigations have explored these associations longitudinally over multiple time-points.
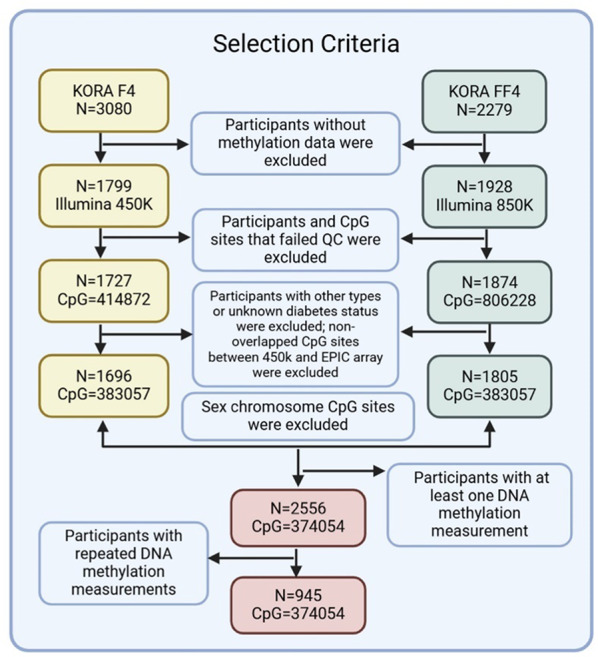
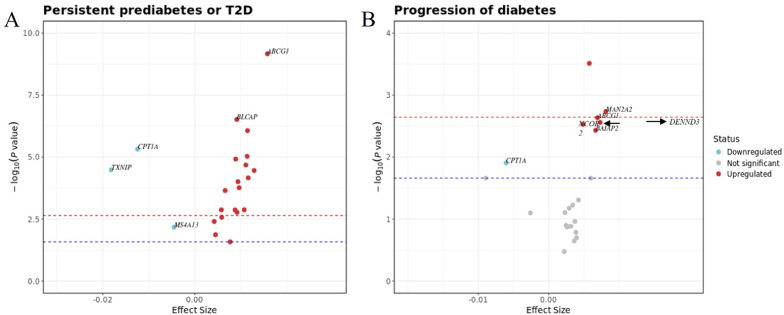
Methods: In this longitudinal study, we examined data from the Cooperative Health Research in the Region of Augsburg (KORA) F4 and FF4 studies, conducted approximately seven years apart. Leucocyte DNA methylation was assessed using the Illumina EPIC and 450K arrays. Linear mixed-effects models were employed to identify significant associations between methylation sites and diabetes status, as well as with fasting plasma glucose (FPG), hemoglobin A1c (HbA1c), homoeostasis model assessment of beta cell function (HOMA-B), and homoeostasis model assessment of insulin resistance (HOMA-IR). Interaction effects between diabetes status and follow-up time were also examined. Additionally, we explored CpG sites associated with persistent prediabetes or T2D, as well as the progression from normal glucose tolerance (NGT) to prediabetes or T2D. Finally, we assessed the associations between the identified CpG sites and their corresponding gene expression levels.
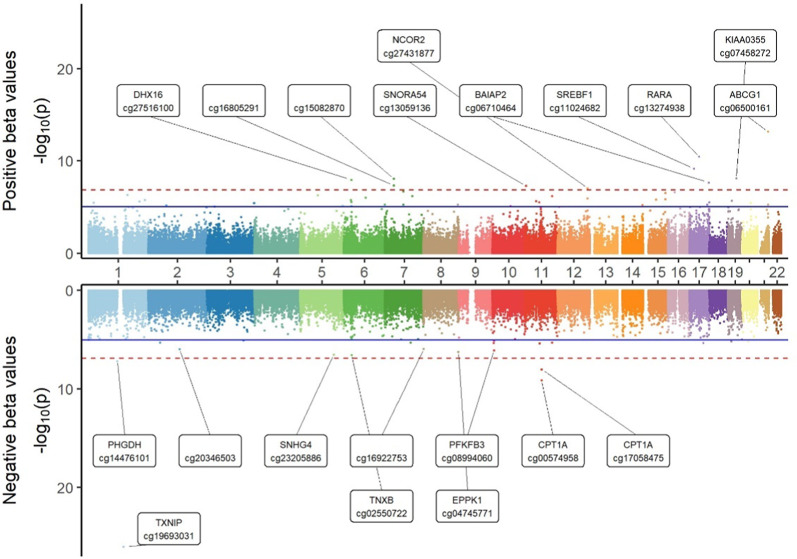
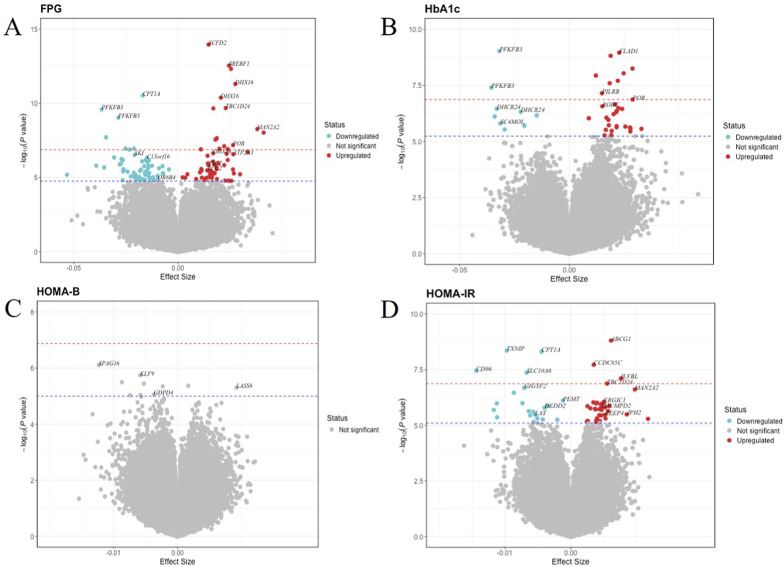
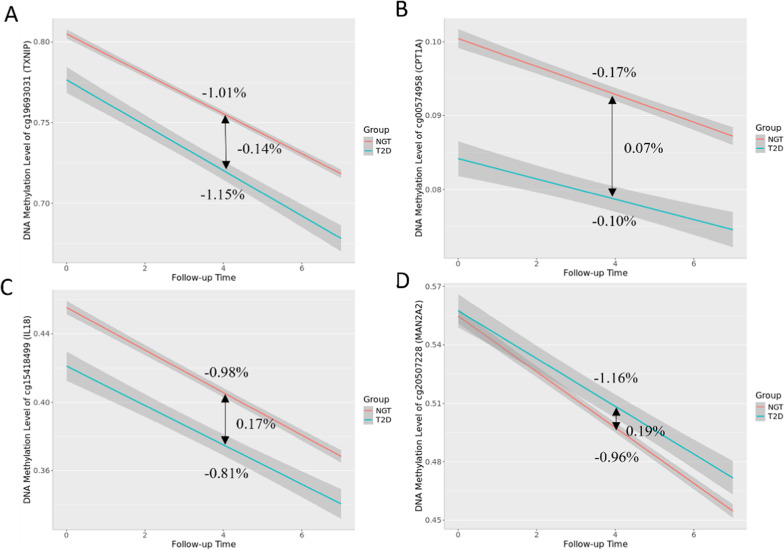
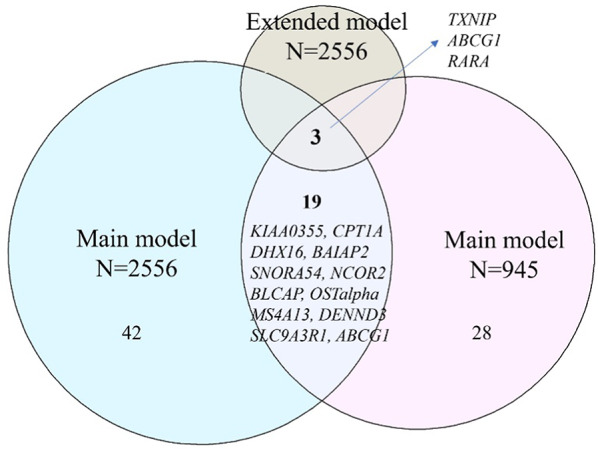
Results: A total of 3,501 observations from 2,556 participants, with methylation measured at least once across two visits, were included in the analyses. We identified 64 sites associated with T2D including 15 novel sites as well as known associations like those with the thioredoxin-interacting protein (TXNIP) and ATP-binding cassette sub-family G member 1 (ABCG1) genes. Of these, eight CpG sites exhibited different rates of annual methylation change between the NGT and T2D groups, and seven CpG sites were linked to the progression from NGT to prediabetes or T2D, including those annotated to mannosidase alpha class 2a member 2 (MAN2A2) and carnitine palmitoyl transferase 1 A (CPT1A). Longitudinal analysis revealed significant associations between methylation and FPG at 128 sites, HbA1c at 41 sites, and HOMA-IR at 57 sites. Additionally, we identified 104 CpG-transcript pairs in whole blood, comprising 40 unique CpG sites and 96 unique gene transcripts.
Conclusions: Our study identified novel differentially methylated loci linked to T2D as well as to changes in diabetes status through a longitudinal approach. We report CpG sites with different rates of annual methylation change and demonstrate that DNA methylation associated with T2D is linked to following transcriptional differences. These findings provide new insights into the molecular mechanisms of diabetes development.
Keywords: DNA methylation; Diabetes progression; Gene expression; Glycemic traits; Type 2 diabetes.
© 2025. The Author(s).
Conflict of interest statement
Declarations. Ethics approval and consent to participate: Ethical approval for the KORA cohort was granted by the ethics committee of the Bavarian Medical Association and all procedures were conducted in accordance with the principles of the Declaration of Helsinki. All research participants provided signed informed consent before participating in any research activities. The KORA data protection procedures were approved by the responsible data protection officer of the Helmholtz Zentrum München. Consent for publication: Not applicable. Competing interests: The authors declare no competing interests.
Figures
Similar articles
-
Longitudinal study reveals plasma glycans associations with prediabetes/type 2 diabetes in KORA study.Cardiovasc Diabetol. 2025 Aug 6;24(1):321. doi: 10.1186/s12933-025-02853-y. Cardiovasc Diabetol. 2025. PMID: 40770702 Free PMC article.
-
Associations of cardiac stress biomarkers with incident type 2 diabetes and changes in glucose metabolism: KORA F4/FF4 study.Cardiovasc Diabetol. 2020 Oct 16;19(1):178. doi: 10.1186/s12933-020-01117-1. Cardiovasc Diabetol. 2020. PMID: 33066780 Free PMC article.
-
Association between DNA Methylation in Whole Blood and Measures of Glucose Metabolism: KORA F4 Study.PLoS One. 2016 Mar 28;11(3):e0152314. doi: 10.1371/journal.pone.0152314. eCollection 2016. PLoS One. 2016. PMID: 27019061 Free PMC article.
-
Blood-based epigenome-wide analyses of 19 common disease states: A longitudinal, population-based linked cohort study of 18,413 Scottish individuals.PLoS Med. 2023 Jul 6;20(7):e1004247. doi: 10.1371/journal.pmed.1004247. eCollection 2023 Jul. PLoS Med. 2023. PMID: 37410739 Free PMC article. Review.
-
Relationship Between Hepatic Iron Concentration and Glycemic Metabolism, Prediabetes, and Type 2 Diabetes: A Systematic Review.Nutr Rev. 2025 Jul 1;83(7):e1828-e1842. doi: 10.1093/nutrit/nuae197. Nutr Rev. 2025. PMID: 39724915
Cited by
-
Correction: Longitudinal association between DNA methylation and type 2 diabetes: findings from the KORA F4/FF4 study.Cardiovasc Diabetol. 2025 Jun 14;24(1):252. doi: 10.1186/s12933-025-02760-2. Cardiovasc Diabetol. 2025. PMID: 40517252 Free PMC article. No abstract available.
-
Epigenetics Plays a Role in the Pathogenesis and Treatment of Diabetes.Genes (Basel). 2025 Jun 30;16(7):769. doi: 10.3390/genes16070769. Genes (Basel). 2025. PMID: 40725425 Free PMC article. Review.
References
-
- Magliano DJ, Boyko EJ. I.D.F. D.A.t.e.s. committee, IDF Diabetes Atlas, in Idf diabetes atlas. 2021, International Diabetes Federation © International Diabetes Federation, Brussels. 2021.
-
- Kaimala S, Ansari SA, Emerald BS. DNA methylation in the pathogenesis of type 2 diabetes. Vitam Horm. 2023;122:147–69. - PubMed
-
- Florath I, et al. Type 2 diabetes and leucocyte DNA methylation: an epigenome-wide association study in over 1,500 older adults. Diabetologia. 2016;59(1):130–8. - PubMed
MeSH terms
Substances
LinkOut - more resources
Full Text Sources
Medical
