. 2025 Jan 18;25(1):18.
doi: 10.1186/s12935-025-03648-7.

Construction of the bromodomain-containing protein-associated prognostic model in triple-negative breast cancer

Affiliations

Construction of the bromodomain-containing protein-associated prognostic model in triple-negative breast cancer

Wei Chen et al. Cancer Cell Int. .

Abstract

Background: Bromodomain-containing protein (BRD) play a pivotal role in the development and progression of malignant tumours. This study aims to identify prognostic genes linked to BRD-related genes (BRDRGs) in patients with triple-negative breast cancer (TNBC) and to construct a novel prognostic model.

Methods: Data from TCGA-TNBC, GSE135565, and GSE161529 were retrieved from public databases. GSE161529 was used to identify key cell types. The BRDRGs score in TCGA-TNBC was calculated using single-sample Gene Set Enrichment Analysis (ssGSEA). Differential expression analysis was performed to identify differentially expressed genes (DEGs): DEGs1 in key cells, DEGs2 between tumours and controls and DEGs3 in high and low BRDRGs score subgroups in TCGA-TNBC. Differentially expressed BRDRGs (DE-BRDRGs) were determined by overlapping DEGs1, DEGs2 and DEGs3. Gene Ontology (GO), Kyoto Encyclopedia of Genes and Genomes (KEGG) pathway analysis, and protein-protein interaction (PPI) network analysis were conducted to investigate active pathways and molecular interactions. Prognostic genes were selected through univariate Cox regression and least absolute shrinkage and selection operator (LASSO) regression analyses to construct a risk model and calculate risk scores. TNBC samples from TCGA-TNBC were classified into high and low-risk groups based on the median risk score. Additionally, correlations with clinical characteristics, Gene Set Enrichment Analysis (GSEA), immune analysis, and pseudotime analysis were performed.

Results: A total of 120 DE-BRDRGs were identified by overlapping 605 DEGs1 from four key cell types, 10,776 DEGs2, and 4,497 DEGs3. GO analysis revealed enriched terms such as 'apoptotic process,' 'immune response,' and 'regulation of the cell cycle,' while 56 KEGG pathways, including the 'MAPK signaling pathway,' were associated with DE-BRDRGs. A risk model comprising six prognostic genes (KRT6A, PGF, ABCA1, EDNRB, CTSD and GJA4) was constructed. A nomogram based on independent prognostic factors was also developed. Immune cell abundance was significantly higher in high-risk group. In both risk groups, TP53 exhibited the highest mutation frequency. The expression of KRT6A, ABCA1, EDNRB, and CTSD went decreased progressively in pseudotime.

Conclusion: A novel prognostic model for TNBC associated with BRDRGs was developed and validated, providing fresh insights into the relationship between BRD and TNBC.

Keywords: Bromodomain-containing protein; Immune microenvironment; Prognosis; Triple-negative breast cancer.


Conflict of interest statement

Declarations. Ethics approval and consent to participate: The study was approved by the Fujian Provincial Hospital Ethics Committee (Approval No: K2021-04-069), and all patients provided written informed consent. Consent for publication: Not applicable. Competing interests: The authors declare no competing interests.

Figures

Fig. 1
Fig. 1
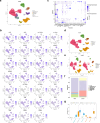
Cell clustering results. (a) Distribution of nFeature_RNA, nCount_RNA, and percent.mt prior to quality control. (b) Distribution of nFeature_RNA, nCount_RNA, and percent.mt after quality control. (c) Identification of the 2000 most variable genes. (d) Inflection point chart for selecting optimal dimensions. (e) PCA-based distribution of cells across sample groups. (f) UMAP-based cell clustering for all samples. (g) UMAP-based cell clustering for TNBC and control samples
Fig. 2
Fig. 2
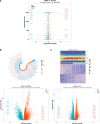
Key cell identification. (a) SingleR cell type annotation. (b) Expression levels of marker genes across cellular taxa. (c) Bubble plots depicting expression of marker genes across cellular taxa. (d) Marker gene-based cell type annotation. (e) Marker gene-based cell type annotation for TNBC and control samples. (f) Proportion of each cell type in TNBC and control samples. (g) Differential cell type proportions between TNBC and control samples
Fig. 3
Fig. 3
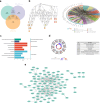
Identification of differentially expressed genes. (a) Volcano plot of differentially expressed genes in key cells between TNBC and control samples. (b) Heatmaps and volcano plots illustrating differentially expressed genes between TNBC and control samples. (c) Heatmap and volcano plot of differentially expressed genes between high- and low-risk subgroups
Fig. 4
Fig. 4
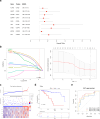
Key genes related to BRDGs and functional enrichment analysis. (a) Screening of key genes associated with BRDGs. (b) Directed acyclic graphs and chord diagrams of GO enrichment results. (c) Classification of KEGG enrichment results. (d) Circular diagram of KEGG enrichment results. (e) Construction of PPI networks. Each node in the network represents a protein, and the connections between nodes represent interactions between the proteins
Fig. 5
Fig. 5
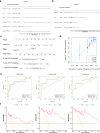
Construction and evaluation of the risk model. (a) Forest plot from univariate Cox analysis. (b) Ten-fold cross-validation and coefficient spectrum from Lasso analysis. (c) Risk curves, scatter plots, and heatmaps depicting model gene expression for high- and low-risk TNBC subgroups. (d) Kaplan-Meier survival curves for high- and low-risk groups. (e) ROC curves for 3-, 5-, and 7-year survival prediction
Fig. 6
Fig. 6
Validation of the risk model in the GSE135565 dataset. (a) Risk curves, scatter plots, and heatmaps of model gene expression for high- and low-risk TNBC subgroups in the GSE135565 validation set. (b) Kaplan-Meier survival curves for high- and low-risk groups in the GSE135565 validation set. (c) ROC curves for 3-, 5-, and 7-year survival prediction in the GSE135565 validation set
Fig. 7
Fig. 7
Development of an independent prognostic model. (a) Forest plot from univariate Cox analysis. (b) Forest plot from multivariate Cox model analysis. (c) Construction of a nomogram. (d) Evaluation of prognostic models via calibration curves. (e) ROC curve for independent prognostic factors. (f) Decision curve analysis (DCA) for the predictive model
Fig. 8
Fig. 8
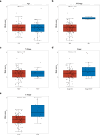
Box plots of risk scores versus clinical indicators. (a) Age. (b) M Stage. (c) N Stage. (d) Stage. (e) T Stage
Fig. 9
Fig. 9
GSEA enrichment analysis results
Fig. 10
Fig. 10
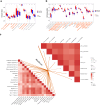
Immune microenvironmental analysis results. (a) Differences in Immune Function Scores between high- and low-risk groups. (b) Differences in immune cell scores between high- and low-risk groups. (c) Correlation between risk scores, immune cells, and immune function pathways
Fig. 11
Fig. 11
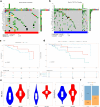
Gene mutation and tumor immune dysfunction and exclusion (TIDE) analysis. (a) Waterfall plot of mutation analysis in the high-risk group. (b) Waterfall plot of mutation analysis in the low-risk group. (c) Kaplan-Meier survival curves for high- and low-TMB score groups. (d) Kaplan-Meier survival analysis of the four subgroups: H-TMB + High Risk, H-TMB + Low Risk, L-TMB + High Risk, and L-TMB + Low Risk. The p < 0.05 indicates that the survival differences among the four subgroups are statistically significant. (e) Box plots of risk score versus tumor immune rejection, tumor immune dysfunction, and TIDE score. (f) Probability of response to immunotherapy
Fig. 12
Fig. 12
Drug sensitivity analysis results. (a) Drugs with higher IC50 in the high-risk group compared to the low-risk group. (b) Drugs with lower IC50 in the high-risk group compared to the low-risk group. (c) Network maps of prognostic genes and corresponding small molecule drugs
Fig. 13
Fig. 13
Expression levels for prognostic genes and pseudotime analysis for key cells. (a) Expression levels of prognostic genes across different cellular taxa. (b) Bubble plot of prognostic gene expression in different cell types. (c) Map of immune cell differentiation pathways with time-based differentiation differences. (d) Expression of prognostic genes in the proposed chronology. (e) The RT-qPCR results of prognostic genes. *p < 0.05, **p < 0.01, ns indicates p > 0.05

Similar articles

References

    1. Cui H, Ren X, Dai L, Chang L, Liu D, Zhai Z, Kang H, Ma X. Comprehensive analysis of nicotinamide metabolism-related signature for predicting prognosis and immunotherapy response in breast cancer. Front Immunol. 2023;14:1145552. - PMC - PubMed
    1. Pei S, Zhang P, Yang L, Kang Y, Chen H, Zhao S, Dai Y, Zheng M, Xia Y, Xie H. Exploring the role of sphingolipid-related genes in clinical outcomes of breast cancer. Front Immunol. 2023;14:1116839. - PMC - PubMed
    1. Fang Z, Gao ZJ, Yu X, Sun SR, Yao F. Identification of a centrosome-related prognostic signature for breast cancer. Front Oncol. 2023;13:1138049. - PMC - PubMed
    1. Li J, Gao F, Su J, Pan T. Bioinformatics identification and validation of aging–related molecular subtype and prognostic signature in breast cancer. Medicine. 2023;102(19):e33605. - PMC - PubMed
    1. Tanimoto S, Sone K, Jonouchi Y, Hachijo R, Suzuki E, Tsuboyama N, Toyohara Y, Inoue F, Honjoh H, Fukuda T, et al. BET inhibitor JQ1 induces apoptosis of ovarian and endometrial endometrioid carcinoma cells by downregulating c–Myc. Oncol Lett. 2025;29(3):106. - PMC - PubMed

LinkOut - more resources