. 2025 Jan 18;16(1):821.
doi: 10.1038/s41467-025-56224-y.

Early attainment of 20-hydroxyecdysone threshold shapes mosquito sexual dimorphism in developmental timing

Affiliations

Early attainment of 20-hydroxyecdysone threshold shapes mosquito sexual dimorphism in developmental timing

Meichun Zhang et al. Nat Commun. .

Abstract

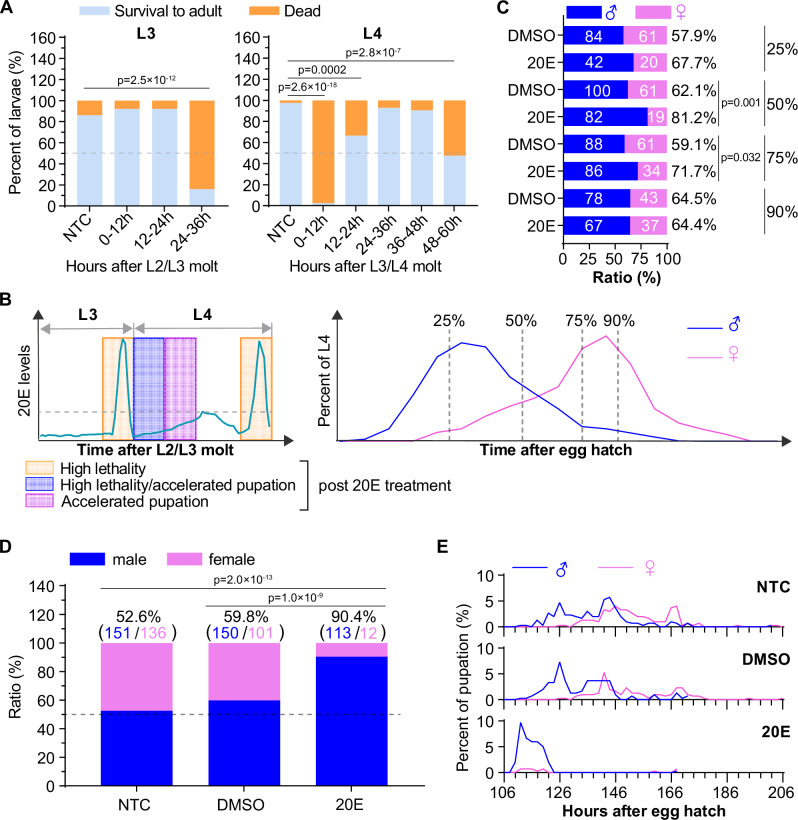
In holometabolous insects, critical weight (CW) attainment triggers pupation and metamorphosis, but its mechanism remains unclear in non-model organisms like mosquitoes. Here, we investigate the role of 20-hydroxyecdysone (20E) in CW assessment and pupation timing in Aedes albopictus and Ae. aegypti, vectors of arboviruses including dengue and Zika. Our results show that the attainment of CW is contingent upon surpassing a critical 20E threshold, which results in entrance into a constant 22 h interval and the subsequent 20E pulse responsible for larval-pupal ecdysis. Sexual dimorphism in pupation time arises from higher basal 20E levels in males, enabling earlier CW attainment. Administering 20E at 50% of L3/L4 molt, when most of males but not females pass the pulse, results in female-specific lethality. These findings highlight the pivotal role of 20E thresholds in CW, pupation timing, and sexual dimorphism, suggesting that manipulating 20E levels can skew populations male, offering a potential mosquito sex separation strategy.


Conflict of interest statement

Competing interests: Z.X. is a co-founder and shareholder of Guangzhou Wolbaki Biotech Co., Ltd and a member of its scientific advisory board. The other authors declare no competing interests.

Figures

Fig. 1
Fig. 1. Starvation delays pupation by decreasing 20E levels.
Determination of the attainment of critical weight by starving newly emerged L4 larvae at different times after L3/L4 molt (A) or every 9 hrs during the development of L4 larvae (B). Pupae were collected every 3 hrs after the first pupa emerged and pupation time was the duration of L4 larval development. For A, n = 88, 37, 70, 80, 86, 86, 87, 85, 84 and 46 for NTC, 3 h, 6 h, 9 h, 12 h, 16, 20 h, 24 h, 30 h and 36 h, respectively. For B, n = 365, 358, 367, 361, 357, 368 and 360 for NTC, 0–9 h, 9–18 h, 18-27 h, 27–36 h, 36–45 h and 45–54 h, respectively. C The effects of starvation on expression of E75, EcR and Usp were assessed in L4 larvae starved for 12 h after L3/L4 molt. n = 21 biological replicates with 3 larvae/replicate for each group. D The ecdysteroid titer in hemolymph was assayed at 24 hrs after starvation. Each sample contained hemolymph from 10 larvae and 5 biological independent samples were collected for each group. E, F The newly emerged L4 larvae were starved and treated with 80 μg/mL of 20E for 12 h, and then fed under normal condition. For E, n = 98, 98, 96, and 90 for group of NTC, Starved, Starved+20E and 20E, respectively. F The concentration of 20E after starvation or 20E treatment for 12 h after L3/L4 molt was assayed by expression of E75; n = 4 biological replicates with 8 larvae/replicate. G The effect of starvation on expression of steroidogenic genes responsible for ecdysone synthesis. The newly emerged L4 larvae were starved for 12 h after L3/L4 molt. The relative expression levels were detected by using qRT-PCR (n = 16 biological replicates with 3 larvae/replicate). Statistic: (A–D, F, G) two-tailed Student’s t-test; (E) one-way ANOVA with Bonferroni’s multiple comparison, the exact p-value was provided in Source Data. NTC: non-treatment control (without starvation or 20E treatment). Data shown are means ± SEM. Source data are provided as a Source Data file.
Fig. 2
Fig. 2. Basal 20E levels determine the pupation time and rate in a dose-dependent manner.
Newly emerged L4 larvae were treated with different concentrations of 20E (A) and CucB (B) for 12 h after L3/L4 molt and then reared under normal condition. For A, n = 171, 117, 119, 175 and 89 for group of NTC, 20, 40, 80 and 120 µg/ml of 20E. For B, n = 133, 60, 61, 62, 90 and 61 for group of NTC, 80, 120, 160, 200 and 400 µg/ml of CucB. C Newly emerged L4 larvae were starved and treated with different concentrations of 20E for 12 h after L3/L4 molt. Then they were reared individually in 24-well plates and starved till pupation (n = 35, 44, 35, 30, 66 and 36 for group of NTC, 0, 20, 40, 80 and 120 µg/ml of 20E). D Adult male (upper), male (middle) and female (lower) pupae emerged from larvae of (C). Statistics: (A and B) one-way ANOVA with Bonferroni’s multiple comparison, bars with different letters are significantly different from each other, the exact p-value was provided in Source Data. NTC: non-treatment control (without drug treatment). Data shown are means ± SEM. Source data are provided as a Source Data file.
Fig. 3
Fig. 3. The basal 20E levels determine the timing of a 20E threshold for critical weight.
The concentrations of 20E were assayed by E75 expression levels for (A, B). A Temporal expression of E75 was detected in L4 larvae using qRT-PCR. L4 larvae were collected individually every 3 h from L3/L4 molt till pupation (n = 10 for each time point). B L4 larvae were treated with 80 μg/mL of 20E or starved for 12 hrs after L3/L4 molt, and then reared under normal condition. Larvae were collected every 2–6 h from L3/L4 molt till pupation. The first and the second vertical dashed lines indicate the small peak and the pulse of 20E, respectively, for each group. (n = 6 pools for 0 hrs, n = 4 pools for others). C Pupation time were compared between groups (n = 197 for NTC, n = 220 for starved, n = 185 for 20E). D, E Newly emerged L4 were reared in 6-well cell culture plates and treated with 80 μg/mL of 20E or 200 μg/mL of CucB for 12 h at different time periods during development of L4 (n = 128, 116, 124, 123 and 89 for NTC, 0–12 h, 12-24 h, 24–36 h and 36–48 h of 20E treatment, respectively; n = 39, 33, 40, 30 and 30 for NTC, 0–12 h, 12–24 h, 24–36 h and 36–48 h of CucB treatment, respectively.). Statistics: (A, B) One-way ANOVA with LSD multiple comparison, *P < 0.05, **P < 0.01, ***P < 0.0001 compared to 0 hrs; (C) two-tailed Student’s t-test; (D, E) one-way ANOVA with Bonferroni’s multiple comparison, bars with different letters are significantly different from each other. For (A, B, D, E) the exact p-value was provided in Source Data. Data shown are means ± SEM. Source data are provided as a Source Data file.
Fig. 4
Fig. 4. A pulse-like expression of spook induced by the threshold 20E might be crucial for determining the pupation time.
A Venn diagrams showed overlapping expression of genes induced by 20E and modulated at the attainment of threshold 20E (n = 3 biological replicates with 10 larvae/replicate for each group). Up arrows: the number of up-regulated DEGs; down-arrow: the number of down-regulated DEGs. The number beside the blue arrows in the shared part means the shared DEGs and the number beside the orange arrows in the shared part mean the shared DEGs of 30 h/0 h that were up- or down-regulated in 20E/NTC. B Representative enriched KEGG pathways of co-regulated genes from (A), with the insect hormone biosynthesis pathway highlighted in bold. C Differentially expressed genes of enriched KEGG pathway of insect hormone biosynthesis from (B). D Temporal expression of genes coding for ecdysteroidogenic enzyme after L3/L4 molt till pupation. Samples used were from Fig. 3B, except Shd which were analyzed with samples from Fig. 3A. E The expression of genes coding for ecdysteroidogenic enzyme after treatment with different concentration of 20E for 12 h after L3/L4 molt (n = 10 biological replicates with 5 larvae/replicate). F The role of 20E signaling in the expression of spook. The newly emerged L4 larvae were treated with DMSO or 200 μg/mL of CucB for the first 12 h and then treated with DMSO or 80 μg/mL of 20E for the next 12 h. The expression of spook was determined by qRT-PCR (n = 5 biological replicates with 6 larvae/replicate for Ae. albopictus, n = 6 biological replicates with 5 larvae/replicate for Ae. aegypti). G Temporal expression of spook mRNA after 20E supplementation and starvation for 12 h. Data are generated from the samples of Fig. 3B (n = 6 pools for 0 h, n = 4 pools for others; the data of NTC was the same as Spo of Fig. 4D). H Pupation time of L4 after spook RNAi. Upper: The impact of Spook RNAi on pupation time (for Ae. albopictus, n = 68 and 72 for dsGFP and dsSpook, respectively; for Ae. aegypti, n = 124 and 132 for dsGFP and dsSpook, respectively.); lower: The knockdown efficiency of Spook RNAi (n = 8 biological replicates with 3 larvae/replicate for Ae. albopictus; n = 3 biological replicates with 8 larvae/replicate for Ae. aegypti). Statistic: (E, F) one-way ANOVA with Bonferroni’s multiple comparison, bars with different letters are significantly different from each other, the exact p-value was provided in Source Data; (H) two-tailed Student’s t-test. Data shown are means ± SEM. Source data are provided as a Source Data file.
Fig. 5
Fig. 5. The higher basal 20E levels are associated with the faster larvae development in male than in female.
A Male larvae pupated earlier than female. Top: the percentage of pupae by the time. Bottom: Time difference in pupation between sexes, with the percentage indicating an increase in pupation time in female relative to male (n = 299 and 285 for male and female of Ae. aegypti-AFM, respectively; n = 87 and 76 for male and female of Ae. aegypti-Aaeg-M, respectively; n = 239 and 168 for male female of Ae. albopictus, respectively; n = 204 and 213 for male and female of Cx. quinquefasciatus, respectively; n = 73 and 85 for male and female of An. stephensi, respectively.). B Male larvae molted earlier than female at each instar. The numbers above the top of columns indicate the time female took more than male (n = 83 and 65 for male and female of L1, respectively; n = 33 and 25 for male and female of L2, respectively; n = 45 and 15 for male and female of L3, respectively; n = 164 and 157 for male and female of L4, respectively. C The difference in pupation time between sexes was a sum of variation in development time of each instar (data was deduced from Fig. 5B). D Left and right: The expression of E75A in Aaeg-M and AFM strains of Ae. aegypti was higher in male than in female at 24 hrs after L3/L4 molt (n = 8 biological replicates with 3 larvae/replicate for Aaeg-M strain; n = 31 larvae for each sex for AFM strain); middle: the ecdysteroid titer in Aaeg-M strain of Ae. aegypti was also higher in male than in female at 24 h after L3/L4 molt (n = 6 and 5 biological replicates with 3 larvae/replicate for male and female, respectively). For Aaeg-M strain, sex was determined by male-specific expression of GFP protein and for AFM strain, the sex was determined by the expression of Nix gene. E Left: The expression of E75 of Ae. albopictus was higher in male than in female at 0 (n = 8 for male; n = 7 for female), 6 (n = 7 for both sexes), and 12 h (n = 8 for male; n = 6 for female) afterL3/L4 molt; right: the ecdysteroid titer of Ae. albopictus was also higher in male than in female after normalizing with body size at 12 h after L3/L4 molt (n = 9 for male; n = 6 for female). Larvae were collected individually, and the sex was determined by the expression of Nix gene. F Determination of the timing of critical weight for Ae. albopictus male and female L4 larvae. Newly emerged L4 larvae were collected, starved at different times after L3/L4 molt. Pupation times were compared between the groups of fed and starved (n = 95, 186, 196, 195, 203, 200, 203, 203 and 197 for group of 18, 21, 24, 27, 30, 33, 36, 39 and 42 hrs after L3/L4 molt). G The profiles of ecdysteroid titers during the development of Ae. albopictus male and female L4 larvae. Larvae were collected individually, and sex was determined by the existence of Nix in head and ecdysteroid titer were assayed in carcass. Three carcasses were pooled, and 4 pools were set for each time point of each sex. The blue and purple vertical dashed lines indicate the small 20E peak for male and female, respectively. Statistics: (AF) two-tailed Student’s t-test; (G) One-way ANOVA with LSD multiple comparison, *P < 0.05, **P < 0.01, ***P < 0.001 vs 0 h, the exact p-value was provided in Source Data. Data shown are means ± SEM. Source data are provided as a Source Data file.
Fig. 6
Fig. 6. Female larvae are more sensitive to decreases in basal 20E levels during late instars.
A The developmental times of each instar were modulated by the change in 20E levels using either 20E or CucB. Newly hatched L1 and newly emerged L2 to L4 larvae were collected and treated in 6-well plate with 80 µg/ml of 20E or 200 µg/ml of CucB for 12 hrs, and then reared under normal condition (n = 118, 89 and 117 for DMSO, 20E and CucB group of L1, respectively; n = 74, 101 and 88 for DMSO, 20E and CucB group of L2, respectively; n = 130, 136 and 138 for DMSO, 20E and CucB group of L3, respectively; n = 109, 73 and 62 for DMSO, 20E and CucB group of L4 male, respectively; n = 95, 19 and 69 for DMSO, 20E and CucB group of L4 female, respectively). BE The impact of CucB supplementation during early development of each instar on pupation time of Ae. aegypti. Newly hatched L1 and newly emerged L2 to L4 were collected and treated with 200 µg/ml (L1 and L2) or 400 µg/ml (L3 and L4) of CucB for 12 h and then reared under normal condition. For B, n = 62 and 51 for NTC and CucB male, respectively; n = 43 and 38 for NTC and CucB female, respectively. For C, n = 66 and 54 for NTC and CucB male, respectively; n = 70 and 54 for NTC and CucB female, respectively. For D, n = 45 and 34 for NTC and CucB male, respectively; n = 82 and 74 for NTC and CucB female, respectively. For E, n = 65 and 62 for NTC and CucB male, respectively; n = 77 and 70 for NTC and CucB female, respectively. F The impact of CucB supplementation during early development of Ae. albopictus L4 on pupation time. Newly emerged L4 were collected and treated with 400 µg/ml of CucB as above. n = 246 and 231 for NTC and CucB male, respectively; n = 283 and 270 for NTC and CucB female, respectively. Left: Percent of pupae by the time. Right: Difference in pupation time between different treatment and sexes, with the percentage mean percent of increase in pupation time in treatment relative to control. The pupation time was the period from the time point of larval collection to pupation. G, H The impact of Spook RNAi during early development of L4 on sex difference in pupation time of Ae. aegypti (G) and Ae. albopictus (H), data were retrieved from Fig. 4H. Statistics: (A) two-tailed Student’s t-test; (BH) generalized linear model (GLM) analysis. Data shown are means ± SEM. Source data are provided as a Source Data file.
Fig. 7
Fig. 7. Supplementation of 20E induces female-specific lethality.
A The impact of 20E treatment on larval survival to adults. Larvae were treated with 120 µg/mL 20E for 12 h at different time after ecdysis to L3 (Left) and at different time after ecdysis to L4. Groups of 21 larvae for L4 and 25 larvae for L3 were treated and reared in 6-well plate. Two biological replicates were conducted for each instar. B The models of 20E-induced female lethality and different development dynamics during L3/L4 molt between sexes. Left: 20E treatment near the time of L3/L4 molt and for newly emerged L4 is lethal, and 20E treatment from 12 h after L3/L4 molt and before the threshold 20E level for CW could significantly accelerate larval development. Right: There is sexual dimorphism in larval development time and male develops faster than female. The number of percent means percent of L3 that have already molted into L4. C The impact of 20E supplementation at different percent of L3/L4 molt on male ratio (the numbers inside the column mean the number of adults by sex). The impact of 20E supplementation at 50% of L3/L4 molt on male adult ratios (D) and pupation dynamics (E). Larvae were treated with 120 µg/mL 20E at 50% of ecdysis to L4 (D and E). The numbers above the column mean the number of adults by sex (blue: male; purple: female). NTC, larvae reared under normal condition; DMSO, larvae treated only with DMSO, the solvent of 20E. Statistic: (A, C, D) two-sided Chi-square test. Source data are provided as a Source Data file.

Similar articles

References

    1. Guirado, J., Carranza-Valencia, J. & Morante, J. Mammalian puberty: a fly perspective. FEBS J.290, 359–369 (2023). - PMC - PubMed
    1. Tennessen, J. M. & Thummel, C. S. Coordinating growth and maturation - insights from Drosophila. Curr. Biol.: CB21, R750–R757 (2011). - PMC - PubMed
    1. Danielsen, E. T., Moeller, M. E. & Rewitz, K. F. Nutrient signaling and developmental timing of maturation. Curr. Top. Dev. Biol.105, 37–67 (2013). - PubMed
    1. Buhler, K. et al. Growth control through regulation of insulin signalling by nutrition-activated steroid hormone in Drosophila. Development145, dev165654 (2018). - PubMed
    1. Tran, H. T. et al. Makorin 1 Regulates Developmental Timing in Drosophila. Mol. Cells41, 1024–1032 (2018). - PMC - PubMed

LinkOut - more resources