

Hypoxia and lipid metabolism related genes drive proliferation migration and immune infiltration mechanisms in colorectal cancer subtyping
- PMID: 39827204
- PMCID: PMC11742731
- DOI: 10.1038/s41598-025-85809-2
Hypoxia and lipid metabolism related genes drive proliferation migration and immune infiltration mechanisms in colorectal cancer subtyping
Abstract
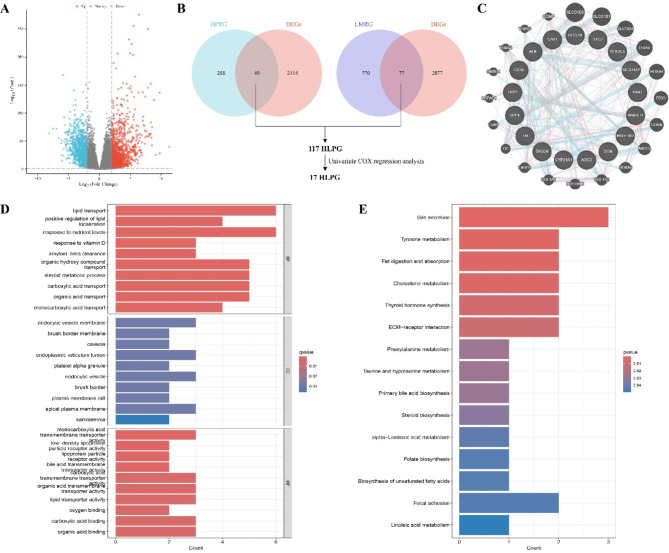
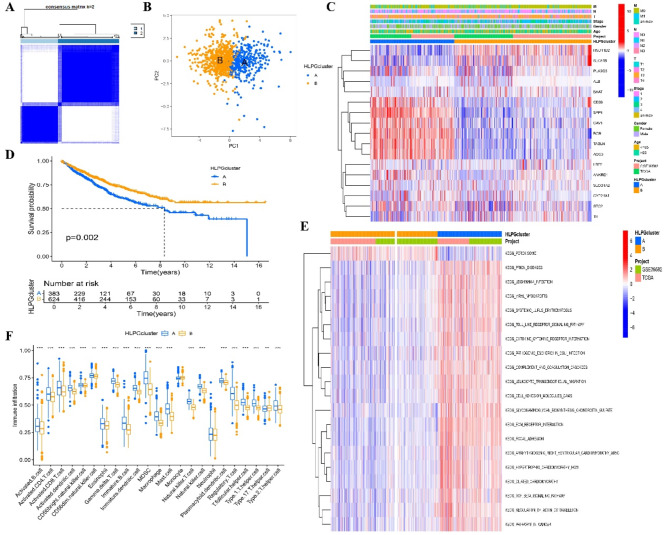
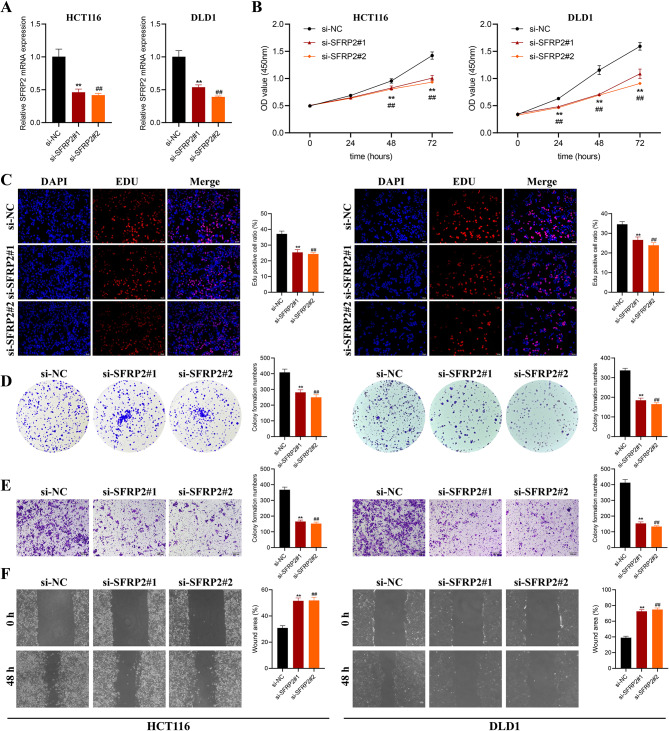
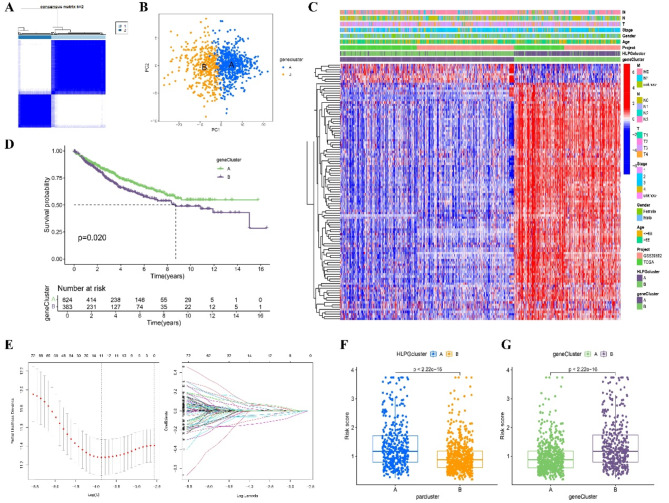
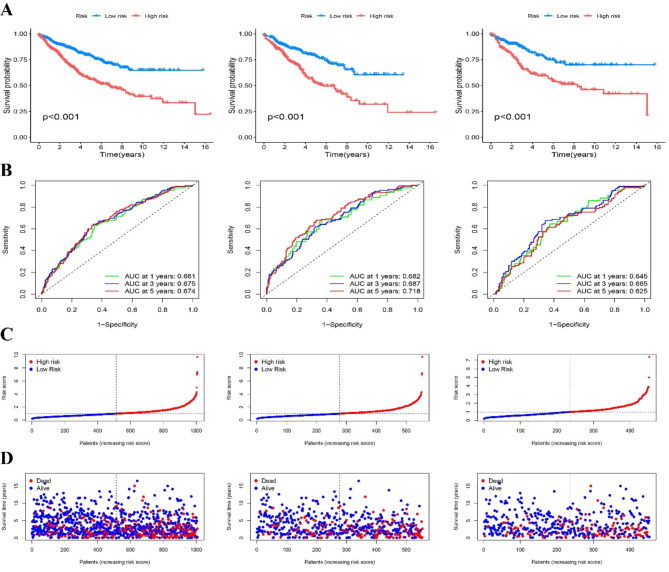
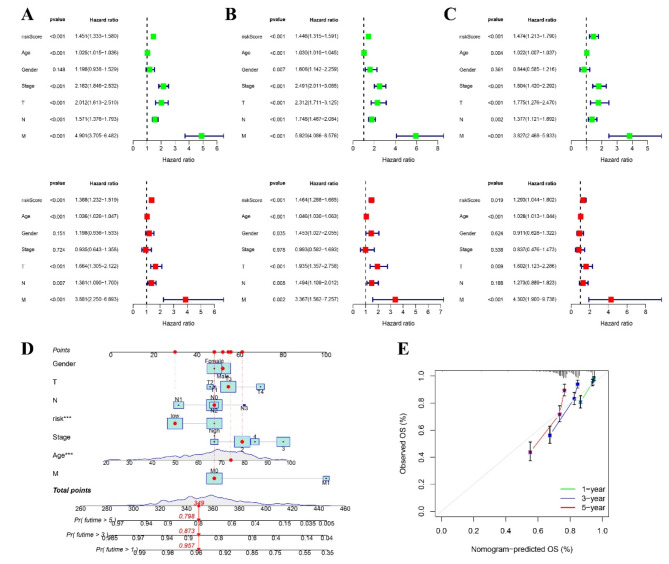
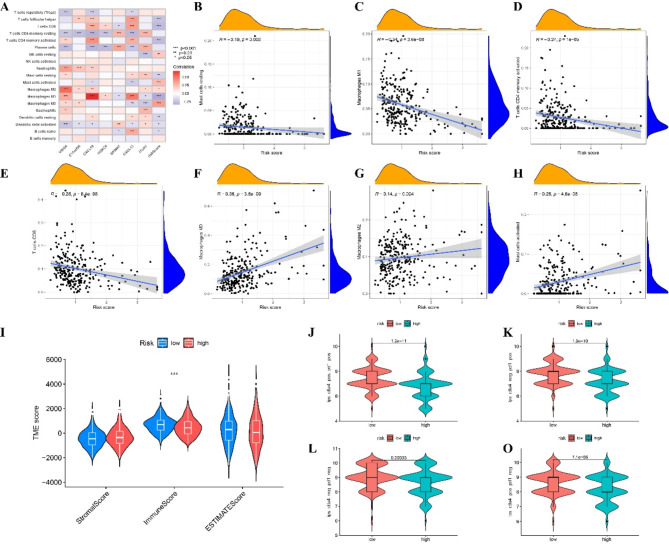
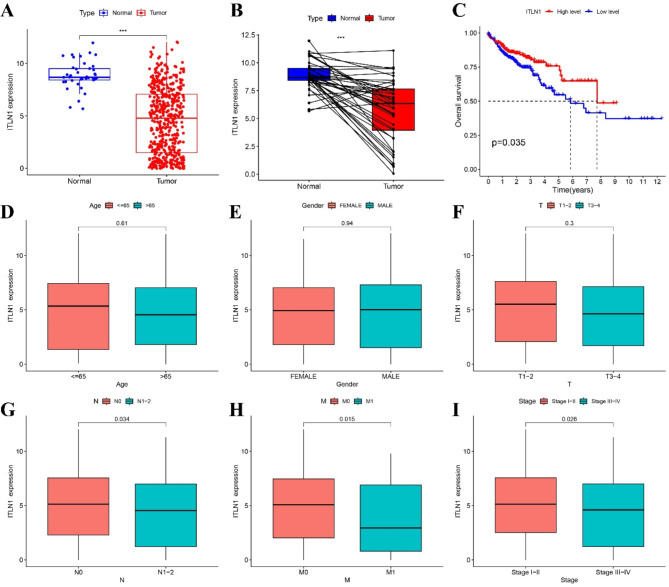
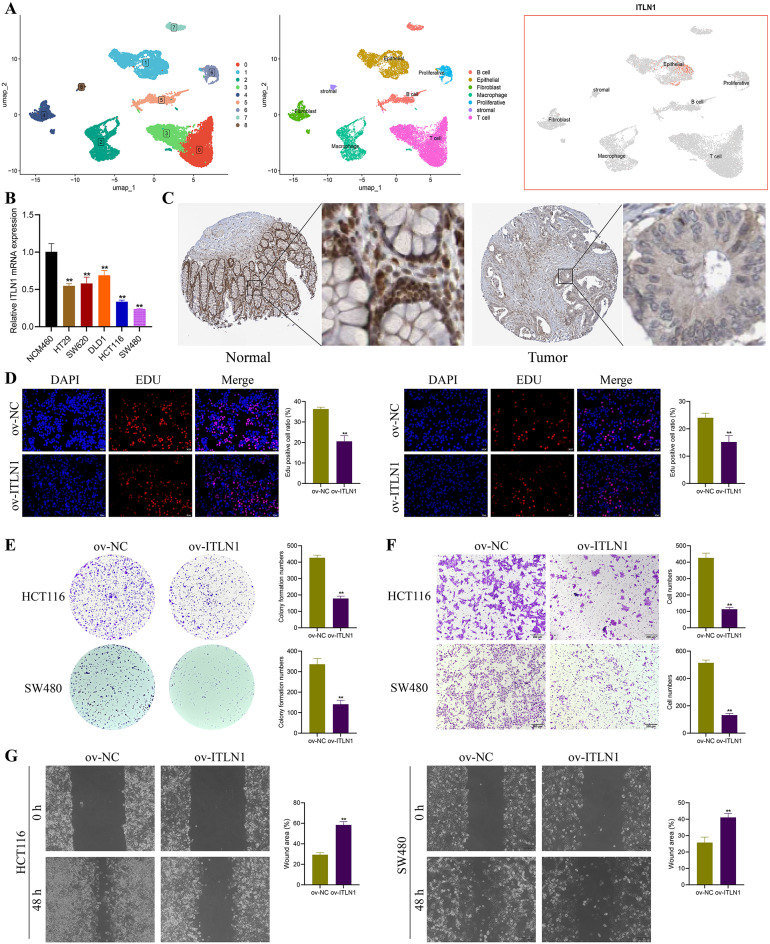
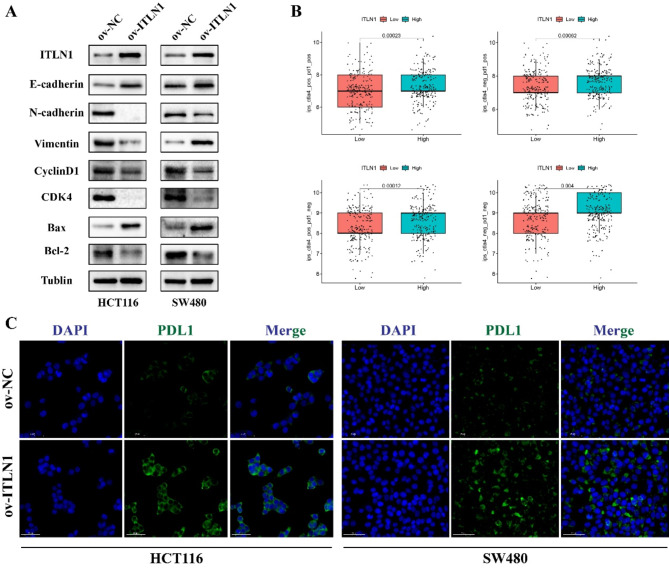
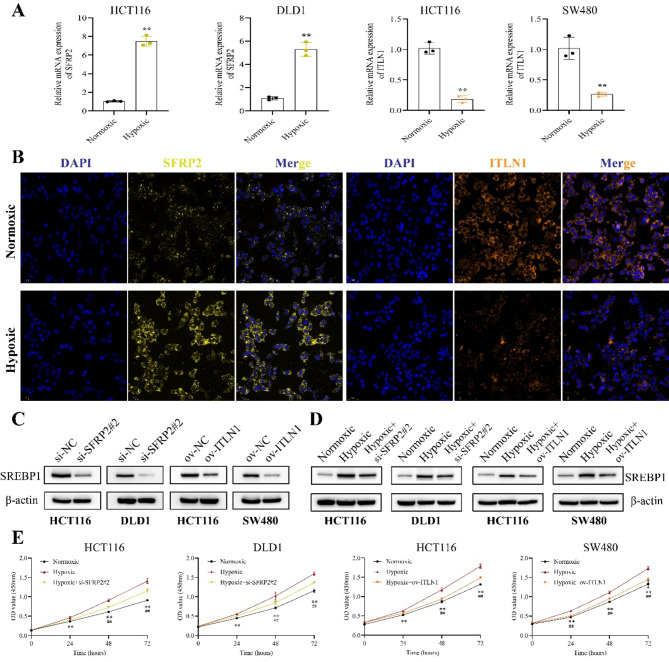
Hypoxia and lipid metabolism play crucial roles in the progression of colorectal cancer (CRC). However, the specific functions of hypoxia- and lipid metabolism-related genes (HLPG) in CRC and their relationships with patient prognosis remain unclear. Differential expression analysis using the TCGA-COAD and GEO databases identified 117 HLPGs through the intersection of the two gene sets. After univariate Cox regression analysis, 17 prognostically relevant HLPG were identified. Consensus clustering classified CRC samples into two subtypes, and the immune microenvironment differences between them were evaluated. A risk scoring model utilizing seven prognostically significant HLPGs was created and its predictive performance was assessed through survival analysis and ROC curves. Finally, the key genes ITLN1 and SFRP2 were functionally validated in CRC cell lines. HLPG was closely linked to CRC prognosis. Two molecular subtypes were identified: Cluster A, characterized by enriched immune pathways and higher immune infiltration, and Cluster B, associated with improved overall survival. The seven HLPG-based risk scoring model effectively stratified patients into high- and low-risk groups, with high-risk patients exhibiting significantly poorer survival outcomes. Functional studies confirmed that SFRP2 and ITLN1 play essential roles in CRC cell proliferation, migration, and epithelial-mesenchymal transition (EMT). Furthermore, ITLN1 upregulated PD-L1 expression, increasing sensitivity to immunotherapy. Hypoxia was found to promote lipid metabolic alterations by modulating SFRP2 and ITLN1 expression. This study highlights the prognostic significance of HLPGs in CRC and introduces a robust risk scoring model for patient outcome prediction. ITLN1 could be a target for enhancing immunotherapy response in CRC.
Keywords: Colorectal cancer; Hypoxia; ITLN1; Immune microenvironment; Lipid metabolism; Prognostic model; SFRP2.
© 2025. The Author(s).
Conflict of interest statement
Declarations. Competing interests: The authors declare no competing interests.
Figures
Similar articles
-
Novel hypoxia- and lactate metabolism-related molecular subtyping and prognostic signature for colorectal cancer.J Transl Med. 2024 Jun 20;22(1):587. doi: 10.1186/s12967-024-05391-5. J Transl Med. 2024. PMID: 38902737 Free PMC article.
-
Hypoxia Promotes Malignant Progression of Colorectal Cancer by Inducing POSTN+ Cancer-Associated Fibroblast Formation.Mol Carcinog. 2025 Apr;64(4):716-732. doi: 10.1002/mc.23882. Epub 2025 Jan 21. Mol Carcinog. 2025. PMID: 39835715
-
Novel prognostic alternative splicing events in colorectal Cancer: Impact on immune infiltration and therapy response.Int Immunopharmacol. 2024 Sep 30;139:112603. doi: 10.1016/j.intimp.2024.112603. Epub 2024 Jul 22. Int Immunopharmacol. 2024. PMID: 39043103
-
Development of a novel hypoxia-immune-related LncRNA risk signature for predicting the prognosis and immunotherapy response of colorectal cancer.Front Immunol. 2022 Sep 14;13:951455. doi: 10.3389/fimmu.2022.951455. eCollection 2022. Front Immunol. 2022. PMID: 36189298 Free PMC article.
-
Hypoxia reconstructed colorectal tumor microenvironment weakening anti-tumor immunity: construction of a new prognosis predicting model through transcriptome analysis.Front Immunol. 2024 Dec 6;15:1425687. doi: 10.3389/fimmu.2024.1425687. eCollection 2024. Front Immunol. 2024. PMID: 39712012 Free PMC article.
Cited by
-
LncRNAs in hypoxic microenvironment; insight in their impact in cancer biology.Funct Integr Genomics. 2025 Jul 2;25(1):142. doi: 10.1007/s10142-025-01635-9. Funct Integr Genomics. 2025. PMID: 40601072 Review.
References
-
- Sung, H. et al. Global Cancer statistics 2020: GLOBOCAN estimates of incidence and Mortality Worldwide for 36 cancers in 185 countries. CA Cancer J. Clin.71 (3), 209–249 (2021). - PubMed
-
- Ye, L. C. et al. Randomized controlled trial of cetuximab plus chemotherapy for patients with KRAS wild-type unresectable colorectal liver-limited metastases. J. Clin. Oncol.31 (16), 1931–1938 (2013). - PubMed
-
- Cheng, B. et al. Recent progress in the development of hypoxia-inducible factor 2α (HIF-2α) modulators: inhibitors, agonists, and degraders (2009–2024). Eur. J. Med. Chem.275, 116645 (2024). - PubMed
Publication types
MeSH terms
Substances
LinkOut - more resources
Full Text Sources
Medical
Research Materials
