. 2025 Jan 18;16(1):813.
doi: 10.1038/s41467-025-56099-z.

α-Synuclein fibrils enhance HIV-1 infection of human T cells, macrophages and microglia

Affiliations

α-Synuclein fibrils enhance HIV-1 infection of human T cells, macrophages and microglia

Lia-Raluca Olari et al. Nat Commun. .

Abstract

HIV-associated neurocognitive disorders (HAND) and viral reservoirs in the brain remain a significant challenge. Despite their importance, the mechanisms allowing HIV-1 entry and replication in the central nervous system (CNS) are poorly understood. Here, we show that α-synuclein and (to a lesser extent) Aβ fibrils associated with neurological diseases enhance HIV-1 entry and replication in human T cells, macrophages, and microglia. Additionally, an HIV-1 Env-derived amyloidogenic peptide accelerated amyloid formation by α-synuclein and Aβ peptides. Mechanistic studies show that α-synuclein and Aβ fibrils interact with HIV-1 particles and promote virion attachment and fusion with target cells. Despite an overall negative surface charge, these fibrils facilitate interactions between viral and cellular membranes. The enhancing effects of human brain extracts on HIV-1 infection correlated with their binding to Thioflavin T, a dye commonly used to stain amyloids. Our results suggest a detrimental interplay between HIV-1 and brain amyloids that may contribute to the development of neurodegenerative diseases.


Conflict of interest statement

Competing interests: DRT collaborated with Novartis Pharma AG (Basel, Switzerland), Probiodrug (Halle (Saale), Germany), GE Healthcare (Amersham, UK), and Janssen Pharmaceutical Companies (Beerse, Belgium). JM and FK are inventors on patents for using peptide nanofibrils to enhance viral transduction. Remaining authors report no competing interests.

Figures

Fig. 1
Fig. 1. Aβ40 and α-synuclein form amyloid fibrils showing a negative zeta potential.
a Table summarizing features of Aβ40, α-synuclein (α-Syn), and EF-C including the amino acid sequence analysis, zeta potential, and isoelectric point (pI) as calculated with the ProtParam tool. Highlight hydrophilic amino acids blue and hydrophobic amino acids red. b Monomeric and fibrillar peptides and proteins were incubated with Thioflavin T and fluorescence intensity was measured (arbitrary units, AU). Shown is the mean of three independent experiments measured in duplicates ± SEM. Source data are provided in the Source Data file. c TEM images of fibrils. Samples were prepared by negative staining with 2% uranyl acetate in water on copper grids and imaged with a Jeol TEM 1400. Scale bars indicate 1 µm. Shown are representative images derived from one experiment out of three performed. d Zeta potential of fibrils diluted in ddH2O. Samples were analyzed by nanoparticle tracking analysis. Shown are the means of three independent experiments each performed in duplicates ± SEM. Significant differences were determined using two-sided unpaired t-test analysis. Asterisks indicate statistical significance and exact P values in (b) were ***P < 0.0001 and **P = 0.0068.
Fig. 2
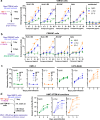
Fig. 2. Aβ40, α-synuclein, and EF-C fibrils enhance HIV-1 Infection.
a, b Aβ40, α-synuclein (α-Syn), and EF-C fibrils were pre-incubated with different HIV-1 strains and added to (a) TZM-bl and (b) CEM-M7 cells. Infection was quantified three days post-infection by detecting the expression of β-galactosidase in the TZM-bl cells or quantifying the GFP + CEM-M7 cells by flow cytometry. Values were corrected for the background signal derived from the uninfected cells, and infection efficiencies are provided as n-fold changes relative to those observed in the absence of fibrils (1×). c Aβ40, α-synuclein, and EF-C fibrils were pre-incubated with a Gaussia luciferase HIV-1 reporter virus and added to HMC-3 (left) or U373-MAGI cells (right). d In trans-infection of TZM-bl by fibril-virus mixtures preincubated with HMC-3 cells for 4 h, followed by extensive PBS washing, and the addition of TZM-bl cells. Virus replication was measured by testing the Gaussia luciferase activity (relative light units per second, RLU/s) in supernatants harvested at the indicated time points. In all cases, the compound concentration during virion pre-incubation is indicated. Shown is the mean of three independent experiments measured in triplicates ± SEM. Significant differences were determined using two-sided unpaired t-test analysis. Asterisks indicate statistical significance (*P < 0.05, **P < 0.01, ***P < 0.001). Source data are provided as a Source Data file.
Fig. 3
Fig. 3. Aβ40, α-synuclein, and EF-C fibrils enhance HIV-1 infection and replication in primary cells.
Aβ40, α-synuclein (α-Syn), and EF-C fibrils at indicated concentrations were pre-incubated with different HIV-1 strains (or cell medium as control) and added to (a) CD4+ T cells, PBMC-derived (b) macrophages and (c) microglia. One day post-infection, cells were extensively washed in PBS to remove the input virus. Supernatants were harvested at the indicated time points and added to the TZM-bl reporter cell line. Infection was quantified three days post-infection by detecting the expression of β-galactosidase (relative light units per second, RLU/s). Dashed lines indicate the background signal derived from the uninfected cells. Shown is the mean of three independent experiments using cells derived from different donors, measured in triplicates ± SEM. Significant differences were determined using two-sided unpaired t-test analysis. Asterisks indicate statistical significance (*P < 0.05, **P < 0.01, ***P < 0.001). Source data are provided as a Source Data file.
Fig. 4
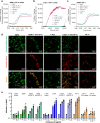
Fig. 4. Aβ40 and α-synuclein fibrils enhance HIV-1 fusion in PBMC-derived macrophages and microglia.
a Schematic of HIV-1 BlaM-Vpr fusion assay. HIV-1 AD8 proviral DNA and pCMV-BlaM-Vpr expression vector were cotransfected into HEK293T cells to generate HIV-1 BlaM-Vpr virions. These virions were used to infect target cells in the presence or absence of fibrils. Fusion with target cells was monitored by a fluorescence shift from green (520 nm) to blue (447 nm) upon cleavage of the CCF2 substrate by BlaM-Vpr, indicating viral entry. b Macrophages and microglia cells were mock-infected or infected with HIV-1 virions containing BlaM-Vpr with or without being mixed 1:1 with final 50 µg/mL concentration (final concentration on virus) Aβ40 (Aβ), α-synuclein (αSyn), and EF-C fibrils. Cells were loaded with CCF2 dye and analyzed by fluorescence microscopy. The images correspond to the 530 and 460 nm emission after a fluorophore excitation at 405 nm. Scale bars indicate 100 µm. Images were taken with a Leica D8i confocal microscope (Leica). c Quantification of the mean fluorescence of the 460 nm channel in macrophages and microglia cells. Data represent the average fluorescence from five different images per condition. Shown is one representative experiment. Highly similar results were obtained in two additional independent experiments. ‘Source data are provided as a Source Data file. Significant differences were determined using one-way ANOVA with Dunnett´s multiple comparison test. Asterisks indicate statistical significance (*P = 0.0396, ***P < 0.0001).
Fig. 5
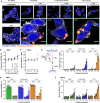
Fig. 5. Aβ40/42 and α-synuclein fibrils enhance HIV infection and attach retroviral particles to the target cells.
a Fluorescence microscopy images showing Aβ40, α-synuclein, and EF-C fibrils that were stained with Amytracker 540 dye (red) and CFP labeled HIV (yellow) in the absence and presence of cells stained with the cytoskeleton dye (CellTrace) (blue) and actin dye (ATTO-phalloidin) (white). Scale bars are 50 µm for the full images and 10 µm for the insets. Images were taken with an LSM 710 confocal microscope (Zeiss). Shown are representative images derived from one experiment. b–d Aβ40, α-synuclein (α-Syn), and EF-C fibrils were pre-incubated with (b) ZIKV or (c) HSV-2 and added to (c) Vero E6 or (d) ELVIS cells. Infection was quantified three days post-infection via ZIKV ELISA or one day post-infection by detecting the expression of β-galactosidase (relative light units per second, RLU/s) in the ELVIS cells. HIV-1, ZIKV or HSV-2 were incubated with the indicated concentrations of Aβ40, α-synuclein, and EF-C fibrils. The supernatant and pellet were separated by centrifugation and the pellet was resuspended in fresh medium. Samples were added to (d) TZM-bl cells, (e) Vero E6 cells, or (f) ELVIS cells. The infection was quantified one (f), two (e), or three (d) days post-infection by (d, f) detecting the expression of β-galactosidase (relative light units per second, RLU/s) or (e) via ZIKV ELISA. Values were corrected for the background signal derived from the uninfected cells. Shown is the mean of three independent experiments measured in triplicates ± SEM. Significant differences were determined using two-sided unpaired t-test analysis and two-way ANOVA with Dunnett´s multiple comparison test. Asterisks indicate statistical significance (*P < 0.05, **P < 0.01, ***P < 0.001). Source data are provided as a Source Data file.
Fig. 6
Fig. 6. Aβ40 and α-synuclein fibrils are cross-seeded by HIV-1 Env-derived EF-C peptide.
Aggregation kinetics of (a) Aβ40 and (b) α-synuclein (α-Syn) cross-seeded with indicated amounts of EF-C seeds, or (c) Aβ40 cross-seeded with indicated amounts of sucrose-purified HIV-1 incubated with Thioflavin T (arbitrary units, AU) under agitation at 37 °C. Shown is the mean of one experiment measured in quadruplicates. d Confocal microscopy analysis of ATTO495-labeled Aβ40 and α-synuclein (α-Syn) fibrils cross-seeded with 10% ATTO647N EF-C. Scale bars indicate 20 µm. Images taken with a Leica D8i confocal microscope (Leica). Shown are representative images derived from one experiment. e Indicated pre-formed fibrils, seeds, monomers (mono) were pre-incubated with HIV-1 NL4-3 R5 tropic virus and added to TZM-bl cells. Infection was quantified three days post-infection by detecting the expression of β-galactosidase. Values were corrected for the background signal derived from the uninfected cells, and infection efficiencies are provided as n-fold changes relative to those observed in the absence of peptide (1×). The compound concentration during virion pre-incubation is indicated. Shown is the mean of three independent experiments measured in triplicates ± SEM. Significant differences were determined using two-sided unpaired t-test analysis. Asterisks indicate statistical significance (*P < 0.05, **P < 0.01, ***P < 0.001). Source data are provided as a Source Data file.
Fig. 7
Fig. 7. α-synuclein enhances HIV-1 infection.
Cell supernatants containing α-synuclein oligomers were generated upon transfection of H4 cells with indicated α-synuclein constructs containing a split Gaussia luciferase construct, or with an empty vector as a control. Oligomer presence was quantified by Gaussia luciferase activity. α-synuclein was depleted in the supernatant of wild-type (WT) transfected H4 cells using magnetic protein G beads and SYN-1 antibody as described in the method section. Supernatants were diluted in PBS, and pre-incubated with HIV-1 AD8, and added to TZM-bl cells. Infection was quantified three days post-infection by detecting the expression of β-galactosidase in the TZM-bl cells. Values were corrected for the background signal derived from the uninfected cells, and infection efficiencies are provided as n-fold changes relative to those observed in the absence of peptide (1×). Shown is the mean of three independent experiments measured in triplicates ± SEM. Significant differences were determined using two-way ANOVA with Dunnett´s multiple comparison test. Asterisks indicate statistical significance (*P < 0.05, **P < 0.01, ***P < 0.001). Exact P-values are: 0.0391; 0.0206, 0.0015; <0,0001; 0.0122; 0.0017 and 0.0112 (from left to right). Source data are provided as a Source Data file.
Fig. 8
Fig. 8. Enhancement of HIV-1 infection by human brain lysates correlates with Thioflavin T binding.
a Quantification of the amyloid content of the soluble fraction of human brain lysates derived from Alzheimer’s disease (AD), Lewy body disease (LBD) patients or individuals without documented neurological symptoms (Hc, healthy controls) by Thioflavin T staining and measurement of the fluorescence intensity. b, d The indicated concentrations of human brain lysates were pre-incubated with (b) HIV-1 NL4-3 R5 tropic or (d) cell medium and added to TZM-bl cells. Infection was quantified three days post-infection by detecting the expression of β-galactosidase (relative light units per second, RLU/s) in the TZM-bl cells. Shown is the mean of (b) one experiment measured in triplicates ± SD, or (d) three independent experiments measured in triplicates ± SEM. c Linear regression between the HIV-1 enhancing effect of 10% extract (v/v) on virus and the fluorescence intensity of the samples at 482 nm in the Thioflavin T assay. R2 is the coefficient of determination. Color coding corresponds to that used in panel (c). Significant differences were determined using two-way ANOVA with Dunnett´s multiple comparison test. Asterisks indicate statistical significance (*P < 0.05, **P < 0.01, ***P < 0.001). Source data are provided as a Source Data file.

References

    1. Nussbaum, R. L. & Ellis, C. E. Alzheimer’s disease and Parkinson’s disease. N. Engl. J. Med. 348, 1356–1364 (2003). - PubMed
    1. Hardy, J., Duff, K., Hardy, K. G., Perez-Tur, J. & Hutton, M. Genetic dissection of Alzheimer’s disease and related dementias: amyloid and its relationship to tau. Nat. Neurosci.1, 355–358 (1998). - PubMed
    1. Irwin, D. J., Lee, V. M.-Y. & Trojanowski, J. Q. Parkinson’s disease dementia: convergence of α-synuclein, tau and amyloid-β pathologies. Nat. Rev. Neurosci.14, 626–636 (2013). - PMC - PubMed
    1. Ross, C. A. & Poirier, M. A. Protein aggregation and neurodegenerative disease. Nat. Med.10, S10–S17 (2004). - PubMed
    1. Balistreri, A., Goetzler, E. & Chapman, M. Functional amyloids are the rule rather than the exception in cellular biology. Microorganisms8, 1951 (2020). - PMC - PubMed

LinkOut - more resources