

Age- and sex-adjusted CT-based reference values for temporal muscle thickness, cross-sectional area and radiodensity
- PMID: 39827306
- PMCID: PMC11742987
- DOI: 10.1038/s41598-025-86711-7
Age- and sex-adjusted CT-based reference values for temporal muscle thickness, cross-sectional area and radiodensity
Abstract
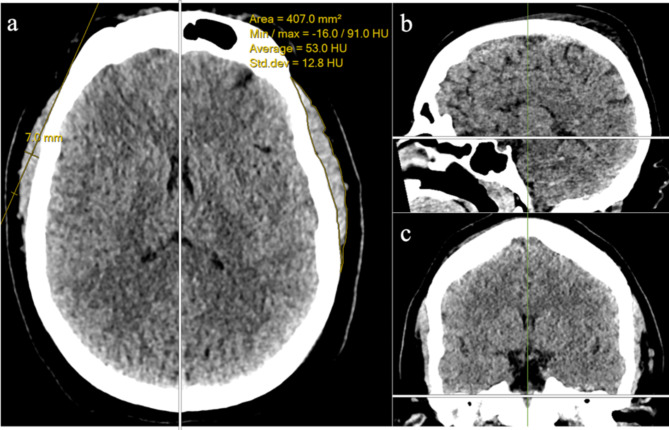
Muscle mass has been traditionally assessed by measuring paraspinal muscle areas at the level of the third lumbar vertebra on computed tomography (CT). Neurological or neurosurgical patients seldom undergo CT scans of the lumbar region. Instead, temporal muscle thickness (TMT), cross-sectional area (TMA) and radiodensity measured from head CT scans are readily available measures of muscle mass and quality in these patient cohorts. The purpose of this retrospective study was to establish CT-based reference values for TMT, TMA and radiodensity for each decade of age from 0 to 100 years normalized by age and sex, and to define cut-off values for subjects at risk for sarcopenia as defined by the European Working Group on Sarcopenia in Older People (EWGSOP). Subjects diagnosed with a concussion at the Oulu University Hospital between January 2014 and December 2022 (n = 9254) were identified to obtain a reference population. Subjects with significant pre-existing co-morbidities were excluded. TMT, TMA and radiodensity were measured, measurement reliability was quantified, and sex-adjusted reference values were calculated for each age decade. Quantile regression was used to model age-related changes in muscle morphomics. A total of 500 subjects [250 (50.0%) males] with a mean age of 49.2 ± 27.9 years were evaluated. Inter- and intra-observer reliability was almost perfect for TMT and TMA, and substantial-to-almost perfect for radiodensity. The mean TMT, TMA and radiodensity were 5.2 ± 1.9 mm, 284 ± 159 mm2 and 44.6 ± 17.7HU, respectively. The cut-off values for reduced TMT, TMA and radiodensity for males/females using the European Working Group on Sarcopenia in Older People compliant criteria were ≤ 4.09 mm/≤3.44 mm, ≤ 166 mm2/≤156 mm2, and ≤ 35.5HU/≤35.2HU, respectively. We described a standardized CT-based TMT and TMA measurement protocol practical for clinical use with almost perfect reliability. Using the protocol, we produced quantile regression models for the detection of reduced TMT, TMA and radiodensity at the lowest 5th, 10th, 20th, 30th, 40th and 50th percentiles as well as the EWGSOP compliant criteria cut-off values for reduced muscle mass to facilitate generalizable radiological sarcopenia research.
Keywords: Aging; Computed tomography; Nutrition; Reference values; Sarcopenia; Temporal muscle area; Temporal muscle thickness.
© 2025. The Author(s).
Conflict of interest statement
Declarations. Competing interests: The authors declare no competing interests. Ethical approval: The study was conducted in compliance with the 1964 Declaration of Helsinki and its later amendments, and the study protocol was approved by the Institutional Review Board of the Oulu University Hospital.
Figures


Similar articles
-
Reliability and validity of measuring temporal muscle thickness as the evaluation of sarcopenia risk and the relationship with functional outcome in older patients with acute stroke.Clin Neurol Neurosurg. 2021 Feb;201:106444. doi: 10.1016/j.clineuro.2020.106444. Epub 2021 Jan 1. Clin Neurol Neurosurg. 2021. PMID: 33395619
-
Relative muscle indices and healthy reference values for sarcopenia assessment using T10 through L5 computed tomography skeletal muscle area.Sci Rep. 2024 Sep 18;14(1):21799. doi: 10.1038/s41598-024-71613-x. Sci Rep. 2024. PMID: 39294201 Free PMC article.
-
The possible relation between temporal muscle mass and glioblastoma multiforme prognosis via sarcopenia perspective.Turk J Med Sci. 2023 Feb;53(1):413-419. doi: 10.55730/1300-0144.5599. Epub 2023 Feb 22. Turk J Med Sci. 2023. PMID: 36945944 Free PMC article.
-
The use of alternate vertebral levels to L3 in computed tomography scans for skeletal muscle mass evaluation and sarcopenia assessment in patients with cancer: a systematic review.Br J Nutr. 2022 Mar 14;127(5):722-735. doi: 10.1017/S0007114521001446. Epub 2021 Apr 29. Br J Nutr. 2022. PMID: 33910664
-
Folic acid supplementation and malaria susceptibility and severity among people taking antifolate antimalarial drugs in endemic areas.Cochrane Database Syst Rev. 2022 Feb 1;2(2022):CD014217. doi: 10.1002/14651858.CD014217. Cochrane Database Syst Rev. 2022. PMID: 36321557 Free PMC article.
Cited by
-
Value of temporal muscle thickness in predicting outcomes of stroke: a systematic review and meta-analysis.Front Neurol. 2025 Aug 7;16:1639425. doi: 10.3389/fneur.2025.1639425. eCollection 2025. Front Neurol. 2025. PMID: 40852529 Free PMC article.
-
Temporal muscle thickness predicts change in nutritional markers in individuals at risk of dementia: Insights from a 24-week longitudinal study.JAR Life. 2025 Aug 8;14:100023. doi: 10.1016/j.jarlif.2025.100023. eCollection 2025. JAR Life. 2025. PMID: 40821925 Free PMC article.
References
-
- Tolonen, A. et al. Methodology, clinical applications, and future directions of body composition analysis using computed tomography (CT) images: a review. Eur. J. Radiol.14510.1016/J.EJRAD.2021.109943 (2021). - PubMed
Publication types
MeSH terms
LinkOut - more resources
Full Text Sources
Medical
