. 2025 Mar;14(7):e2403607.
doi: 10.1002/adhm.202403607. Epub 2025 Jan 19.

Liquid Crystalline Networks Hamper the Malignancy of Cancer Cells

Affiliations

Liquid Crystalline Networks Hamper the Malignancy of Cancer Cells

Daniele Martella et al. Adv Healthc Mater. 2025 Mar.

Abstract

Mimicking compositions and structures of extracellular matrix is widely studied to create in vitro tumor models, to deepen the understanding of the pathogenesis of the different types of cancer, and to identify new therapies. On the other hand, the use of synthetic materials to modulate cancer cell biology and, possibly, to reduce the malignancy of cancer cells through their exploitation is far less explored. Here, the study evaluates the effects of Liquid Crystalline Networks (LCNs) based scaffolds on the growth of A375 metastatic melanoma cells. Interestingly, cells grown on such materials show reduced cell proliferation and colony-forming capacity with respect to those cultivated on standard plates. These effects are associated with a higher percentage of senescent cells and a shift to a more epithelial phenotype, pointing to the occurrence of a mesenchymal to epithelial transition. All these biological outcomes are affected by the amount of crosslinker in the material and have been induced only thanks to the interactions with the polymeric substrate without the need of further chemical (e.g., specific growth factor) or physical (e.g., irradiation) stimuli, opening to the possible development of anti-cancer coatings.

Keywords: A375 melanoma cells; cancer; cellular senescence; liquid crystalline networks; photopolymerizations; polymeric cell scaffolds; tumor aggressiveness.


Conflict of interest statement

The authors declare no conflict of interest.

Figures

Figure 1
Figure 1
Scaffold preparation and characterization. A) Composition of the monomer mixture and main steps of the film fabrication. The mixture was infiltered in a polymerization cell where the monomers were able to self‐assemble in a homogeneous planar monodomain that is stabilized by UV photopolymerization. B) Optical image of the final free‐standing polymeric thin films with good transparency. C) Comparison of ATR‐IR spectra of a monomeric mixture and a final polymerized material (shown for LCN40). D) Representative engineering stress‐strain curves of LCNs. Young's modulus of the different formulations is shown in the inset.
Figure 2
Figure 2
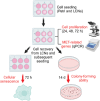
Scheme of the biological experiments performed. Cells were plated in 6‐well multiwell or LCNs and maintained in culture for 72 hours. Pictures were taken after the indicated times to evaluate cell proliferation. Alternatively, cells were lysed and mRNA extracted to perform qPCR to quantify the expression levels of EMT‐related genes. In other experiments, cells were detached from the control plates or the LCNs after 72 hours and then plated on plastics to perform cellular senescence assays after 72 additional hours, or colony forming ability assays after 14 days. Created in BioRender. Tubita, A. (2023) BioRender.com/c00i536.
Figure 3
Figure 3
LCN scaffolds markedly reduce the proliferation and colony‐forming ability of A375 melanoma cells. A) A375 melanoma cells were seeded on LCNs scaffolds and on standard plates used as control (CON). Pictures were taken using a microscope with a 10X objective after 24, 48, and 72 hours and the cell number was evaluated using the ImageJ software from 4 random pictures/samples. The data reported represent averages ± SD from five independent experiments. Representative pictures from 72‐hour samples are included. *p ≤ 0.05,  **p ≤ 0.01, and ****p ≤ 0.0001 as determined by Student's t test. ns, not significant. B) Cells treated as above described for 72 hours were detached from LCNs and standard plates (CON), seeded at low density and allowed to grow for 14 days. Values are means ± SD of data from four independent experiments. *p ≤ 0.05 and **p ≤ 0.01 as determined by Student's t test. ns, not significant. Representative images from each condition are shown.
Figure 4
Figure 4
LCN scaffolds increase SA‐βGal positivity in A375 melanoma cells. Cells were seeded on LCNs at different crosslinker percentages and on standard plates (CON, control). After 72 hours, cells were detached and seeded on culture plates for an additional 72 hours. Treatment with 200 µm H2O2 during the first 2 hours was used as a positive control for SA‐βGalactosidase assay. The percentage of SA‐βGal–positive cells with respect to the total number of cells was calculated from six different 20X magnified fields from four independent experiments using ImageJ software. Values are means ± SD. *p ≤ 0.05, **p ≤ 0.01 versus control (CON) as determined by Student's t test. ns, not significant. Representative images from each condition are shown.
Figure 5
Figure 5
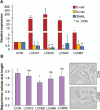
LCN scaffolds induce mesenchymal to epithelial transition in A375 melanoma cells. A) A375 melanoma cells were seeded on LCNs at different crosslinker percentages and on standard plates (CON, control). After 72 hours, cells were lysed and qPCR for the indicated genes was performed. The data were normalized with respect to the mean of GAPDH and 18S mRNA levels and expressed as fold‐change with respect to the values obtained for control samples. The data reported represents the average ± SD from four experiments. *p ≤ 0.05 and **p ≤ 0.01 versus control as determined by Student's t‐test. B) Alternatively, after 72 hours pictures were taken, and axis lengths were measured (pixels). The graph shows the major/minor cellular ratios. Data reported represents the average ± SD from three experiments. *p ≤ 0.05 versus control as determined by Student's t‐test. ns, not significant. Representative images of control (CON) and LCN20 cultures are reported.

References

    1. Liu Z., Vunjak‐Novakovic G., Curr. Opin. Chem. Eng. 2016, 11, 94. - PMC - PubMed
    1. Pal M., Chen H., Lee B. H., Lee J. Y. H., Yip Y. S., Tan N. S., Tan L. P., Sci. Rep. 2019, 9, 8997. - PMC - PubMed
    1. Tang R.‐Z., Liu X.‐Q., Mater. Today Bio. 2023, 19, 100607. - PMC - PubMed
    1. Curti B. D., Faries M. B., N. Engl. J. Med. 2021, 384, 2229. - PubMed
    1. a) Tataru C. P., Pop M. D., J. Med. Life 2012, 5, 185; - PMC - PubMed
    2. b) Sukniam K., Manaise H. K., Popp K., Popp R., Gabriel E., Cells 2024, 13, 465; - PMC - PubMed
    3. c) Bondi S., Vinciguerra A., Lissoni A., Rizzo N., Barbieri D., Indelicato P., Abati S., Int J. Environ. Res. Public Health 2021, 18, 3341. - PMC - PubMed