

Insights into Homogeneous Bulk Boron Doping at the Tetrahedral Site of NCM811 Cathode Materials: Structure Stabilization by Inductive Effect on TM-O-B Bonds
- PMID: 39828621
- PMCID: PMC11878253
- DOI: 10.1002/smll.202409743
Insights into Homogeneous Bulk Boron Doping at the Tetrahedral Site of NCM811 Cathode Materials: Structure Stabilization by Inductive Effect on TM-O-B Bonds
Abstract
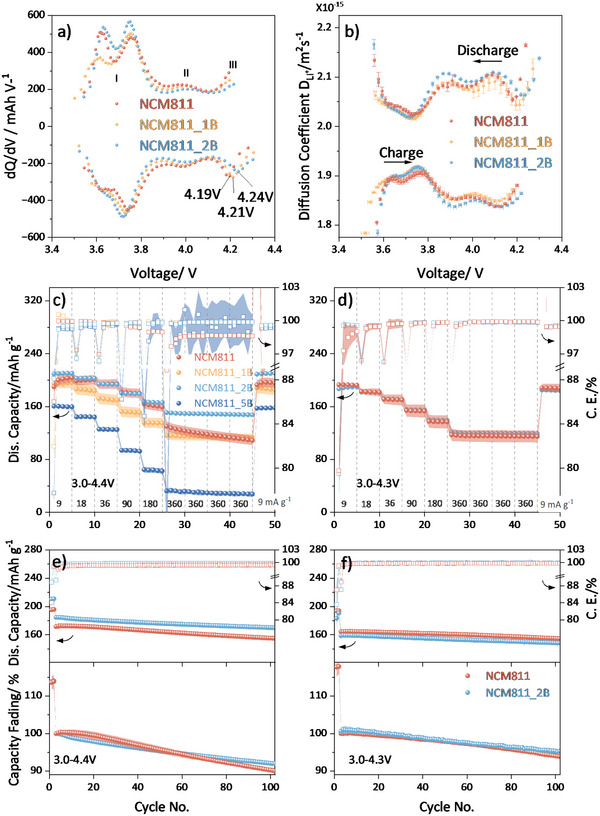
Rechargeable lithium-ion batteries (LIBs) are critical for enabling sustainable energy storage. The capacity of cathode materials is a major limiting factor in the LIB performance, and doping has emerged as an effective strategy for enhancing the electrochemical properties of nickel-rich layered oxides such as NCM811. In this study, boron is homogeneously incorporated into the tetrahedral site of NCM811 through co-precipitation, leading to an inductive effect on transition metal (TM)-O-B bonds that delayed structural collapse and reduced oxygen release. Consequently, these changes culminate in an enhancement of cycling performance, translating to an initial specific capacity of 210 mAh g-1 and a 95.3% capacity retention after 100 cycles. These interesting findings deepen the understanding of boron doping and shed light on the design of better lithium cathode materials on an applicable scale.
Keywords: B‐doping; cathode material; lithium‐ion battery.
© 2025 The Author(s). Small published by Wiley‐VCH GmbH.
Conflict of interest statement
The authors declare no conflict of interest.
Figures


References
-
- a) Liu J., Bao Z., Cui Y., Dufek E. J., Goodenough J. B., Khalifah P., Li Q., Liaw B. Y., Liu P., Manthiram A., Nat. Energy 2019, 4, 180;
- b) Duehnen S., Betz J., Kolek M., Schmuch R., Winter M., Placke T., Small Methods 2020, 4, 2000039.
-
- a) Schmuch R., Wagner R., Hörpel G., Placke T., Winter M., Nat. Energy 2018, 3, 267;
- b) Myung S.‐T., Maglia F., Park K.‐J., Yoon C. S., Lamp P., Kim S.‐J., Sun Y.‐K., ACS Energy Lett. 2017, 2, 196;
- c) Andre D., Kim S.‐J., Lamp P., Lux S. F., Maglia F., Paschos O., Stiaszny B., J. Mater. Chem. A 2015, 3, 6709.
-
- a) Zhang M., Kitchaev D. A., Lebens‐Higgins Z., Vinckeviciute J., Zuba M., Reeves P. J., Grey C. P., Whittingham M. S., Piper L. F., Van der Ven A., Nat. Rev. Mater. 2022, 7, 522;
- b) Zhang S. S., Energy Storage Mater. 2020, 24, 247; - PMC - PubMed
- c) Radin M. D., Hy S., Sina M., Fang C., Liu H., Vinckeviciute J., Zhang M., Whittingham M. S., Meng Y. S., Van der Ven A., Adv. Energy Mater. 2017, 7, 1602888.
-
- a) Gomez‐Martin A., Reissig F., Frankenstein L., Heidbüchel M., Winter M., Placke T., Schmuch R., Adv. Energy Mater. 2022, 12, 2103045;
- b) Jeevanantham B., Sarathkumar P., Kavita S., Shobana M., Appl. Surf. Sci. Adv. 2022, 12, 100350.
Grants and funding
LinkOut - more resources
Full Text Sources
