

Nano-Phase Separation and Analyte Binding in Aptasensors Investigated by Nano-IR Spectroscopy
- PMID: 39828650
- PMCID: PMC12067171
- DOI: 10.1002/smll.202409369
Nano-Phase Separation and Analyte Binding in Aptasensors Investigated by Nano-IR Spectroscopy
Abstract
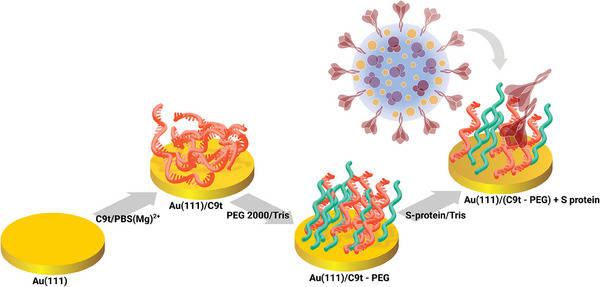
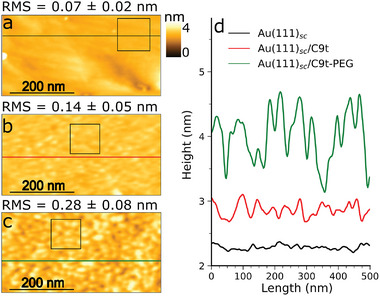
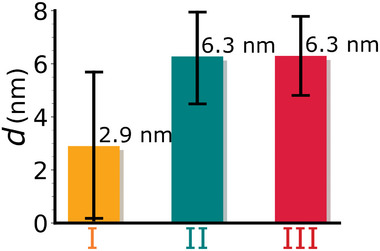
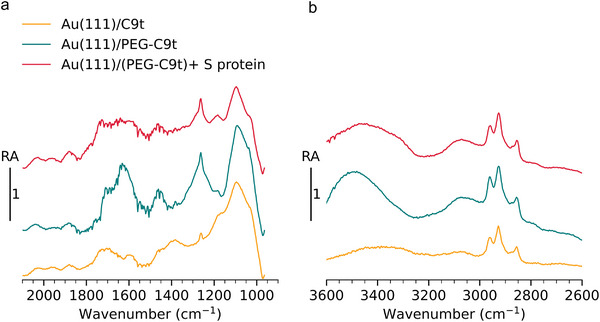
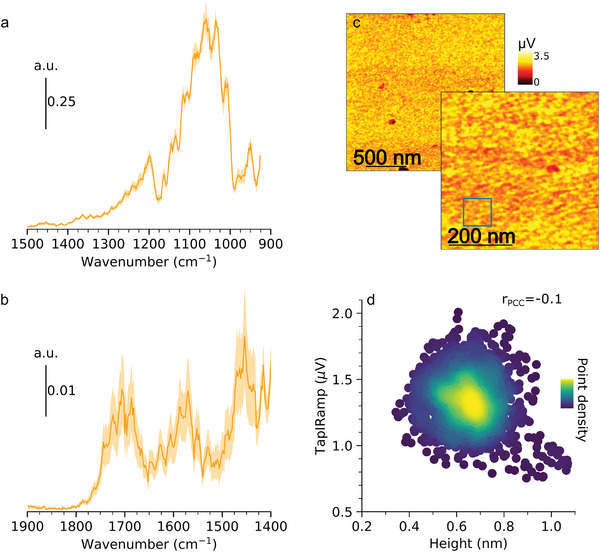
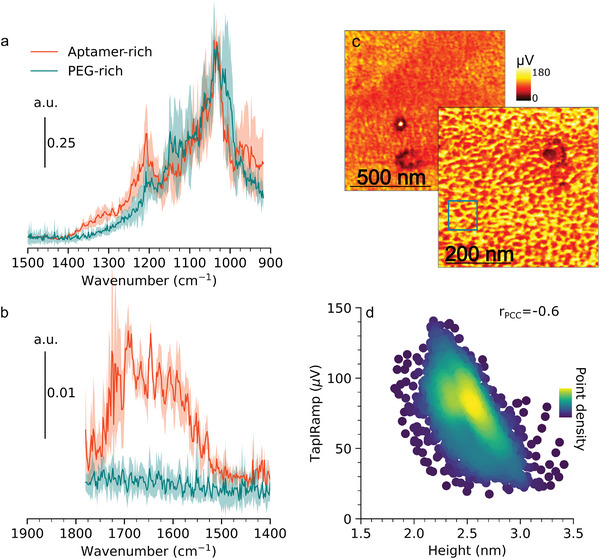
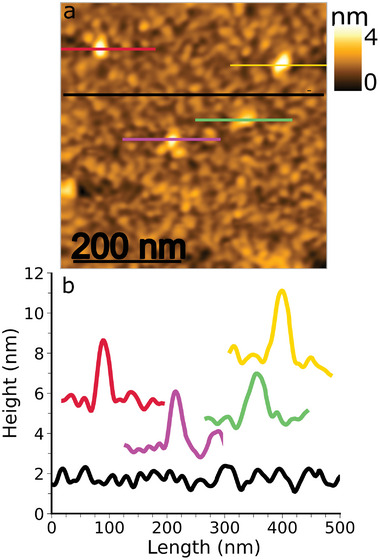
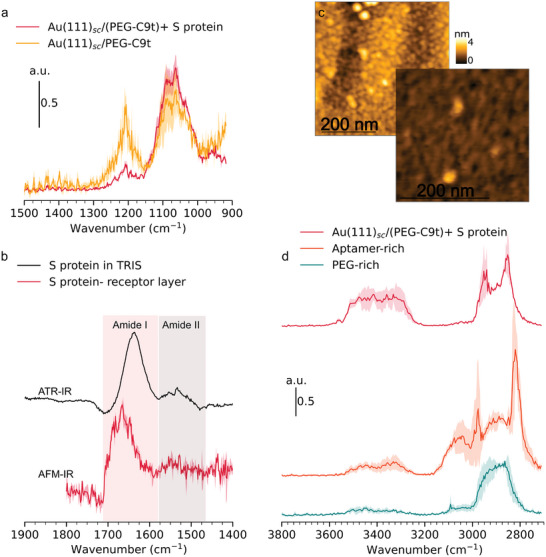
Biosensors based on DNA aptamer receptors are increasingly used in diagnostic applications. To improve the sensitivity and specificity of aptasensors, parameters affecting the stability and binding efficiency of the receptor layer need to be identified and studied. For example, the blocking step, i.e., the addition of inert molecules to the receptor layer, can improve sensor performance, but can also cause phase separation into nanodomains of unknown composition and structure. Here, nano-IR spectroscopy is used together with complementary macroscopic spectroscopic methods to study the nano-structural variations during the fabrication of a recently developed SARS-CoV-2 aptasensor. The blocking step by polyethylene glycol (PEG) causes a significant thickening of the receptor layer and a phase separation into nanodomains consisting of an aptamer-rich and a slightly thicker PEG-rich phase. The unambiguous chemical identification of the nanodomains is achieved by analysis of nano-IR images. Furthermore, bound analyte (spike protein of SARS-CoV-2) is detected at the single molecule level. Detailed analysis of the local nano-IR spectra revealed structural properties such as the amorphous state of the PEG molecules within the nanodomains and a strong change in the secondary structure of the analyte. This study significantly advances the understanding of nanoscale chemical processes in the receptor layer of aptasensors.
Keywords: aptasensor; nano‐IR spectroscopy; nano‐phase separation; self‐assembled‐monolayer; single molecule spectroscopy.
© 2025 The Author(s). Small published by Wiley‐VCH GmbH.
Conflict of interest statement
The authors declare no conflict of interest.
Figures
Similar articles
-
A Truncated Multi-Thiol Aptamer-Based SARS-CoV-2 Electrochemical Biosensor: Towards Variant-Specific Point-of-Care Detection with Optimized Fabrication.Biosensors (Basel). 2025 Jan 6;15(1):24. doi: 10.3390/bios15010024. Biosensors (Basel). 2025. PMID: 39852074 Free PMC article.
-
Comparative Analysis of QCM and Electrochemical Aptasensors for SARS-CoV-2 Detection.Biosensors (Basel). 2024 Sep 6;14(9):431. doi: 10.3390/bios14090431. Biosensors (Basel). 2024. PMID: 39329806 Free PMC article.
-
Aptamer Paper-Based Fluorescent Sensor for Determination of SARS-CoV-2 Spike Protein.Sensors (Basel). 2025 Mar 7;25(6):1637. doi: 10.3390/s25061637. Sensors (Basel). 2025. PMID: 40292706 Free PMC article.
-
Optical and electrochemical-based nano-aptasensing approaches for the detection of circulating tumor cells (CTCs).Biosens Bioelectron. 2020 Jan 15;148:111833. doi: 10.1016/j.bios.2019.111833. Epub 2019 Nov 1. Biosens Bioelectron. 2020. PMID: 31733465 Review.
-
Aptamer-based biosensors and their implications in COVID-19 diagnosis.Anal Methods. 2021 Nov 25;13(45):5400-5417. doi: 10.1039/d1ay01519b. Anal Methods. 2021. PMID: 34751684 Review.
Cited by
-
A Truncated Multi-Thiol Aptamer-Based SARS-CoV-2 Electrochemical Biosensor: Towards Variant-Specific Point-of-Care Detection with Optimized Fabrication.Biosensors (Basel). 2025 Jan 6;15(1):24. doi: 10.3390/bios15010024. Biosensors (Basel). 2025. PMID: 39852074 Free PMC article.
-
Optical label-free detection of SARS-CoV-2: investigating platform spectroscopic properties for oligonucleotide targeting.Eur Biophys J. 2025 Aug 11. doi: 10.1007/s00249-025-01787-3. Online ahead of print. Eur Biophys J. 2025. PMID: 40789819
References
-
- Liu L. S., Wang F., Ge Y., Lo P. K., ACS Appl. Mater. Interfaces. 2021, 13, 9329. - PubMed
-
- Pan J., Xu W., Li W., Chen S., Dai Y., Yu S., Zhou Q., Xia F., Anal. Chem. 2023, 95, 420. - PubMed
-
- Ellington A. D., Szostak J. W., Nature 1990, 346, 818. - PubMed
-
- Cai R., Chen X., Zhang Y., Wang X., Zhou N., J. SMAB 2022, 3, 223.
MeSH terms
Substances
Grants and funding
LinkOut - more resources
Full Text Sources
Miscellaneous
