. 2025 May;73(5):1077-1089.
doi: 10.1002/glia.24674. Epub 2025 Jan 19.

CD11c-Expressing Microglia Are Transient, Driven by Interactions With Apoptotic Cells

Affiliations

CD11c-Expressing Microglia Are Transient, Driven by Interactions With Apoptotic Cells

Nathaniel Ghena et al. Glia. 2025 May.

Abstract

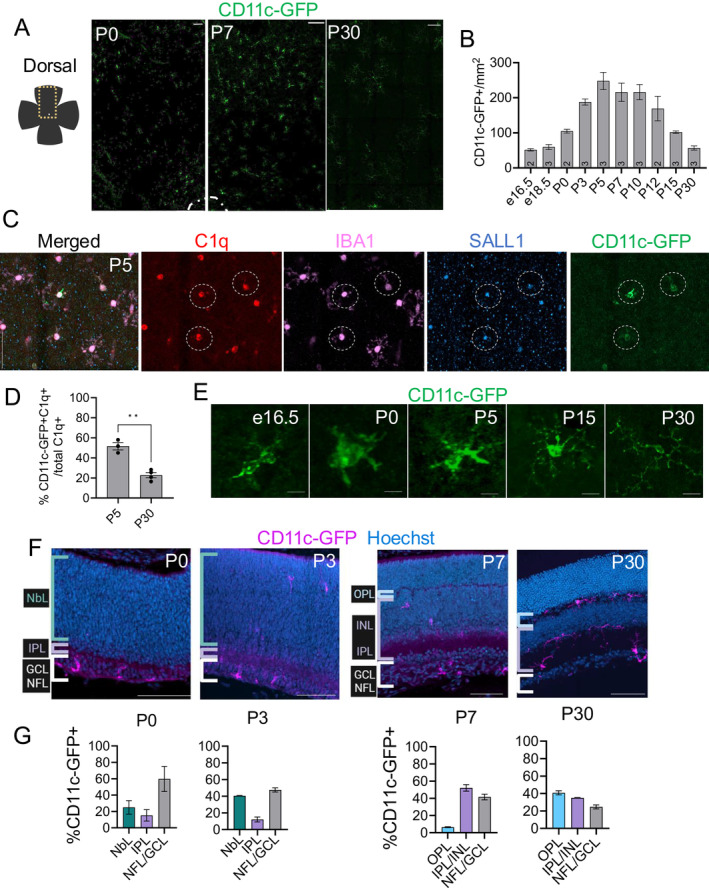
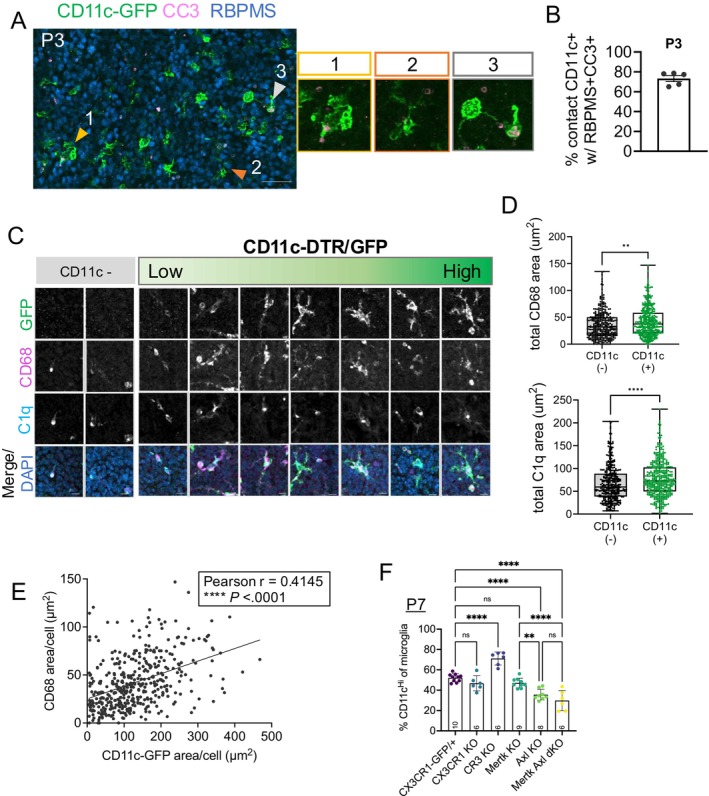
Microglia, the parenchymal macrophage of the central nervous system, serve crucial remodeling functions throughout development. Microglia are transcriptionally heterogenous, suggesting that distinct microglial states confer discrete roles. Currently, little is known about how dynamic these states are, the cues that promote them, or how they impact microglial function. In the developing retina, we previously found a significant proportion of microglia express CD11c (Integrin αX, Itgax, subunit of complement receptor 4) which has also been reported in other developmental and disease contexts. Here, we sought to understand the regulation and function of CD11c+ microglia. We found that CD11c+ microglia track with prominent waves of neuronal apoptosis in postnatal retina. Using genetic fate mapping, we provide evidence that microglia transition out of the CD11c state to return to homeostasis. We show that CD11c+ microglia have elevated lysosomal content and contribute to the clearance of apoptotic neurons, and found that acquisition of CD11c expression is partially dependent upon the TAM receptor AXL. Using selective ablation, we found CD11c+ microglia are not uniquely critical for phagocytic clearance of apoptotic cells. Together, our data suggest that CD11c+ microglia are a transient state induced by developmental apoptosis rather than a specialized subset mediating phagocytic elimination.

Keywords: CD11c; development; microglia; neuronal apoptosis; phagocytosis.


Conflict of interest statement

The authors declare no conflicts of interest.

Figures

FIGURE 1
FIGURE 1
CD11c+ microglia density and localization track with periods of apoptosis. (A) Left—schematic of retinal flat mount depicting where analysis was conducted, with dorsal leaf outlined in the dashed yellow box. Right—max projected confocal images of CD11c‐GFP+ cells in the dorsal leaf of retinal flat mounts at postnatal days (P) 0, 7, and 30. Optic nerve head outlined in the dashed white line. Scale bar, 100 μm. (B) Densities of CD11c‐GFP+ cells from retinal flat mount across embryonic and postnatal ages. Data are presented as means ± SEM (2–3 animals age). (C) Representative max projected confocal image of IBA1+ (pink), C1q+ (red), SALL1+ (blue), and CD11c‐GFP+ (green) microglia at P5. Scale bar, 50 μm. (D) Proportion of CD11c‐GFP+ retinal microglia from retinal flat mounts at postnatal days P5 and P30. Data are presented as mean ± SEM (3–4 animals/age). Unpaired t test **p = 0.0012. (E) Max projected confocal images of individual CD11c‐GFP+ microglia in retinal flat mounts from embryonic day 16.5 (e16.5) through postnatal day 30 (P30). Scale bar, 10 μm. (F) Confocal images of retinal cross‐sections from CD11c‐DTR/GFP transgenic mice at P0, P3, P7, and P30. CD11c‐GFP (Magenta); Hoescht (blue). For P0/3, brackets segment retinal layers, gray—nerve fiber layer and ganglion cell layer (NFL/GCL), purple—inner plexiform layer (IPL), and teal—neuroblastic layer (NbL). P7/P30, gray—nerve fiber layer and ganglion cell layer (NFL/GCL), purple—inner plexiform layer and inner nuclear layer (IPL/INL), and blue—outer plexiform layer (OPL) for P7 and P30. Scale bar, 100 μm. (G) Percentage of CD11c‐GFP+ microglia across all retinal layers at P0, P3, P7, and P30 (n = 2 animals). Data are presented as means ± SEM.
FIGURE 2
FIGURE 2
CD11c+ microglia are a dynamic state. (A) Cartoon depiction of CD11c lineage tracing strategy crossing CD11c‐Cre/EGFP mice with Rosa‐Ai14 tdTomato and the analysis performed at P5 and P30. (B) The proportion of microglia at P5 and P30, comparing microglia that are CD11c‐active (GFP+tdTomato+/total microglia), CD11c‐lineage (GFP‐tdTomato+/total microglia), and CD11‐negative (GFP‐tdTomato−/total microglia) by flow cytometry. (C) Max projected confocal image from P5 CD11c‐CreEGFP/+; RosatdTomato/+ retinal flat mount. Insets CD11c‐active (gold box) and CD11c‐lineage (pink box) microglia. CD68 (white), CD11c‐active (GFP, green), and CD11c‐lineage (tdTomato, red). Scale bar, 50 μm. (D) Quantification of CD68 area in CD11c‐active and CD11c‐lineage microglia at P5 (n = 3 animals, 50 CD11c‐lineage cells and 70 CD11c‐active cells) ± SEM. Mann–Whitney test ****p < 0.0001. (E) Quantification of number of phagocytic cups in CD11c‐active and CD11c‐lineage microglia at P5 (n = 3 animals, 50 CD11c‐lineage cells and 70 CD11c‐active cells) ± SEM. Mann–Whitney test ****p < 0.0001. (F) Bar graphs of RNA‐seq read counts for (top) genes with increased counts in CD11c‐active and (bottom) genes with decreased counts in CD11c‐lineage.
FIGURE 3
FIGURE 3
CD11c+ microglia emerge from interactions with apoptotic cell bodies, mediated partially by AXL signaling. (A) Confocal image of P3 retinal flat mount (arrowhead and magnified boxes illustrate interactions) in NFL/GCL. CD11c‐GFP+ microglia (green); cleaved caspase 3, CC3 (pink); and RBPMS (blue). Scale bar, 50 μm. (B) Percent CD11c‐GFP+ microglia contacting apoptotic RGCs (RBPMS+CC3+) at P3 out of total CD11c‐GFP+ microglia within GCL. (n = 5 animals). (C) Confocal images of retinal flat mounts of P3 CD11c‐GFP animals in GCL showing a range of microglial GFP expression from none to high. Scale bar, 10 μm. Dashed line demarcates distinction between CD11c‐GFP negative and positive. (D) Cell area immunostained for CD68 (Top) and C1q (Bottom) in CD11c‐GFP− and CD11c‐GFP+ microglia (n = 4 animals, 352 GFP− cells and 422 GFP+ cells). Mann–Whitney test Top **p = 0.0011 and Bottom ****p < 0.0001. (E) Scatter plot of CD68 area/cell compared to CD11c‐GFP area/cell at P3 in GCL. Pearson r = 0.4145 ****p < 0.0001. (F) Flow cytometry analysis showing the percent CD11cHi of total CD45+CD11b+ or CD45+CX3CR1‐GFP+ microglia from retinas across all genotypes. CX3CR1‐GFP/+ (n = 10), CX3CR1‐KO (n = 6), CR3 KO (n = 6), MerTK KO (n = 9), AXL KO (n = 8), and MerTK/AXL dKO (n = 6), ≥ 2 litters collected for each genotype, ± SEM. One‐way ANOVA F(5, 39) = 34.64 p < 0.0001 and Tukey's multiple comparisons. ****p < 0.0001,  **p = 0.0056,  NS, not significant.
FIGURE 4
FIGURE 4
CD11c+ microglia are not solely responsible for phagocytic clearance of apoptotic neurons. (A) Depiction of two depletion strategies, Diphtheria toxin (DT) targeted ablation of CD11c‐DTR/GFP+ microglia (Top) and PLX3397 (PLX)‐mediated depletion to target more homeostatic microglia (Bottom). (B) Confocal images of CD11c‐DTR/GFP+ microglia (green) in retinal flat mounts at P5 of Vehicle and DT‐treated CD11c‐DTR/GFP mice. Scale bar, 50 μm. (C) Density of CD11c‐DTR/GFP+ microglia in vehicle and DT‐treated CD11c‐DTR/GFP (n = 6, n = 7 animals) ± SEM. Unpaired t test ****p < 0.0001. (D) Confocal images of C1q+ microglia (white) in immunostained retinal flat mounts at P5 of vehicle and DT‐treated CD11c‐DTR/GFP mice. Scale bar, 50 μm. (E) Densities of C1q+ cells in retinas of vehicle and DT‐treated CD11c‐DTR/GFP mice (n = 6, n = 7 animals) ± SEM. Mann–Whitney test *p = 0.0140. (F) Max projected confocal images of C1q+ microglia in retinal flat mounts at P5 of vehicle and PLX‐treated Cx3CR1/GFP+ mice. C1q (white). Scale bar, 50 μm. (G) Density of C1q+ cells in retinas of naive and PLX‐treated CX3CR1‐GFP (n = 6, n = 8) ± SEM. Unpaired t test *p = 0.0239. (H) Max projected confocal images of apoptotic RGCs in retinal flat mounts at P5 of all conditions/genotypes. CC3 (magenta); RBPMS (green). Scale bar, 50 μm. (I) Density of CC3+RBPMS+ cells in retinas from vehicle and DT‐treated CD11c‐DTR/GFP mice and DT‐treated wildtype mice (WT) (n = 8, n = 10, n = 10 animals respectively) ± SEM. Ordinary one‐way ANOVA **p = 0.0018 and Tukey's multiple comparisons test: Veh vs. DT **p = 0.006, WT+DT vs. DT **p = 0.0043, NS, not significant. (J) Density of CC3+RBPMS+ cells in naive and PLX‐treated CX3CR1‐GFP/+ (n = 8, n = 8 animals) ± SEM. Unpaired t test ****p < 0.0001 (K) Scatter plot of dying RGC density (CC3+RBPMS+/mm2) compared to microglial density (C1q+/mm2) of same animal (n = 4 CD11c+ vehicle, n = 5 CD11c+ DT, n = 10 PLX animals). Pearson r = −0.6350 **p = 0.0035.

Update of

Similar articles

References

    1. Anderson, S. R. , Roberts J. M., Ghena N., et al. 2022. “Neuronal Apoptosis Drives Remodeling States of Microglia and Shifts in Survival Pathway Dependence.” eLife 11: e76564. 10.7554/eLife.76564. - DOI - PMC - PubMed
    1. Anderson, S. R. , Roberts J. M., Zhang J., et al. 2019. “Developmental Apoptosis Promotes a Disease‐Related Gene Signature and Independence From CSF1R Signaling in Retinal Microglia.” Cell Reports 27, no. 7: 2002–2013. 10.1016/j.celrep.2019.04.062. - DOI - PMC - PubMed
    1. Anderson, S. R. , and Vetter M. L.. 2019. “Developmental Roles of Microglia: A Window Into Mechanisms of Disease.” Developmental Dynamics 248, no. 1: 98–117. 10.1002/dvdy.1. - DOI - PMC - PubMed
    1. Anderson, S. R. , Zhang J., Steele M. R., et al. 2019. “Complement Targets Newborn Retinal Ganglion Cells for Phagocytic Elimination by Microglia.” Journal of Neuroscience 39, no. 11: 2025–2040. 10.1523/JNEUROSCI.1854-18.2018. - DOI - PMC - PubMed
    1. Bejarano‐Escobar, R. , Holguin‐Arevalo M. S., Montero J. A., Francisco‐Morcillo J., and Martin‐Partido G.. 2011. “Macrophage and Microglia Ontogeny in the Mouse Visual System Can Be Traced by the Expression of Cathepsins B and D.” Developmental Dynamics 240, no. 7: 1841–1855. 10.1002/dvdy.22673. - DOI - PubMed

MeSH terms

LinkOut - more resources