. 2025 Jan;15(1):e70200.
doi: 10.1002/brb3.70200.

The Cognitive Footprint of Medication Use

Affiliations

The Cognitive Footprint of Medication Use

Marta Suárez Pinilla et al. Brain Behav. 2025 Jan.

Abstract

Introduction: The cognitive side-effects of medication are common, but often overlooked in practice, and not routinely considered in interventional trials or post-market surveillance. The cognitive footprint of a medication seeks to quantify the impact of its cognitive effects based on magnitude, duration, and interaction with other factors, evaluated across the exposed population.

Methods: Bayesian multivariable regression analysis of retrospective population-based cross-sectional cohorts.

Results: We replicate positive and negative cognitive effects of commonly used medications in UK Biobank, and extend observed associations to two additional cohorts, the EPIC Norfolk, and the Caerphilly Prospective Cohort. We quantify the resultant cumulative impact at the population level given known patterns of prescribing and compare it with exemplar common diseases.

Conclusion: The cognitive side-effects of commonly used drugs may have significant impact at the population level. Consideration should be given to a routine structured assessment of cognition in interventional trials and post-market surveillance.

Keywords: medications | cognitive footprint | large‐scale cohorts | medication side effects | cognition.


Conflict of interest statement

The authors declare no conflicts of interest.

Figures

FIGURE 1
FIGURE 1
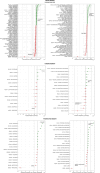
Cognitive footprint of medication according to results from UK Biobank cohort, on the following domains and outcomes: processing speed (reaction time ‐RT‐) and verbal/numerical reasoning (fluid intelligence ‐FI score‐). For each cognitive outcome, the leftward panel presents medications classified according to the last level of the Anatomical Therapeutic Classification (ATC level 5: chemical substances, e.g., ‘ibuprofen’), while the rightward panel groups medications according to the ATC level 4 (pharmacological subgroups, e.g., propionic acid derivatives). Note than while the ATC codes are official, the accompanying terms may have been abbreviated (e.g., ‘tertiary anticholinergics’ for ‘anticholinergics with tertiary amino group’). The cognitive footprint of a medication on a specific cognitive outcome represents the estimated effect of medication use in the UK population (ages 40 to 70), according to the individual effect estimated by modelling UK Biobank data and assuming UK‐wide prevalence of consumption is the same as in the cohort. Units are Z‐scores of the distribution of the cognitive outcome score (RT, FI) across UK Biobank participants. Error bars represent 95% credible intervals. Only medications with over 50% credibility for a non‐zero effect are presented in the graph (i.e., the 50% credible intervals of the corresponding regression coefficient do not contain zero). Negative values and red colour indicate the medication is associated to worse cognitive score, while positive values indicate association to better score. The dashed vertical bars represent the cognitive footprint of other covariates in the model or potential interventions (demographic, medical or environmental conditions, etc.). For instance, the cognitive footprint of multiple sclerosis is calculated as the individual effect of the disease according to the model presented in the same graph (e.g., ATC level 5‐medications and RT), multiplied by the estimated prevalence of the condition in the UK population (ages 40 ‐ 70), extrapolated from the prevalence in the UK Biobank cohort. The cognitive footprint of a hypothetical intervention consisting on reducing air pollution by a certain amount is calculated according to the individual effect of the condition (pollution in this case) according to the model, if it was applied to the entire UK population by the amount indicated (e.g., 1 mcg/m3 NO2). Abbreviations: Non‐ster.: non‐steroidal; antiinflamm: anti‐inflammatory; antirheum: antirheumatic; ACE: angiotensin‐converting enzyme; NSAID: non‐steroidal anti‐inflammatory drugs; inh.: inhibitors; (semi)synth.: (semi)synthetic; ARB: angiotensin II receptor blockers; SSRI: selective serotonin reuptake inhibitors; freq.: frequency; aggreg.: aggregation; excl.: excluding; nsMRI: non‐selective monoamine reuptake inhibitors.
FIGURE 2
FIGURE 2
Cognitive footprint of medication according to results from UK Biobank cohort, on the following domains and outcomes: visual memory (pairs‐matching test ‐PaMa‐), numeric memory (NM) and prospective memory). For each cognitive outcome, the leftward panel presents medications classified according to the last level of the Anatomical Therapeutic Classification (ATC level 5: chemical substances, e.g., ‘ibuprofen’), while the rightward panel groups medications according to the ATC level 4 (pharmacological subgroups, e.g., propionic acid derivatives). Note than while the ATC codes are official, the accompanying terms may have been abbreviated (e.g., ‘tertiary anticholinergics’ for ‘anticholinergics with tertiary amino group’). The cognitive footprint of a medication on a specific cognitive outcome represents the estimated effect of medication use in the UK population (ages 40 to 70), according to the individual effect estimated by modelling UK Biobank data and assuming UK‐wide prevalence of consumption is the same as in the cohort. Units are Z‐scores of the distribution of the cognitive outcome score (PaMa, NM, PM) across UK Biobank participants. Error bars represent 95% credible intervals. Only medications with over 50% credibility for a non‐zero effect are presented in the graph (i.e., the 50% credible intervals of the corresponding regression coefficient do not contain zero). Negative values and red colour indicate the medication is associated to worse cognitive score, while positive values indicate association to better score. The dashed vertical bars represent the cognitive footprint of other covariates in the model or potential interventions (demographic, medical or environmental conditions, etc.). For instance, the cognitive footprint of depression is calculated as the individual effect of the disease according to the model presented in the same graph (e.g., ATC level 5‐medications and PaMa), multiplied by the estimated prevalence of the condition in the UK population (ages 40 ‐ 70), extrapolated from the prevalence in the UK Biobank cohort. The cognitive footprint of a hypothetical intervention consisting on reducing Hb1ac levels by a certain amount is calculated according to the individual effect of the condition (Hb1ac blood levels in this case) according to the model, if it was applied to the entire UK population by the amount indicated (e.g., 5 mmol/mL). Abbreviations: Non‐ster.: non‐steroidal; antiinflamm: anti‐inflammatory; antirheum: antirheumatic; ACE: angiotensin‐converting enzyme; NSAID: non‐steroidal anti‐inflammatory drugs; inh.: inhibitors; (semi)synth.: (semi)synthetic; ARB: angiotensin II receptor blockers; SSRI: selective serotonin reuptake inhibitors; freq.: frequency; aggreg.: aggregation; excl.: excluding; nsMRI: non‐selective monoamine reuptake inhibitors.
FIGURE 3
FIGURE 3
Cognitive footprint of medication according to results from UK Biobank cohort, on ´overall cognition´ (first component of PCA decomposition on the individual test results). The leftward panel presents medications classified according to the last level of the anatomical therapeutic classification (ATC level 5: chemical substances, e.g., ‘ibuprofen’), while the rightward panel groups medications according to the ATC level 4 (pharmacological subgroups, e.g., propionic acid derivatives). Note than while the ATC codes are official, the accompanying terms may have been abbreviated (e.g., ‘tertiary anticholinergics’ for ‘anticholinergics with tertiary amino group’). The cognitive footprint of a medication on a specific cognitive outcome represents the estimated effect of medication use in the UK population (ages 40 to 70), according to the individual effect estimated by modelling UK Biobank data and assuming UK‐wide prevalence of consumption is the same as in the cohort. Units are Z‐scores of the distribution of the cognitive outcome score (PCA‐Cognition) across UK Biobank participants. Error bars represent 95% credible intervals. Only medications with over 50% credibility for a non‐zero effect are presented in the graph (i.e., the 50% credible intervals of the corresponding regression coefficient do not contain zero). Negative values and red colour indicate the medication is associated to worse cognitive score, while positive values indicate association to better score. The dashed vertical bars represent the cognitive footprint of other covariates in the model or potential interventions (demographic, medical or environmental conditions, etc.). For instance, the cognitive footprint of recent invalidating pain is calculated as the individual effect of the condition according to the model presented in the same graph (e.g., ATC level 5‐medications and PCA‐Cognition), multiplied by the estimated prevalence of the condition in the UK population (ages 40 ‐ 70), extrapolated from the prevalence in the UK Biobank cohort. The cognitive footprint of a hypothetical intervention consisting on reducing air pollution by a certain amount is calculated according to the individual effect of the condition (pollution in this case) according to the model, if it was applied to the entire UK population by the amount indicated (e.g., 1 mcg/m3 NO2). Abbreviations: Non‐ster.: non‐steroidal; antiinflamm: anti‐inflammatory; antirheum: antirheumatic; ACE: angiotensin‐converting enzyme; NSAID: non‐steroidal anti‐inflammatory drugs; inh.: inhibitors; (semi)synth.: (semi)synthetic; ARB: angiotensin II receptor blockers; SSRI: selective serotonin reuptake inhibitors; freq.: frequency; aggreg.: aggregation; excl.: excluding; nsMRI: non‐selective monoamine reuptake inhibitors.

References

    1. Akter, S. , Hassan M. R., Shahriar M., Akter N., Abbas M. G., and Bhuiyan M. A.. 2015. “Cognitive Impact After Short‐Term Exposure to Different Proton Pump Inhibitors: Assessment Using CANTAB Software.” Alzheimers Research and Therapy 7: 79. 10.1186/s13195-015-0164-8. - DOI - PMC - PubMed
    1. Allen, N. , Sudlow C., Downey P., et al. 2012. “UK Biobank: Current Status and What It Means for Epidemiology.” Health Policy and Technology 1, no. 3: 123–126. 10.1016/j.hlpt.2012.07.003. - DOI
    1. Beddington, J. , Cooper C., Field J., et al. 2008. “The Mental Wealth of Nations.” Nature 455, no. 7216: 1057–1060. 10.1038/4551057a. - DOI - PubMed
    1. Bradley, R. H. , and Corwyn R. F.. 2002. “Socioeconomic Status and Child Development.” Annual Review of Psychology 53: 371–399. 10.1146/annurev.psych.53.100901.135233. - DOI - PubMed
    1. The Caerphilly and Speedwell Collaborative Group . 1984. “Caerphilly and Speedwell Collaborative Heart Disease Studies.” Journal of Epidemiology and Community Health 38, no. 3: 259–262. 10.1136/jech.38.3.259. - DOI - PMC - PubMed

LinkOut - more resources