Multicenter Study
. 2025 Apr 22;151(16):1162-1183.
doi: 10.1161/CIRCULATIONAHA.124.070693. Epub 2025 Jan 20.

Exploring Integrin α5β1 as a Potential Therapeutic Target for Pulmonary Arterial Hypertension: Insights From Comprehensive Multicenter Preclinical Studies

Affiliations
Multicenter Study

Exploring Integrin α5β1 as a Potential Therapeutic Target for Pulmonary Arterial Hypertension: Insights From Comprehensive Multicenter Preclinical Studies

Sarah-Eve Lemay et al. Circulation. .

Abstract

Background: Pulmonary arterial hypertension (PAH) is characterized by obliterative vascular remodeling of the small pulmonary arteries (PAs) and progressive increase in pulmonary vascular resistance leading to right ventricular failure. Although several drugs are approved for the treatment of PAH, mortality rates remain high. Accumulating evidence supports a pathological function of integrins in vessel remodeling, which are gaining renewed interest as drug targets. However, their role in PAH remains largely unexplored.

Methods: The expression of the RGD (arginylglycylaspartic acid)-binding integrin α5β1 was assessed in PAs, PA smooth muscle cells, and PA endothelial cells from patients with PAH and controls using NanoString, immunoblotting, and Mesoscale Discovery assays. RNA sequencing was conducted to identify gene networks regulated by α5β1 inhibition in PAH PA smooth muscle cells. The therapeutic efficacy of α5β1 inhibition was evaluated using a novel small molecule inhibitor and selective neutralizing antibodies in Sugen/hypoxia and monocrotaline rat models, with validation by an external contract research organization. Comparisons were made against standard-of-care therapies (ie, macitentan, tadalafil) and sotatercept and efficacy was assessed using echocardiographic, hemodynamic, and histological assessments. Ex vivo studies using human precision-cut lung slices were performed to further assess the effects of α5β1 inhibition on pulmonary vascular remodeling.

Results: We found that the arginine-glycine-aspartate RGD-binding integrin α5β1 is upregulated in PA endothelial cells and PA smooth muscle cells from patients with PAH and remodeled PAs from animal models. Blockade of the integrin α5β1 or depletion of the α5 subunit downregulated FOXM1 (forkhead box protein M1)-regulated gene networks, resulting in mitotic defects and inhibition of the pro-proliferative and apoptosis-resistant phenotype of PAH cells. We demonstrated that α5β1 integrin blockade safely attenuates pulmonary vascular remodeling and improves hemodynamics and right ventricular function and matched or exceeded the efficacy of standard of care and sotatercept in multiple preclinical models. Ex vivo studies further validated its potential in reversing advanced remodeling in human precision-cut lung slices.

Conclusions: These findings establish α5β1 integrin as a pivotal driver of PAH pathology and we propose its inhibition as a novel, safe, and effective therapeutic strategy for PAH.

Keywords: extracellular matrix; heart ventricles; hypertension, pulmonary; integrins; models, animal; vascular remodeling.


Conflict of interest statement

This study was partially funded by Morphic Therapeutic.

Figures
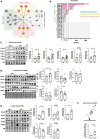
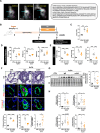
Figure 1.
Figure 1.
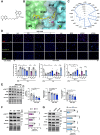
Integrin α5 subunit is upregulated in pulmonary artery smooth muscle cells and pulmonary artery endothelial cells of patients with pulmonary arterial hypertension. A, Organization and grouping of the integrin subunits in mammalian cells based on their matrix affinity. B, Graph representing relative NanoString counts of various integrin subunits in pulmonary arterial hypertension (PAH) pulmonary artery smooth muscle cells (PASMCs). C, Representative Western blots and corresponding quantification of ITGα5, ITGαV, ΙΤGβ1, ITGβ3, and ITGB5 in dissected pulmonary arteries from healthy donors and patients with PAH. Protein expression was normalized to amido black (AB; n=8 or 15; *P<0.05, **P<0.01, unpaired Student t test; data represent mean±SEM). D, Representative Western blots and corresponding quantification of ITGα5, ITGαV, ITGβ1, ITGβ3, and ITGβ5 in PASMCs isolated from healthy donors and patients with PAH. Protein expression was normalized to AB (n=6 or 8; *P<0.05, **P<0.01, unpaired Student t test for ITGα5, ΙΤGβ1, ΙΤGβ3, and ΙΤGβ5 expression or Mann-Whitney for ITGαV expression; data represent mean±SEM). E, Representative Western blots and corresponding quantifications of ITGα5, ITGαV, ITGβ1, ITGβ3, and ITGβ5 in pulmonary artery endothelial cells (PAECs) isolated from healthy donors and patients with PAH. Protein expression was normalized to AB (n=3 or 6; *P<0.05, **P<0.01, unpaired Student t test; data represent mean±SEM). F, α5β1 protein levels as determined by Meso Scale Discovery custom electrochemiluminescence assay in control and PAH PASMCs (n=6 or 8; *P<0.05, unpaired Student t test; data represent mean±SEM). RGD indicates arginylglycylaspartic acid.
Figure 2.
Figure 2.
Inhibition of integrin α5β1 reduces the pro-proliferative and apoptosis-resistant phenotype of pulmonary arterial hypertension pulmonary artery smooth muscle cells. A, Structure of MRT1. B, X-ray crystallographic structure of human α5β1 headpiece in complex with MRT1 (yellow) determined at 1.7 Å. The α5 subunit is shown in green and β1 in cyan surfaces. The Mg2+ ion is shown as a magenta sphere and water molecules are shown as red spheres. Hydrogen bonds with the ligand and coordination bonds between bound waters and the ligand are depicted as dashed lines. C, Radar plot of the inhibitory activity (in nM) of MRT1 against various integrins as determined through fluorescence polarization (half-maximal inhibitory concentration [IC50]) assays. D, Representative fluorescent images of Ki-67–labeled (red), Annexin V–labeled (green), and terminal deoxynucleotidyl transferase dUTP nick end–labeled (green) control and pulmonary arterial hypertension (PAH) pulmonary artery smooth muscle cells (PASMCs) exposed or not to escalating doses of MRT1, M200 (0.5 µg/mL), or siITGA5 (10 nM) for 48 hours. The corresponding quantifications are shown (n=3 or 6; *P<0.05, ***P<0.001, ****P<0.0001, 1-way ANOVA followed by Tukey post hoc analysis; data represent mean±SEM). Scale bars=50 μm. E, Representative Western blots and corresponding quantifications of the ratio of phospho-FAK (focal adhesion kinase; Y397) to FAK, MCM2 (minichromosome maintenance complex component 2), and Survivin in PAH PASMCs exposed or not to escalating concentrations of MRT1 for 48 hours. Protein expression was normalized to amido black (AB; n=6; *P<0.05, **P<0.01, ***P<0.001, ****P<0.0001, 1-way ANOVA followed by Dunnett post hoc analysis; data represent mean±SEM). F, Representative Western blots and corresponding quantifications of the ratio of phospho-FAK (Y397) to FAK, MCM2, and Survivin in PAH PASMCs exposed or not to M200 (0.5 μg/mL) for 48 hours (n=6; *P<0.05, **P<0.01, unpaired Student t test for MCM2 and Survivin expression and Mann-Whitney test for phospho-FAK [Y397] to FAK expression; data represent mean±SEM). G, Representative Western blots and corresponding quantifications of the ratio of phospho-FAK (Y397) to FAK, MCM2, and Survivin in PAH PASMCs exposed or not to siITGA5 for 48 hours (n=6; **P<0.01, ****P<0.0001, unpaired Student t test; data represent mean±SEM). MIDAS indicates magnesium ion of the metal-ion-dependent adhesion site.
Figure 3.
Figure 3.
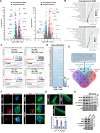
Integrin α5β1 regulates a mitotic gene network. A, Volcano plots of differentially expressed genes in response to M200 or MRT1 treatment for 48 hours across different pulmonary arterial hypertension (PAH) pulmonary artery smooth muscle cell (PASMC) cell lines (n=4), with genes considered as differentially expressed (|fold change|≥1.4, Padjusted≤0.05) colored in purple/red (upregulated by α5β1 inhibition) or turquoise/blue (downregulated by α5β1 inhibition). Genes of interest are highlighted. B, Enrichment analysis performed by ShinyGo software version 0.77 showing the top Gene Ontology biological processes in downregulated and upregulated genes after M200 or MRT1 exposure in PAH PASMCs. C, Gene set enrichment analysis charts showing the enrichment of genes related to mitotic spindle and G2/M checkpoint. A negative normalized enrichment score (NES) value indicates the downregulation in α5β1-inhibited PAH PASMCs. D, Heatmap displaying genes related to G2/M checkpoint that are altered (Padjusted<0.05) by M200. The fold change (FC) of the same genes in MRT1-treated PAH PASMCs is shown. E, Venn diagram of shared upregulated and downregulated transcripts between the indicated groups. F, Representative images of the structure of the mitotic spindle in synchronized PAH PASMCs treated or not with MRT1 (4 μM, 10 hours) or siITGA5 (transfected 24 hours before the double thymidine block initiation). Red, green, and blue in the image represent pericentrin (PCNT), α-tubulin (αTUB), and DNA, respectively. Scale bar=5 μm. G, Representative images and frequency of binucleated cells after treatment with MRT1 (4 μM, 10 hours), M200 (0.5 µg/mL, 10 hours), or siITGA5 (transfected 24 hours before the double thymidine block initiation; n=5; **P<0.01, ****P<0.0001, unpaired Student t test for MRT1 and siITGA5 and Mann-Whitney test for M200; data represent mean±SEM). Scale bar=25 μm. H, Representative Western blots of PLK1 (polo-like kinase 1), NEK2 (NIMA-related kinase 2), phospho-β-catenin, and β-catenin in PAH PASMCs exposed or not to escalating doses of MRT1 for 48 hours or siITGA5 for 48 hours. IgG indicates immunoglobulin G.
Figure 4.
Figure 4.
The downregulated genes upon α5β1 inhibition are regulated by FOXM1. A, Volcano plot illustrating terms from the encode and ChEA consensus transcription factors from the ChIP-X gene set. Each term is represented as a point, positioned according to its odds ratio (position on the x-axis) and −log10 (P value; position on the y-axis), reflecting results from the enrichment analysis of the gene set submitted. Stronger enrichment significance of the term within the input gene set is represented by larger and darker-colored points. B, Western blot and corresponding quantification of FOXM1 (forkhead box protein M1) in pulmonary artery smooth muscle cells (PASMCs) isolated from healthy donors and patients with pulmonary arterial hypertension (PAH). Protein expression was normalized to amido black (AB; n=6 or 7; **P<0.01, unpaired Student t test; data represent mean±SEM). C, Heatmap displaying the overlapping downregulated genes by M200 and MRT1. The fold change (FC) of the same genes in siFOXM1-treated PAH PASMCs is shown. D, Representative Western blot, and corresponding quantification of FOXM1 in PAH PASMCs exposed or not to escalating concentrations of MRT1 for 48 hours (n=5; *P<0.05, ****P<0.0001; 1-way ANOVA followed by Dunnett post hoc analysis; data represent mean±SEM). E, Representative Western blot and corresponding quantification of FOXM1 in PAH PASMCs exposed or not to M200 (0.5 μg/mL) for 48 hours (n=6; *P<0.05, unpaired Student t test; data represent mean±SEM). F, Representative Western blot and corresponding quantification of FOXM1 in PAH PASMCs exposed or not to siITGA5 for 48 hours (n=6; *p<0.05 unpaired Student t test data represent mean±SEM). G, Representative Western blot and corresponding quantification of the ratio of phospho-FAK (focal adhesion kinase; Y397) to FAK and FOXM1 in PAH PASMCs exposed or not to PF-573288 at indicated doses for 48 hours (n=3; *P<0.05, **P<0.01; 1-way ANOVA followed by Dunnett post hoc analysis; data represent mean±SEM). H, Representative fluorescent images of Ki-67–labeled (red) PAH PASMCs infected for 24 hours with an adenovirus encoding for human FOXM1 or an adenovirus null and then exposed to M200 (0.5 µg/mL) or immunoglobulin G (IgG) in presence of PDGF-BB (platelet-derived growth factor BB; 30 ng/mL) for 48 hours. The corresponding quantifications are shown (n=5; *P<0.05, ***P<0.001; 1-way ANOVA followed by Dunnett post hoc analysis; data represent mean±SEM). Scale bars=50 μm. I, Representative Western blot and corresponding quantification of FOXM1, PLK1 (polo-like kinase 1), Survivin, and MCM2 (minichromosome maintenance complex component 2) in PAH PASMCs infected for 24 hours with an adenovirus encoding for human FOXM1 or an adenovirus null and then exposed to M200 (0.5 µg/mL) or IgG in presence of PDGF-BB (30 ng/mL) for 48 hours (n=5; *P<0.05, **P<0.01, ***P<0.001; 1-way ANOVA followed by Dunnett post hoc analysis; data represent mean±SEM).
Figure 5.
Figure 5.
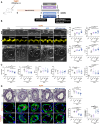
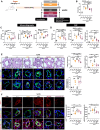
Treatment with RGD integrins inhibitor alone or combined with macitentan and tadalafil attenuates established pulmonary arterial hypertension in Sugen/hypoxia rats. A, Study design using the Sugen/hypoxia (Su/Hx) rat model (control, n=5; vehicle, n=10; macitentan+tadalafil, n=8; MRT1, n=9; and MRT1+macitentan+tadalafil, n=10). B, Representative echocardiographic images of tricuspid annular plane systolic excursion (TAPSE), S wave (S′), and morphological change of the right ventricle (RV) and left ventricle (LV) in control and Su/Hx rats treated with vehicle, macitentan+tadalafil, MRT1, or MRT1+macientant+tadalafil. The quantifications of pulmonary artery acceleration time (PAAT)/ejection time (ET) ratio, S wave, cardiac output (CO), and stroke volume (SV) are shown (n=5 to 10; *P<0.05, **P<0.01, ***P<0.001, ****P<0.0001; 1-way ANOVA followed by Tukey post hoc analysis; data represent mean±SEM). C, Effect of integrin α5β1/αvβ1 inhibition on right ventricular systolic pressure (RVSP), mean pulmonary arterial pressure (mPAP), SV, heart rate (HR), CO, and total pulmonary vascular resistance, as assessed by right heart catheterization (n=5 to 10; *P<0.05, **P<0.01, ***P<0.001, ****P<0.0001; 1-way ANOVA followed by Tukey post hoc analysis for RVSP, mPAP, SV, HR, and CO, and Kruskal-Wallis test followed by Dunn post hoc analysis for total pulmonary vascular resistance; data represent mean±SEM). D, Representative images of distal pulmonary arteries stained with Elastica van Gieson (EVG) or labeled with PCNA (proliferative marker; red) or cleaved caspase 3 (apoptosis marker; red). α–Smooth muscle actin (αSMA, green) was used to detect smooth muscle cells. The quantifications of medial wall thickness, PCNA-positive, and cleaved caspase 3–positive smooth muscle cells are presented on the right (n=5 to 10; *P<0.05, **P<0.01, ***P<0.001, ****P<0.0001; 1-way ANOVA followed by Tukey post hoc analysis; data represent mean±SEM). Scale bars=20 μm.
Figure 6.
Figure 6.
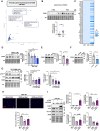
A function-blocking anti-rat integrin α5β1 antibody improves established pulmonary arterial hypertension in Sugen/hypoxia-challenged rats. A, Representative 2-dimensional classes of the 3 α5-specific blocking antibodies used in the study: M200 (as Fab), 339.1 (Fab), and mAb4 (immunoglobulin G [IgG]) in complex with recombinant α5β1 ectodomain proteins of their corresponding species and variable domain sequences of heavy and light chains. The yellow lines highlight the Fab fragments, cyan for the α5, and magenta for β1 subunit. The complex structures clearly indicate that the functional epitope of all 3 antibodies is located in the β-propeller domain of the α5 subunit. The β-propeller domain has been shown to interact with the Fn9 domain of fibronectin. B, Study design using the Sugen/hypoxia (Su/Hx) rat model (control, n=5; IgG, n=10; and mAb4, n=10). C, Assessment of right ventricular hypertrophy by Fulton index (n=5 to 10; *P<0.05, ****P<0.0001; 1-way ANOVA followed by Dunnett post hoc analysis; data represent mean±SEM). D, Cardiac output (CO), tricuspid annular plane systolic excursion (TAPSE), and right ventricular fractional area change (FAC) measured using echocardiography in control and Su/Hx rats treated with IgG or mAb4 (n=5 to 10; *P<0.05, **P<0.01, ***P<0.001, ****P<0.0001; 1-way ANOVA followed by Dunnett post hoc analysis; data represent mean±SEM). E, Effect of integrin α5β1 inhibition on right ventricular systolic pressure (RVSP), mean pulmonary arterial pressure (mPAP), and total pulmonary vascular resistance, as assessed by right heart catheterization (n=5 to 10; ****P<0.0001; 1-way ANOVA followed by Dunnett post hoc analysis; data represent mean±SEM). F, Representative images and corresponding quantifications of distal pulmonary arteries stained with Elastica van Gieson (EVG) or labeled with PCNA (proliferative marker, red) or cleaved caspase 3 (apoptosis marker, red) in control, Su/Hx+vehicle, and Su/Hx+mAb4 rats. Pulmonary artery smooth muscle cells (PASMCs) were labeled with α–smooth muscle actin (αSMA; green; n=5 to 10; **P<0.01, ****P<0.0001; 1-way ANOVA followed by Dunnett post hoc analysis for EVG and PCNA, Kruskal-Wallis test followed by Dunn post hoc analysis for cleaved caspase 3; data represent mean±SEM). Scale bars=25 μm. G, Representative Western blot and corresponding densitometric analyses of phospho-FAK (focal adhesion kinase; Y397) in dissected pulmonary arteries from control and Su/Hx rats treated with either mAb4 or IgG control. Protein expression was normalized to amido black (AB; n=5 to 10; ***P<0.001; 1-way ANOVA followed by Dunnett post hoc analysis; data represent mean±SEM). H, Nppb, Col1a1, Col3a1, and Ltbp2 transcripts in control, Su/Hx+vehicle, and Su/Hx+mAb4 rats (n=5 to 10; *P<0.05, **P<0.01, ***P<0.001; 1-way ANOVA followed by Dunnett post hoc analysis; data represent mean±SEM).
Figure 7.
Figure 7.
mAb4 and RAP-011 showed similar efficacy to improve pulmonary arterial hypertension progression in Sugen/hypoxia-exposed rats. A, Study design using the Sugen/hypoxia (Su/Hx) rat model (control, n=5; immunoglobulin G [IgG], n=9; mAb4, n=10; IgG2, n=10; RAP-011, n=9; and mAb4+RAP-011, n=8). B, Assessment of right ventricular hypertrophy by Fulton index (n=5 to 10); **P<0.01, ***P<0.001, ****P<0.0001; 1-way ANOVA followed by Tukey post hoc analysis. C, Cardiac output (CO), tricuspid annular plane systolic excursion (TAPSE), and right ventricular fractional area change (FAC) measured using echocardiography in control and Su/Hx rats treated with IgG1, mAb4, IgG2, RAP-011, and mAb4+RAP-011 (n=5 to 10; *P<0.05, ***P<0.001, ****P<0.0001; 1-way ANOVA followed by Tukey post hoc analysis; data represent mean±SEM). D, Right ventricular systolic pressure (RVSP), mean pulmonary arterial pressure (mPAP), and total pulmonary vascular resistance as assessed by right heart catheterization (n=5 to 10; *P<0.05, **P<0.01, ***P<0.001, ****P<0.0001; 1-way ANOVA followed by Tukey post hoc analysis; data represent mean±SEM). E, Representative images of distal pulmonary arteries stained with Elastica van Gieson (EVG) or labeled with PCNA (proliferative marker, red) or cleaved caspase 3 (apoptosis marker, red). α–Smooth muscle actin (αSMA, green) was used to detect smooth muscle cells. The quantifications of medial wall thickness, PCNA-positive, and cleaved caspase 3–positive smooth muscle cells are presented on the right (n=5 to 10; **P<0.01, ***P<0.001, ****P<0.0001; 1-way ANOVA followed by Tukey post hoc analysis; data represent mean±SEM). Scale bars=20 μm. F, Representative images and corresponding quantification of phospho-FAK (focal adhesion kinase; Y397; red) or phospho-SMAD2(Ser465/467)/SMAD 3(Ser423/425; red) expression in control and Su/Hx rats treated with IgG1, mAb4, IgG2, RAP-011, and mAb4+RAP-011. Pulmonary artery smooth muscle cells (PASMCs) were labeled with αSMA (green; n=5 to 10; *P<0.05, **P<0.01, ****P<0.0001; 1-way ANOVA followed by Tukey post hoc analysis; data represent mean±SEM). Scale bar=20 µm.
Figure 8.
Figure 8.
Inhibition of integrin α5 subunit reduces vascular remodeling in human precision-cut lung slices. A, Representative images of distal pulmonary arteries stained with Elastica van Gieson (EVG) or labeled with PCNA in precision-cut lung slices (PCLS) prepared from control patients after exposure or not to a growth factor cocktail in presence or not of MRT1 (4 μM) or M200 (1 µg/mL) for 10 days. Pulmonary artery smooth muscle cells (PASMCs) were labeled with α–smooth muscle actin (αSMA, green). The quantification of vascular remodeling and PASMCs positive for PCNA are shown. Each point represents a patient and corresponds to the average of 13 to 15 arteries per slide (n=5; *P<0.05, **P<0.01, ***P<0.001; repeated-measures 1-way ANOVA followed by Dunnett post hoc analysis). Scale bars=25 μm. B, Representative images of distal pulmonary arteries stained with EVG or labeled with PCNA in PCLS from patients with pulmonary hypertension (PH; pulmonary arterial hypertension [PAH] or PH secondary to idiopathic pulmonary fibrosis [IPF-PH]) after exposure to MRT1 (4 μM) or M200 (1 µg/mL) for 10 days. Each point represents a patient and corresponds to the average of 13 to 15 arteries per slide (n=6; *P<0.05, ***P<0.001, ****P<0.0001; paired Student t test or Wilcoxon matched-pairs signed rank test). Scale bars=25 μm.

Update of

Comment in

References

    1. Humbert M, Guignabert C, Bonnet S, Dorfmuller P, Klinger JR, Nicolls MR, Olschewski AJ, Pullamsetti SS, Schermuly RT, Stenmark KR, et al. . Pathology and pathobiology of pulmonary hypertension: state of the art and research perspectives. Eur Respir J. 2019;53:1801887. doi: 10.1183/13993003.01887-2018 - PMC - PubMed
    1. Pullamsetti SS, Savai R, Seeger W, Goncharova EA. Translational advances in the field of pulmonary hypertension: from cancer biology to new pulmonary arterial hypertension therapeutics: targeting cell growth and proliferation signaling hubs. Am J Respir Crit Care Med. 2017;195:425–437. doi: 10.1164/rccm.201606-1226PP - PMC - PubMed
    1. Humbert M, Sitbon O, Guignabert C, Savale L, Boucly A, Gallant-Dewavrin M, McLaughlin V, Hoeper MM, Weatherald J. Treatment of pulmonary arterial hypertension: recent progress and a look to the future. Lancet Respir Med. 2023;11:804–819. doi: 10.1016/S2213-2600(23)00264-3 - PubMed
    1. Lajoie AC, Lauziere G, Lega JC, Lacasse Y, Martin S, Simard S, Bonnet S, Provencher S. Combination therapy versus monotherapy for pulmonary arterial hypertension: a meta-analysis. Lancet Respir Med. 2016;4:291–305. doi: 10.1016/S2213-2600(16)00027-8 - PubMed
    1. Hoeper MM, Badesch DB, Ghofrani HA, Gibbs JSR, Gomberg-Maitland M, McLaughlin VV, Preston IR, Souza R, Waxman AB, Grunig E, et al. ; STELLAR Trial Investigators. Phase 3 trial of sotatercept for treatment of pulmonary arterial hypertension. N Engl J Med. 2023;388:1478–1490. doi: 10.1056/NEJMoa2213558 - PubMed

Publication types

MeSH terms

Substances

LinkOut - more resources