Selected Ion Extraction of Peptides with Heavy Isotopes and Hydrogen Loss Reduces the Type II Error in Plasma Proteomics
- PMID: 39829503
- PMCID: PMC11739973
- DOI: 10.1021/acsomega.4c05624
Selected Ion Extraction of Peptides with Heavy Isotopes and Hydrogen Loss Reduces the Type II Error in Plasma Proteomics
Abstract
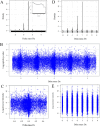
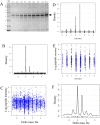
Naturally occurring peptides display a wide mass distribution after ionization due to the presence of heavy isotopes of C, H, N, O, and S and hydrogen loss. There is a crucial need for sensitive methods that collect as much information as possible about all plasma peptide forms. Statistical analysis of the delta mass distribution of peptide precursors from MS/MS spectra that were matched to 63,077 peptide sequences by X!TANDEM revealed Gaussian peaks representing heavy isotopes and hydrogen loss at integer delta mass values of -3, -2, -1, 0, +1, +2, +3, +4, and +5 Da. Human plasma samples were precipitated in acetonitrile, and the resulting proteins were collected over a quaternary amine resin, eluted with NaCl, digested with trypsin, and analyzed by nano liquid chromatography-electrospray ionization-tandem mass spectrometry (LC-ESI-MS/MS) with an orbital ion trap (OIT). Fragment spectra (MS/MS) generated from the OIT data were fit to human fully tryptic peptides by X!TANDEM, which led to the identification of 3,888 protein gene symbols represented by three or more peptides (n ≥ 3). The peptide counts to plasma proteins from experimental MS/MS spectra were corrected against 29 blank LC-ESI-MS/MS spectra and 30 million random MS/MS control spectra to yield 2,784 true positive proteins (n ≥ 3; q ≤ 0.01). Peptides identified by fragmenting ions with Gaussian heavy isotopes and hydrogen loss that were matched to known plasma proteins, such as albumin (ALB), were shown to be true positives and agreed with the peptide sequences identified in the monoisotopic peak. Accepting the ions from the monoisotopic peak alone (±0.1 Da) yielded only 382 plasma proteins (n ≥ 3; type I error q ≤ 0.01; type II error ∼86%). In contrast, accepting all ions within ±0.1 Da around the hydrogen loss, monoisotopic, and heavy isotopic peaks led to the identification of 963 proteins (n ≥ 3; q ≤ 0.01; type II error ∼60%). Using the power of the OIT to resolve the Gaussian peaks from heavy isotopes and hydrogen loss resulted in the identification of three times more proteins with high confidence and a much lower type II error than analyzing peptides from the monoisotopic peak alone. The resolving power of the OIT may be exploited to increase observation frequencies and provide greater proteomic coverage and statistical power in comparative proteomics studies.
© 2025 The Authors. Published by American Chemical Society.
Conflict of interest statement
The authors declare no competing financial interest.
Figures


Similar articles
-
Comparison of the Human Plasma Peptides from the Fit of Fragmentation Spectra versus Accurate Monoisotopic Precursor Mass.ACS Omega. 2025 Mar 10;10(11):10796-10811. doi: 10.1021/acsomega.4c06211. eCollection 2025 Mar 25. ACS Omega. 2025. PMID: 40160755 Free PMC article.
-
Trypsin Digestion Conditions of Human Plasma for Observation of Peptides and Proteins from Tandem Mass Spectrometry.ACS Omega. 2024 Sep 24;9(40):41343-41354. doi: 10.1021/acsomega.4c03955. eCollection 2024 Oct 8. ACS Omega. 2024. PMID: 39398168 Free PMC article.
-
The plasma peptidome.Clin Proteomics. 2018 Dec 1;15:39. doi: 10.1186/s12014-018-9211-3. eCollection 2018. Clin Proteomics. 2018. PMID: 30519149 Free PMC article.
-
Forced degradation and impurity profiling: recent trends in analytical perspectives.J Pharm Biomed Anal. 2013 Dec;86:11-35. doi: 10.1016/j.jpba.2013.07.013. Epub 2013 Jul 31. J Pharm Biomed Anal. 2013. PMID: 23969330 Review.
-
Trends in the Design of New Isobaric Labeling Reagents for Quantitative Proteomics.Molecules. 2019 Feb 15;24(4):701. doi: 10.3390/molecules24040701. Molecules. 2019. PMID: 30781343 Free PMC article. Review.
References
-
- Popovic Z.; et al. Analysis of Isotopically Depleted Proteins Derived from Escherichia coli and Caenorhabditis elegans Cell Lines by Liquid Chromatography 21 T Fourier Transform-Ion Cyclotron Resonance Mass Spectrometry. J. Am. Soc. Mass Spectrom. 2023, 34 (2), 137–144. 10.1021/jasms.2c00242. - DOI - PubMed
-
- Florentinus A. K.; et al. Identification and quantification of peptides and proteins secreted from prostate epithelial cells by unbiased liquid chromatography tandem mass spectrometry using goodness of fit and analysis of variance. Journal of proteomics 2012, 75, 1303–1317. 10.1016/j.jprot.2011.11.002. - DOI - PubMed
LinkOut - more resources
Full Text Sources
Miscellaneous
