doi: 10.4081/ijfs.2024.13488.
eCollection 2024 Nov 12.
EAVLD 2024 - 7th Congress of the European Association of Veterinary Laboratory Diagnosticians
- PMID: 39829721
- PMCID: PMC11740014
- DOI: 10.4081/ijfs.2024.13488
Item in Clipboard
EAVLD 2024 - 7th Congress of the European Association of Veterinary Laboratory Diagnosticians
Ital J Food Saf.
.
Abstract
This abstract book contains the abstracts presented at the 7th Congress of the European Association of Veterinary Laboratory Diagnosticians.
Copyright © 2024, the Author(s).
Figures

One Health Unit (Photo Credits: Micol Fascendin).
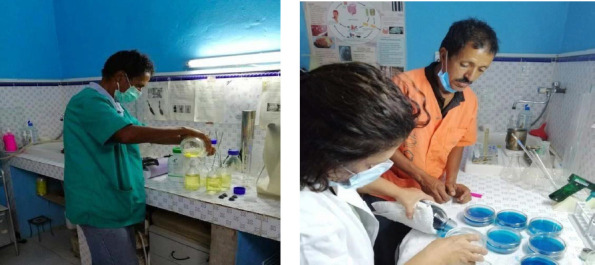
Activities carried out in the veterinary laboratory in Saharawi refugees camps (Photo Credits: Sara Di Lello, VSF Italy).
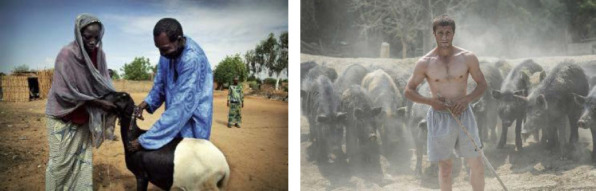
PPR vaccination in Niger (Photo Credits: Tim Dirven, VSF Belgium.) and a breeder of East Balkan Swine, the last indigenous pig breed of Bulgaria now threatened by ASF (Photo Credits, Alessandro Cristalli, VSF Italy)
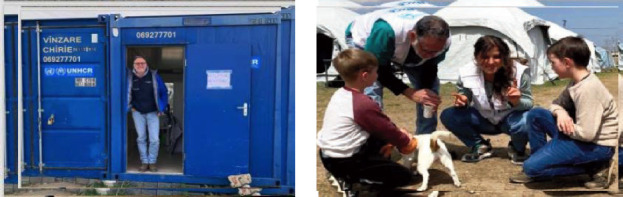
Mobile Pet Clinics in Moldova, close to the Ukrainian border (photo credit, Pierangeloni Casale, VSF Italy)
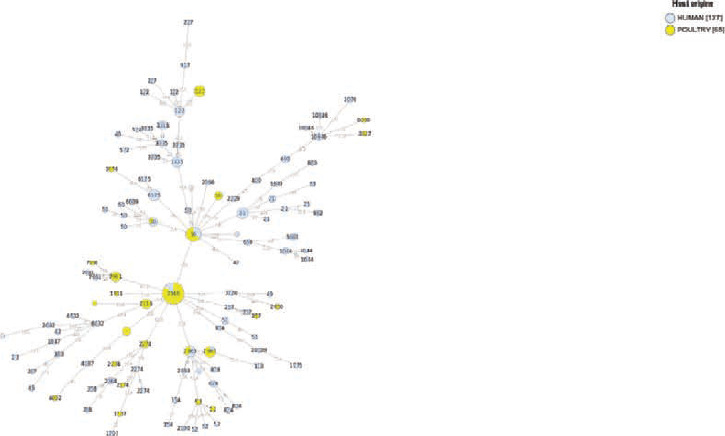
Minimum spanning tree (MST) generated for C. jejuni isolates based on cgMLST profiles. The distance labels correspond to the number of discriminating alleles. The yellow nodes correspond to poultry isolates and the blue nodes to human isolates.
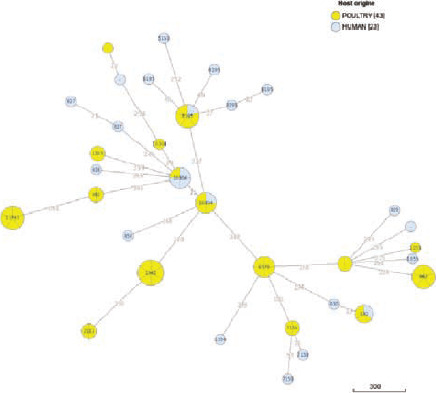
Minimum spanning tree (MST) generated for C. coli isolates based on cgMLST profiles. The distance labels correspond to the number of discriminating alleles. The yellow nodes correspond to poultry isolates and the blue nodes to human isolates.
Antimicrobial resistance determinants in top-soil improvers.
Antimicrobial resistance determinants in irrigation water samples.
Co-occurrence of antibiotic and heavy metal resistance genes in TSI and irrigation water.
Neighbor-joining phylogenetic tree based on the complete genomes of domestic cat hepadnavirus (DCH). The tree was elaborated using the alignment the full-length nucleotide sequence of DCH strains generated in this study and the cognate sequences of DCH strains retrieved from GenBank database.
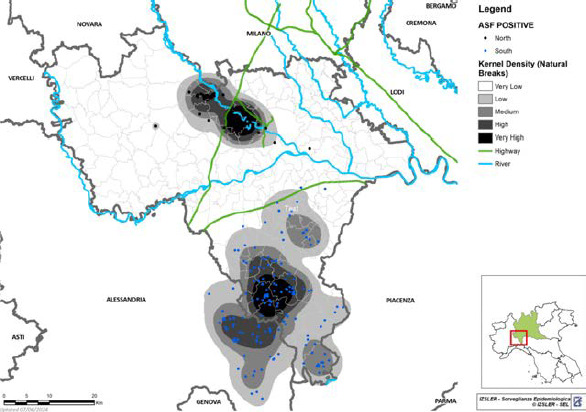
Kernel density map of positive wild boar in Pavia
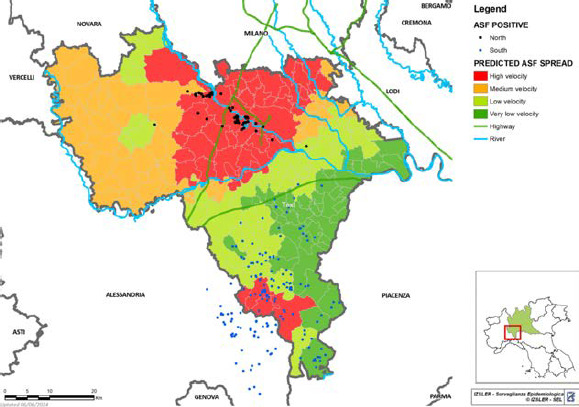
Map representing the speed of ASF transmission at municipality level (Kriging method)
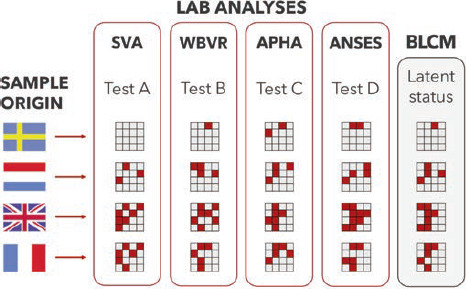
Schematic view of the study design of the inter-laboratory diagnostic test evaluation and the role of the Bayesian latent class model (BLCM) to determine the latent status (the unknown true disease status) of each sample.
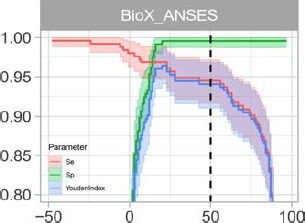
Receiver operating characteristic (ROC) curve of the Bio-X Monoscreen Ab ELISA BVDV test as performed by ANSES, indicating sensitivity (red), specificity (green) and YoudenIndex (blue). The dashed vertical line indicates the cut-off used.
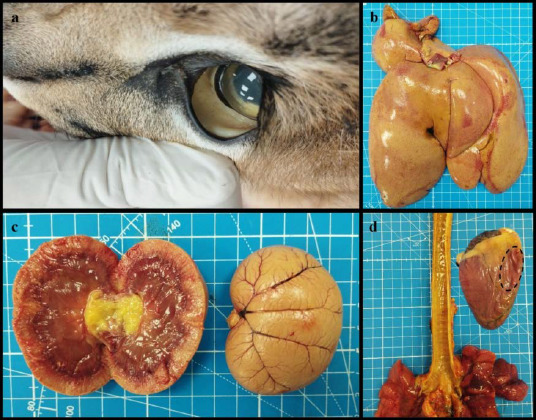
Macroscopical findings at the necropsy examination of the caracal. (a) Jaundiced ocular mucosa. (b) Jaundiced and enlarged liver. (c) Jaundiced sectioned and intact kidney with hypervascularization. (d) Jaundiced trachea and heart with left atrioventricular deflection (black target)
Macroscopical findings at the necropsy examination of the caracal. (a) Jaundiced ocular mucosa. (b) Jaundiced and enlarged liver. (c) Jaundiced sectioned and intact kidney with hypervascularization. (d) Jaundiced trachea and heart with left atrioventricular deflection (black target).
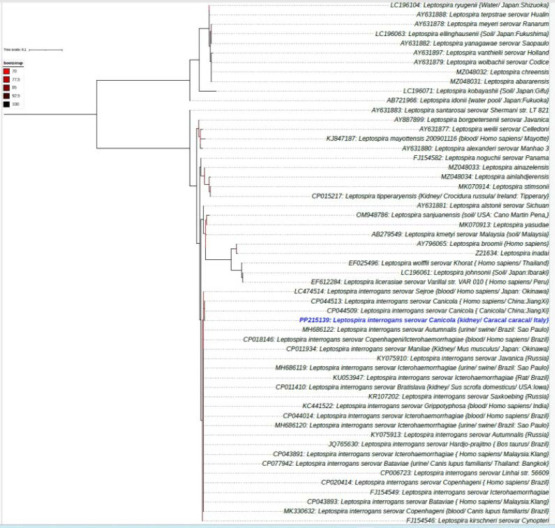
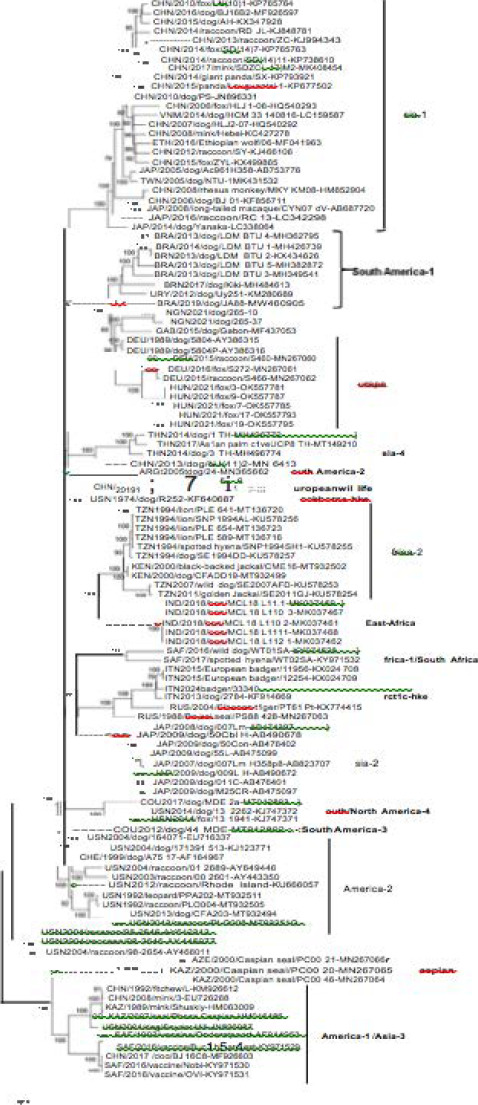
Phylogenetic relationship of Leptospira interrogans serovar Canicola in Caracal caracal of this study with those from different hosts and countries. The phylogenetic analysis was based on 307bp LipL32 gene sequences of Leptospira spp. The maximum likelihood phylogeny was run under 100,000 bootstrap replications, best fit model was selected using Iqtree software and final tree was edited by Itools. Bold blue indicates the sequence type amplified in this study.
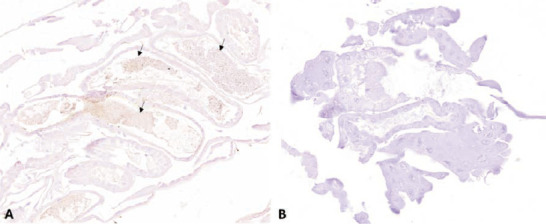
A: larvae fed on BVDV-infected lung tissue samples showed a moderate amount of anti-BVD immunopositive amorphous material in the alimentary tract (arrows). Figure 1B: larvae fed on BVDV-free tissue sample (group C) showing no reactivity to anti-BVD antibody.
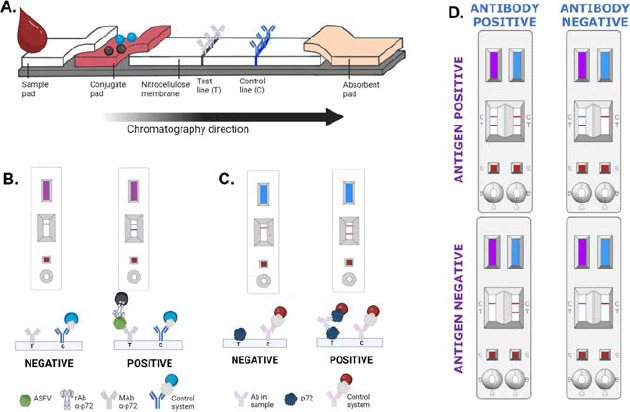
(A) General scheme of the lateral flow strip. (B) Result interpretation for the INgezim® ASFV CROM Ag 2.0, purple strip. (C) Result interpretation for INgezim® ASFV CROM Ab 2.0, blue strip. (D) Result interpretation for INgezim® ASFV Combo CROM Ag/Ab (GSD Madrid, Madrid, Spain). Created with Biorender.com .
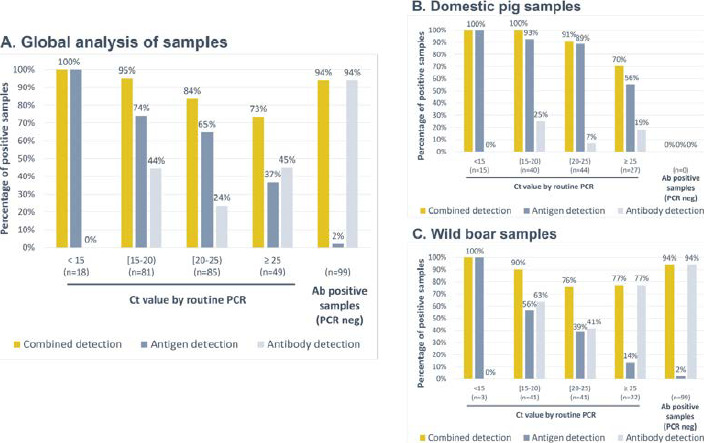
(A) Analysis of field blood samples with the INgezim® ASFV Combo CROM Ag/Ab assay. (B) Result obtained only for domestic pig samples. (C) Result obtained only for wild boar samples. Combined detection results show the percentage of positive samples by any of the strips included in the cassette, antigen, or antibody. Antigen detection shows percentages of positive results obtained only with the antigen detection strip. Antibody detection shows percentages of positive results obtained only with the antibody detection strip. The X-axis shows the groups of samples divided according to their viral load by PCR (Cq). The Y-axis shows the percentage of positive samples in each group.
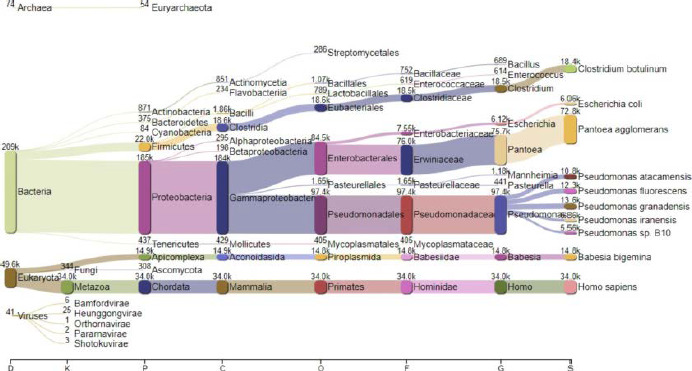
Sankey map for classified long-reads from Sample BRD_236. Vertical bars: read counts for each taxon (indicated in parenthesis); horizontal line: taxonomic levels (domain, kingdom, phylum, class, order, family, genus, species).
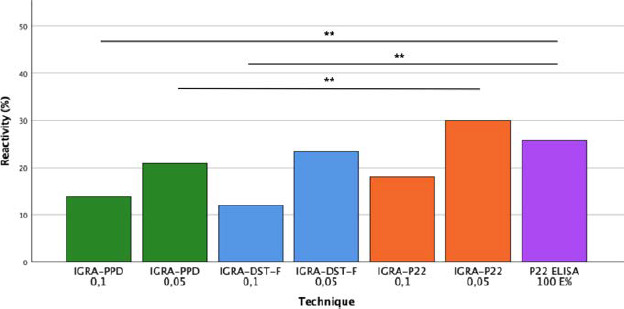
Percentage of reactors (%) observed in the IGRA-PPD (green), IGRA-DST-F (blue), IGRA-P22 (orange) and the indirect P22 ELISA (purple) techniques in the present study. ** p<0.01; Cochram´s Q test.
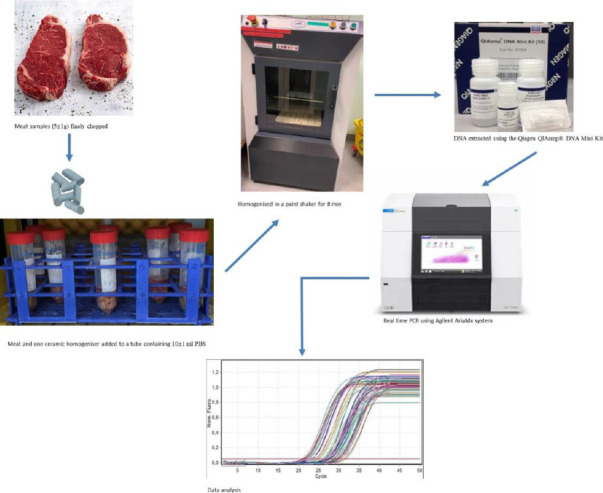
The workflow of meat homogenisation, DNA extraction and real time PCR.
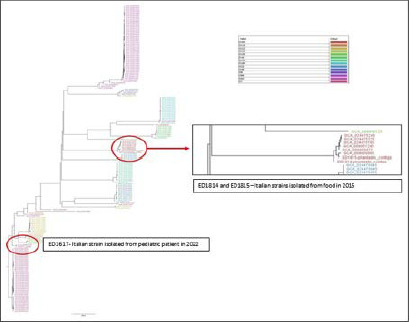
cgMLST analysis revealed a high correlation of strains ED1814 and ED1815 with Stx2k-producing E. coli isolated in China in 2013 (STEC316).
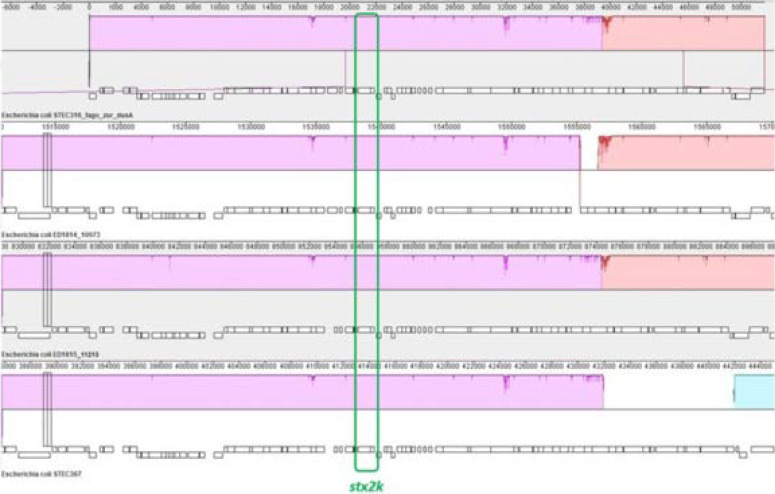
MAUVE alignment of the stx2k bacteriophage sequences identified in strains ED1814 and ED1815 with two stx2k bacteriophages described by Yang et al. (STEC316, STEC367).
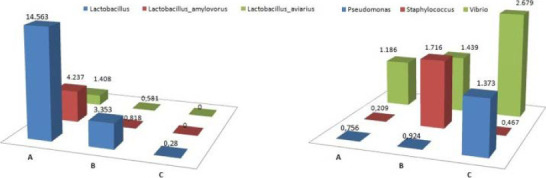
Comparison of seabream at different ages, size A) <3 gr., size B) 3-6 gr., size C) >6 gr.: Lactobacillus taxa (beneficial) are significant related to the youngest age A, whereas Staphylococcus, Pseudomonas, Vibrio (pathogens) characterize the older stages B, C.
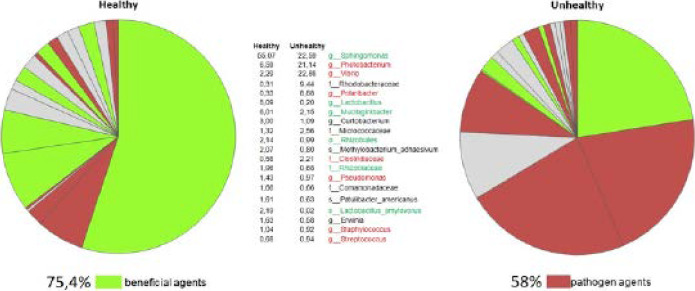
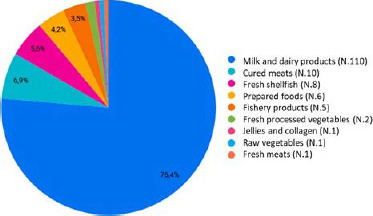
Comparison of seabream between the categories healthy (24) and unhealthy (20) samples, considering the 20 most abundant taxa: healthy samples are characterized by beneficial taxa (in green) for 75,4%, and unhealthy are characterized by pathogen taxa (in red) for 58%. In grey taxa considered neutral.
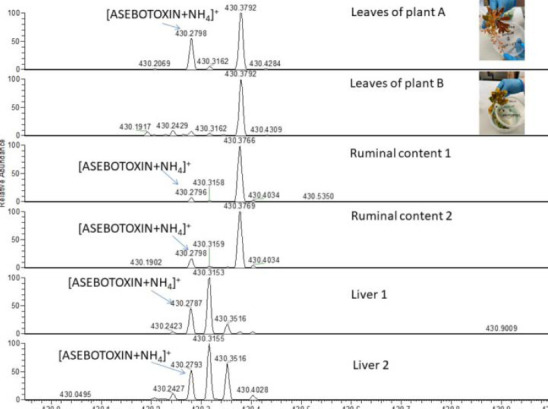
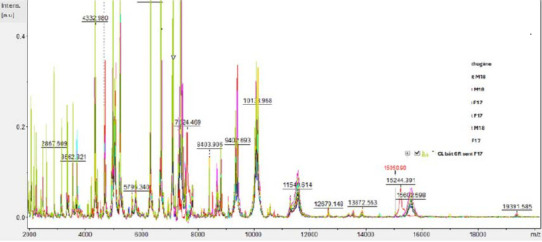
DART-HRMS spectrum of the chemical fingerprinting of: plant leaves A, plant leaves B, goat rumen contents 1, goat rumen contents 2, goat liver 1 and goat liver 2. The toxin Asebotoxin is observed (also called Grayanotoxin I or Andromedotoxin)
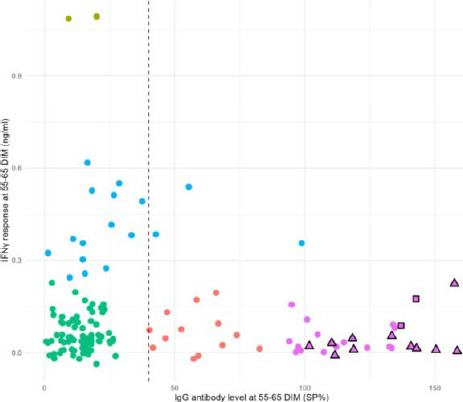
Cluster analysis of dairy cows’ C. burnetii IgG antibody level (sample to positive ratio (SP%)) and whole blood IFN-gamma response to C. burnetii stimulation (ng/ml) measured at 55-65 days in milk (DIM). Shapes indicate milk PCR result at 190 DIM (n = 133 cows that were sampled at the final time point): circles = cows with PCR-negative milk; squares = cows with PCR-suspect positive milk; triangles = cows with PCR-positive milk. Serum IgG antibody levels were analysed by a commercial ELISA (dashed line = seropositivity threshold). IFN-gamma response was determined by stimulating whole blood with C. burnetii and measuring using an ELISA. Colours indicate clusters as determined by k-means cluster analysis.
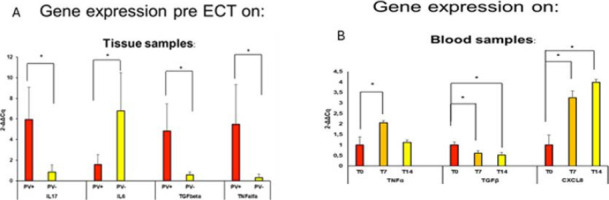
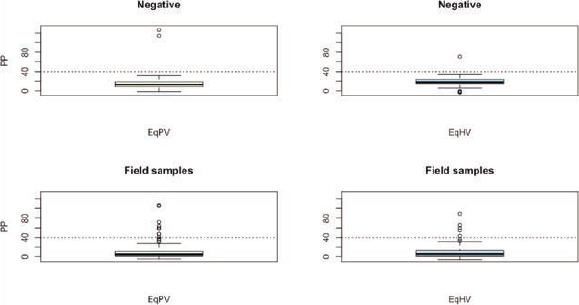
Gene expression on (A) tissue samples positive and negative to PV and (B) on blood samples after ECT
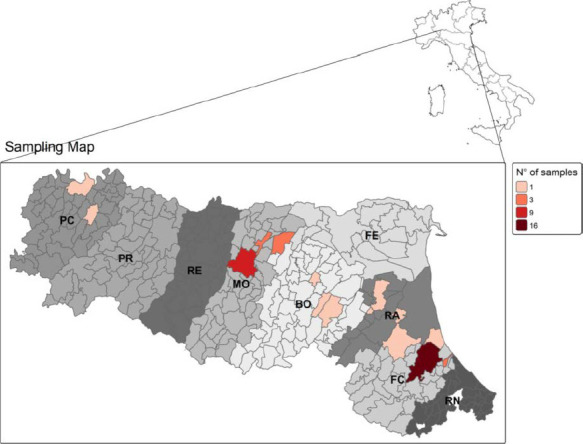
Map of municipalities where rodents were sampled. Each municipality is coloured in a shade of red, proportionally to the number of sampled animals. For 23 other rodents sampled in the provinces of Forlì-Cesena and Ravenna, the exact municipality could not be known due to privacy reasons, therefore they are not represented in this map.
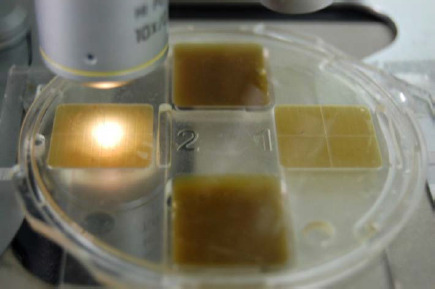
Mini-FLOTAC.
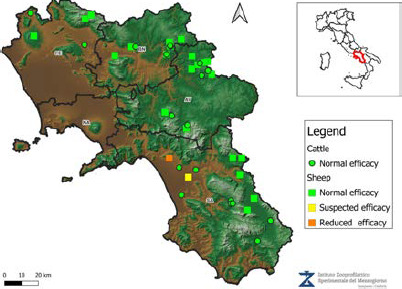
Distribution of anthelmintic efficacy in cattle and sheep farms of Campania region.
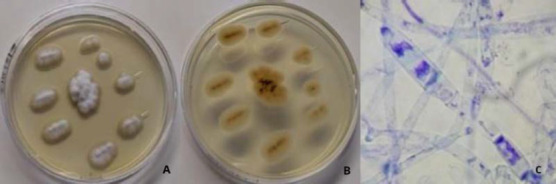
Macroscopical (A, B) and microscopical (C) features of Trichophyton indotineae.
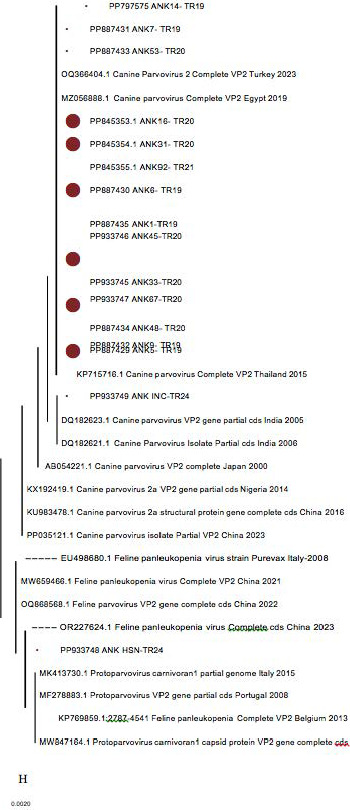
Phylogenetic Tree of Positive FPV Samples.
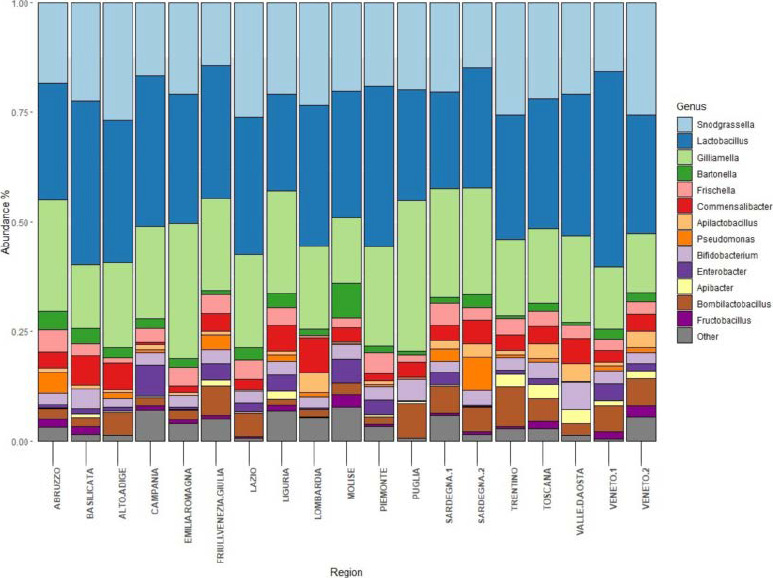
Taxonomic composition of the A. mellifera microbial community of 19 apiaries from 17 different Italian regions. The barplots represent the relative abundance (expressed as a percentage) of the bacterial genera detected in at least the 5% of apiaries and whose number of total counts was >20.
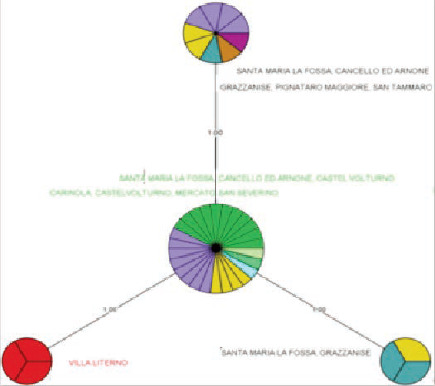
MLVA analysis shows 4 distinct genetic profiles distibuted in the Campania region
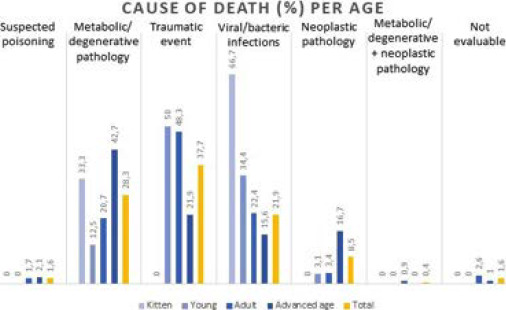
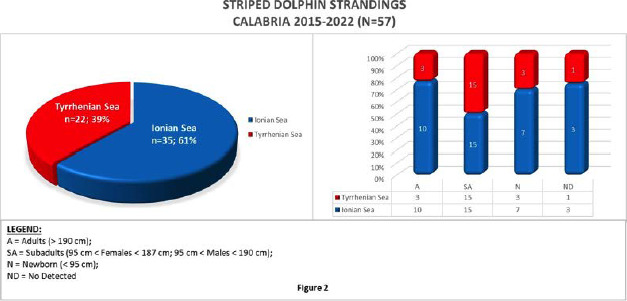
Cause of death (%) per age.
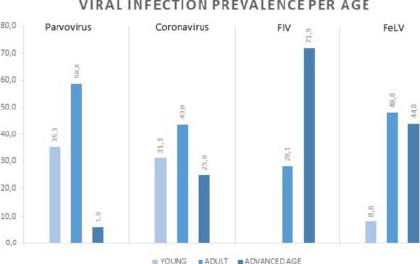
Viral infections prevalence per age. Kitten are not shown (one positivity to herpesvirus)
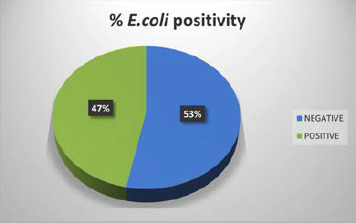
E. coli positivity.
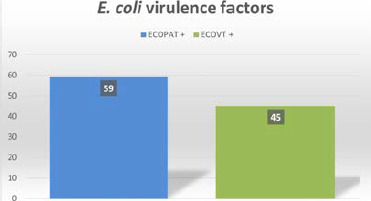
E. coli virulence factors.
Smooth punctiform Erysipelothrix colonies on Columbia CNA agar.
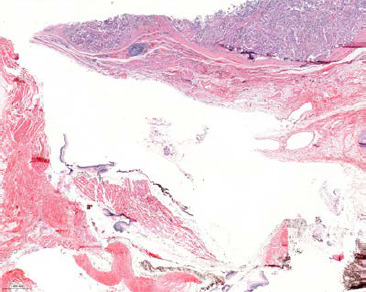
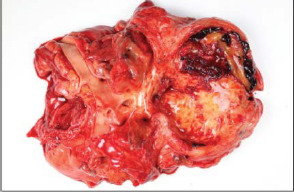
Retrobulbar paraganglioma, hematoxylin and eosin, panoramic view. Neoplastic epithelial polygonal cells divided in packets and nests by fibrovascular stroma.
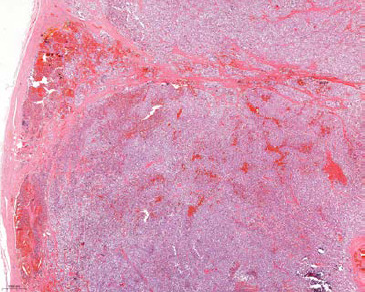
Left and right atrium paraganglioma hematoxylin and eosin (10x). Polygonal neoplastic cells grouped in nests separated by thin fibrovascular septae, “Zellballen aspect”, infiltrating myocardiocytes fibers.
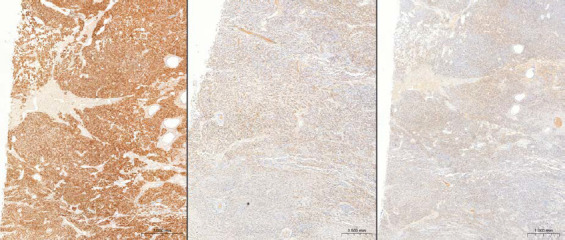
Left and right atrium paraganglioma (10x) IHC, Strong positivity to Synaptophysin (A), and mild positivity to S-100 (B)and Chromogranin-A (C).
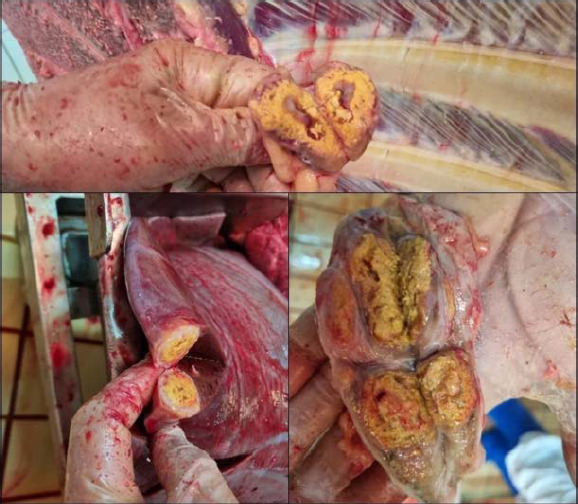
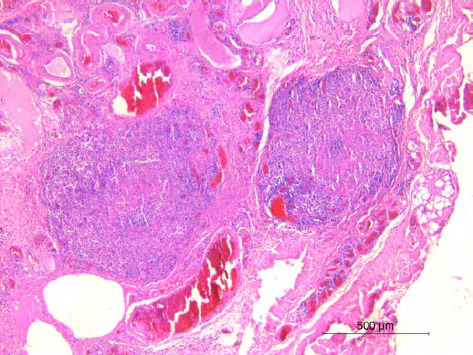
Calcified granulomas in the liver and lymph-nodes.
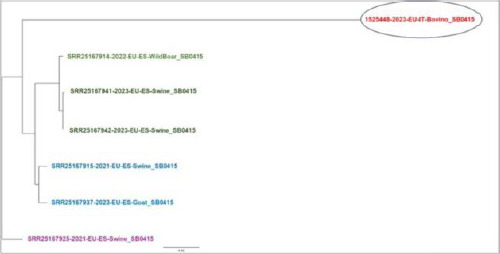
Phylogenetic relationship of Mycobacterium caprae SB0415 strains.
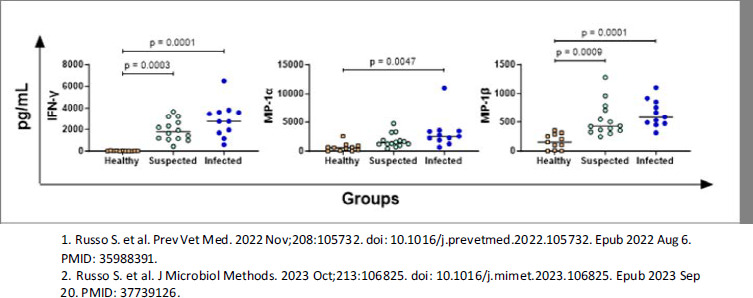
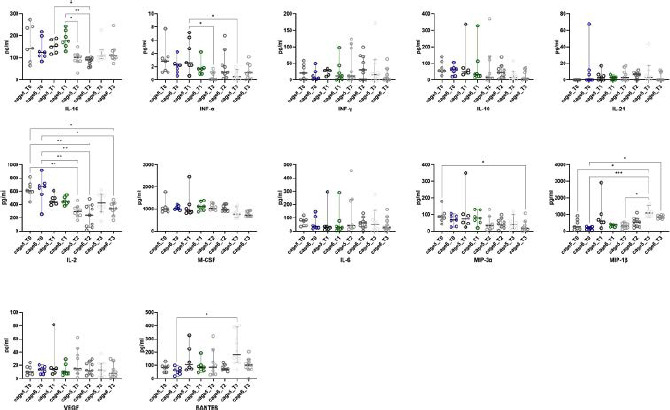
IFN-, MIP-1alpha and MIP-1beta production in whole blood from water buffalo. Heparin blood from TB infected (n=11), TB suspected (n=14) and healthy (n=11) animals were collected. Whole blood was stimulated with PPDB, alongside antigen nil control (PBS). After 16-24 h, plasma were collected, and levels of cytokines were determined by multiplex ELISA. Specific cytokine responses to TB were determined by subtracting baseline cytokine levels (PBS) from those measured in the TB-antigen condition (PPDB stimulation). Differences between groups are displayed and p value < 0.05 were considered statistically significant.
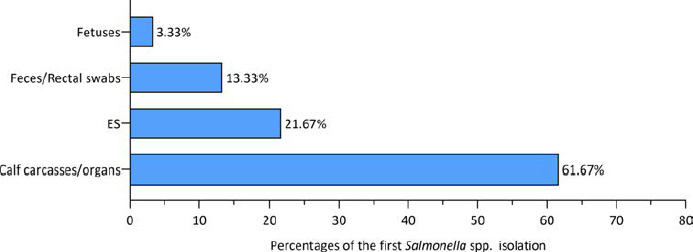
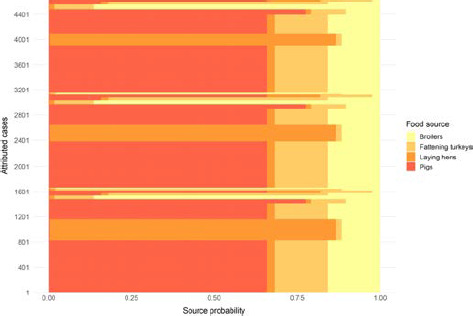
percentages of the first Salmonella isolations in the farm according to their source. ES: emergency slaughter samples.
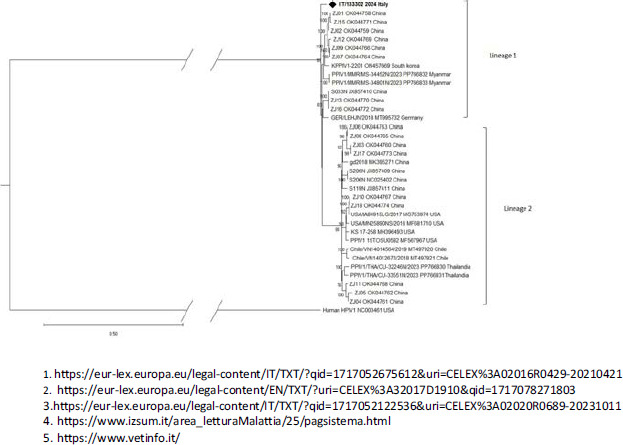
Phylogenetic analysis of Italian complete genomes PRV1 strain (black rhombus) with global PRV1 strains available in GenBank. Human Respirovirus 1 was used as an outgroup.
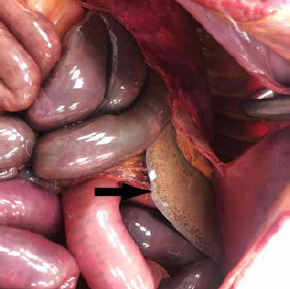
Macroscopic appearance: DIC, splenic hemorrhagic petechiae (arrow).
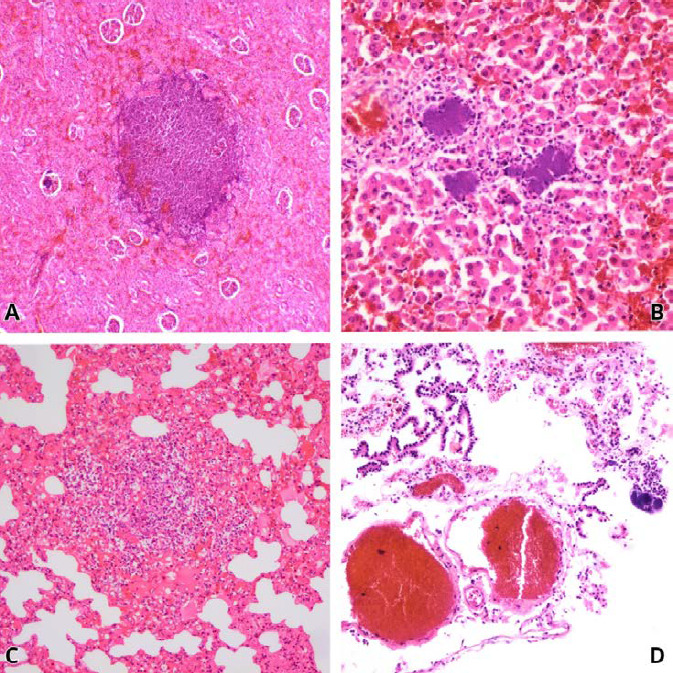
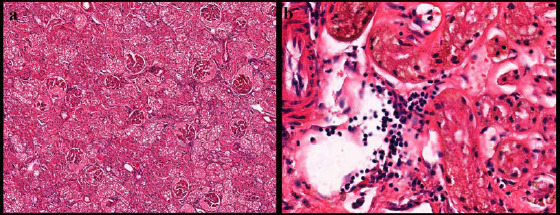
Microscropic view: A interstitial nephritis with a follicular pattern. Presence of one focus of neutrophils with toxic granulation; B purulent necrotic hepatitis associated with bacterial colonies; C purulent interstitial pneumonia; D purulent plexochoroiditis associated with bacterial colonies.
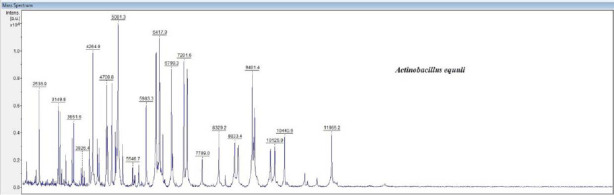
MALDI TOF spectrum of Actinobacillus equuli strain.
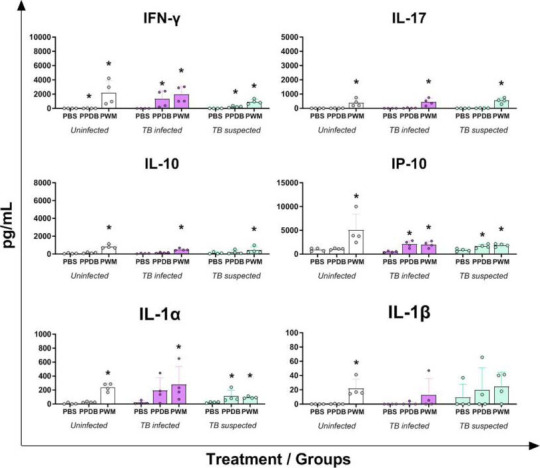
IFN-, IL-17, IL-10, IP-10, IL-1alpha and IL-1beta production in whole blood from cattle. Heparin blood from TB infected (n=4), TB suspected (n=4), and uninfected (n=4) cattle, were collected. Whole blood was stimulated for 16-24h with PBS, PPDB, Mitogen (PWM). Plasma levels of IFN- IL-17, IL-10, IP-10, IL-1alpha and IL-1beta were evaluated with MILLIPLEX® kit ELISA. Differences between treatments (PBS vs PPDB; PBS vs PWM) were assessed using a Mann- Whitney test and p value < 0.05 were considered statistically significant; * p < 0.05.
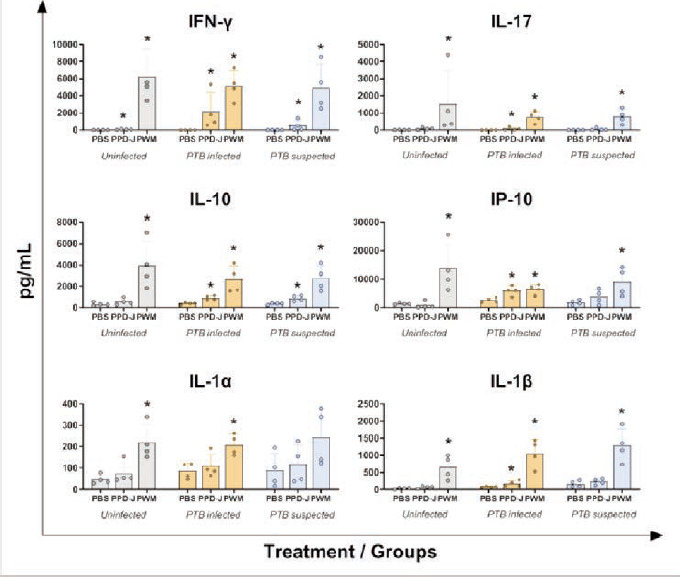
IFN-, IL-17, IL-10, IP-10, IL-1alpha and IL-1beta production in whole blood from cattle. Heparin blood from PTB infected (n=4), PTB suspected (n=4), and uninfected (n=4) cattle, were collected. For all the groups, whole blood was stimulated for 16-24h with PBS, Johnin PPD (PPDJ), Mitogen (PWM). Plasma levels of IFN- IL-17, IL-10, IP-10, IL-1alpha and IL-1beta were evaluated with MILLIPLEX® ELISA kit. Differences between treatments (PBS vs PPDJ; PBS vs PWM) were assessed using a Mann-Whitney test and p value < 0.05 were considered statistically significant; * p < 0.05.
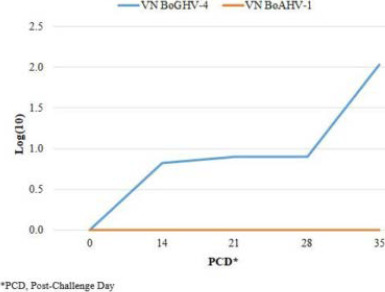
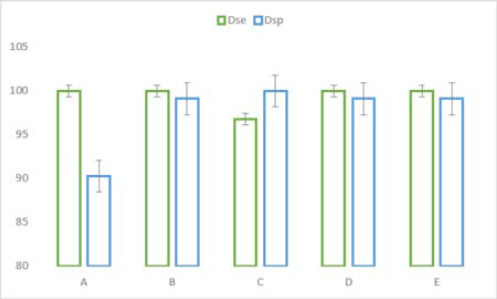
Serum samples of calves experimental infected with BoGHV-4 tested, in different work sessions, by VN assays against BoGHV-4 and BoAHV-1.
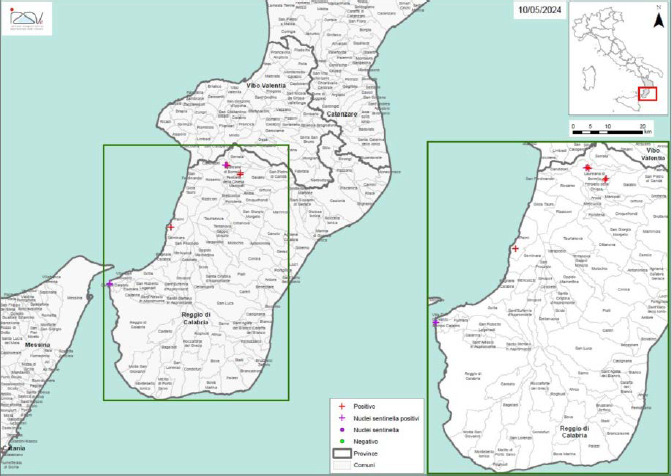
Protection zone of the Calabria_IZSVE
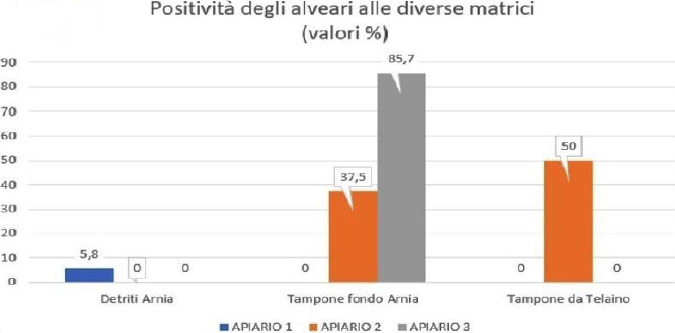
Positive effect of hives in different matrices (values expressed as %).
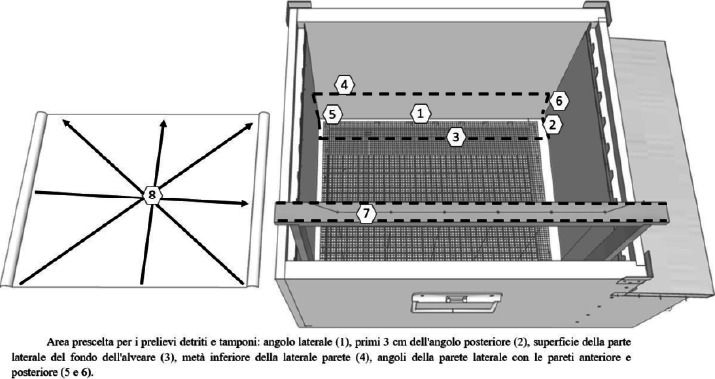
Selected area for debris and swabs.
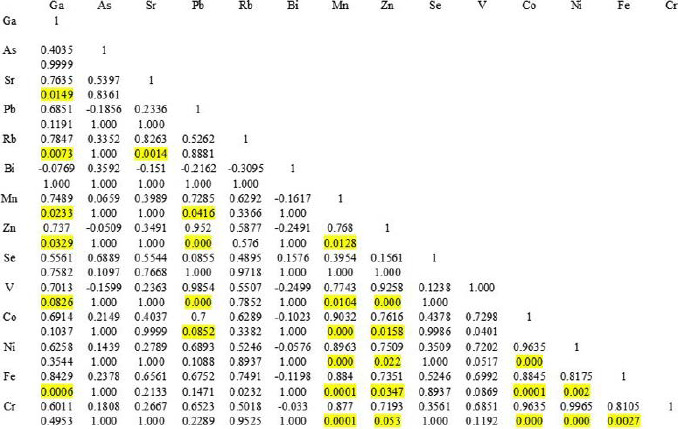
Spearman correlation coefficients (rs) and p-values between pairs of elements within the albumen of C. caretta eggs from Campania nesting sites. Significant correlations are highlighted in yellow.
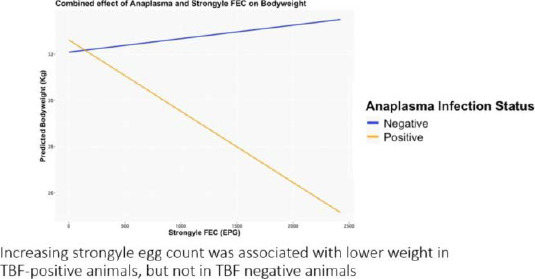
Interaction between TBF status and Fecal Egg Count (FEC)
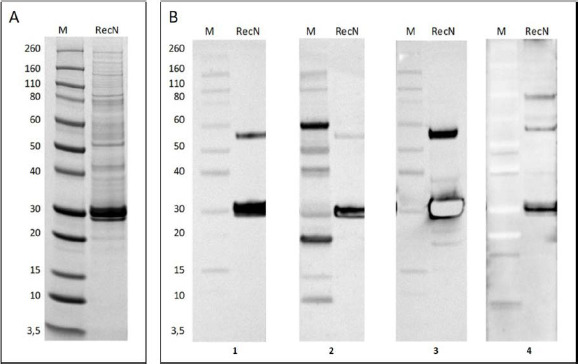
A) Coomassie Blue staining of purified RVF recombinant N protein. B) Western blot of purified RVF recN-protein using antiRift Valley Fever NP Monoclonal antibody (1); His-tag antibody anti 6xHis C-term (2); V5-tag antibody (3); positive serum (4).
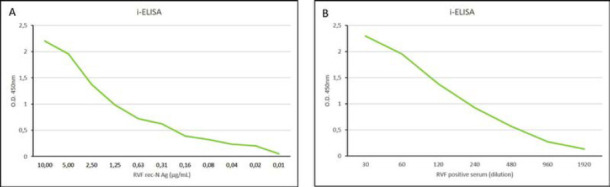
A) Indirect-ELISA using serial dilutions of RVF recN as antigen and RVF positive serum. B) Indirect-ELISA using RVF recN as antigen and RVF positive serum at serial dilutions.
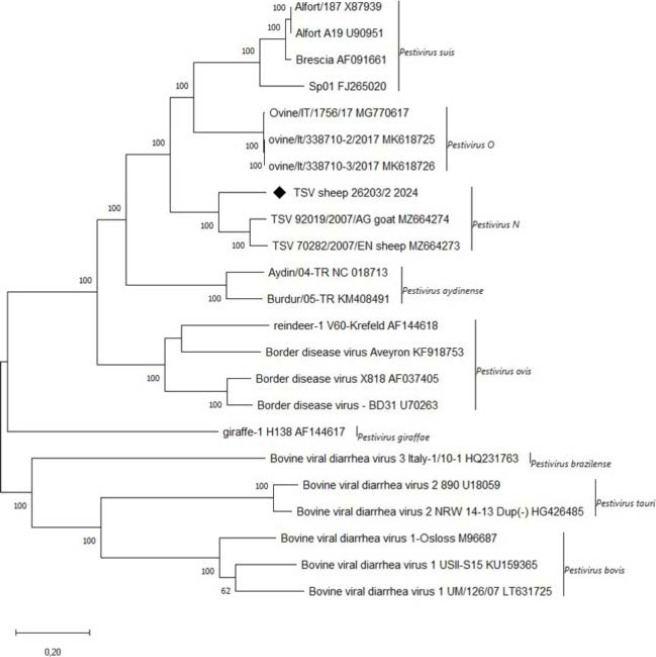
Maximum Likelihood phylogenetic tree, based on the complete genomes of the 26203/2_2024 Pestivirus N (black rhombus) and other pestivirus sequences deposited in GenBank.
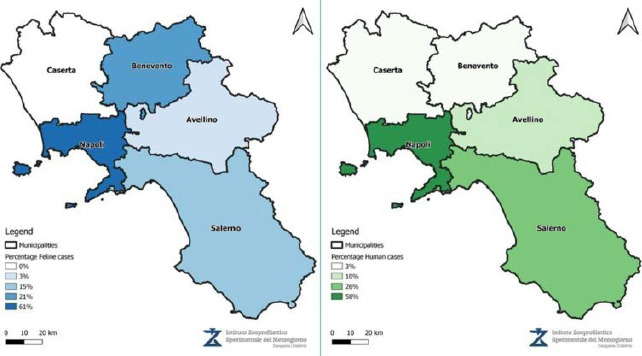
Cases in Human (2017-2024) and Feline (2022-2024) based on Municipalities
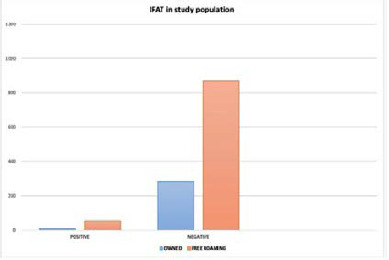
IFAT results between owned and free roaming cats.
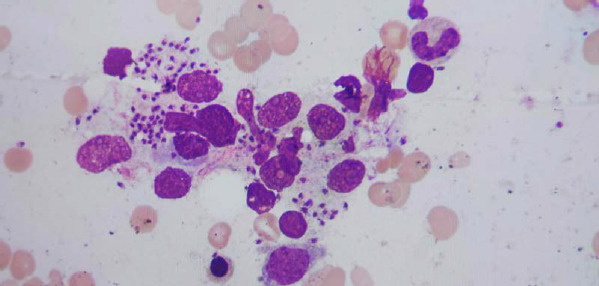
MGG Staining Method in Human Blood smear.
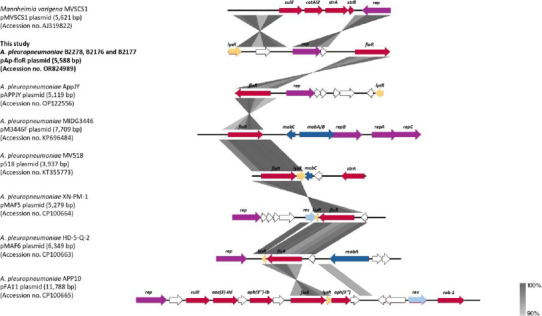
Linear map of the pAp-floR plasmid of A. pleuropneumoniae strains B2176 and B2177 compared, using Ea- syfig (https://mjsull.github.io/Easyfig/ ), both with the pMVSCS1 plasmid of M. varigena and with three plasmids floR of A. pleuropneumoniae: (i) pMAF5 of A. pleuropneumoniae XN-PM-1; (ii) pMAF6 from A. pleuropneumoniae HD-5-Q-2; (iii) pFA11 of A. pleuropneumoniae APP10. The positions and transcriptional direction of the ORFs are rep-resented by colored arrows. All antibiotic resistance determinants and relevant plasmid genes are also shown.
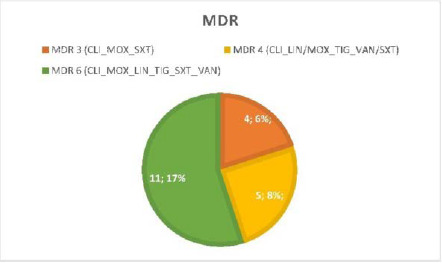
Number and % of MDR strains. Sensitive strains to all antimicrobial were 24 (38%), 11 strains (17%) were 6 MDR, 4 (6%) were 3 and 4 MDR, one strain (2%) were MDR 5.
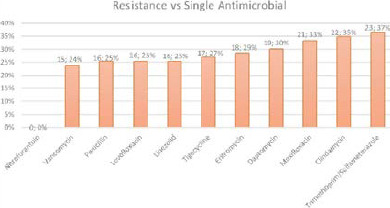
Number and % of resistance vs single antimicrobial. Notably 16 (25%) strains were resistant to Penicillin.
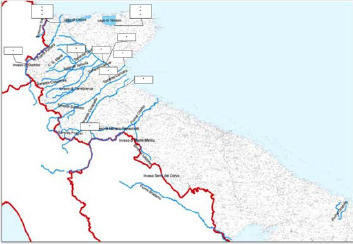
Map of sampling.
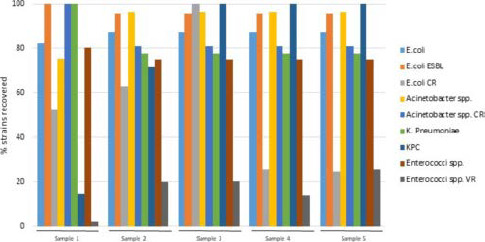
Recovery percentages of the mock community after contaminating 5 wastewater (WW) samples with the Mock Community MC.
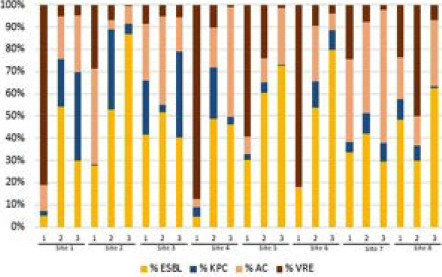
Results of the percentages of antibiotic-resistant bacteria (ARB) for three distinct bacterial groups (indicated by the colors yellow, rose, brown and blue) in wastewater (WW) samples collected from various sampling sites over the course of three months.
Prevalence of antibiotic resistance in mastitis bacteria isolated from dairy sheep milk (2023-2024).
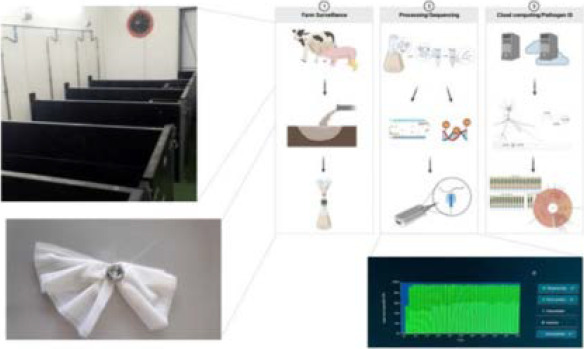
Graphical abstract of the study.
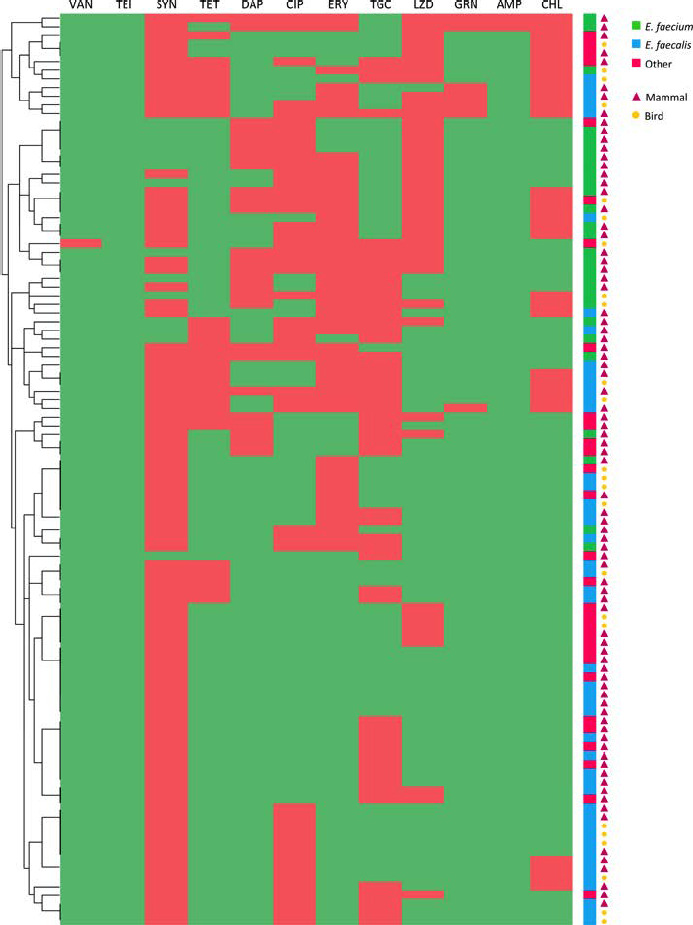
Heat map depicting phenotypic AMR profiles of the strain collection. Resistance to antimicrobials is shown in red, while sensitivity in green. The dendogram on the left represents clustering of Enterococcus isolates according to their phenotypic AMR profile. Additional strain information (Enterococcus species and source) is provided in the columns on the right of the heatmap. VAN= vancomycin; TEI: teicoplanin; SYN= quinupristin/dalfopristin.
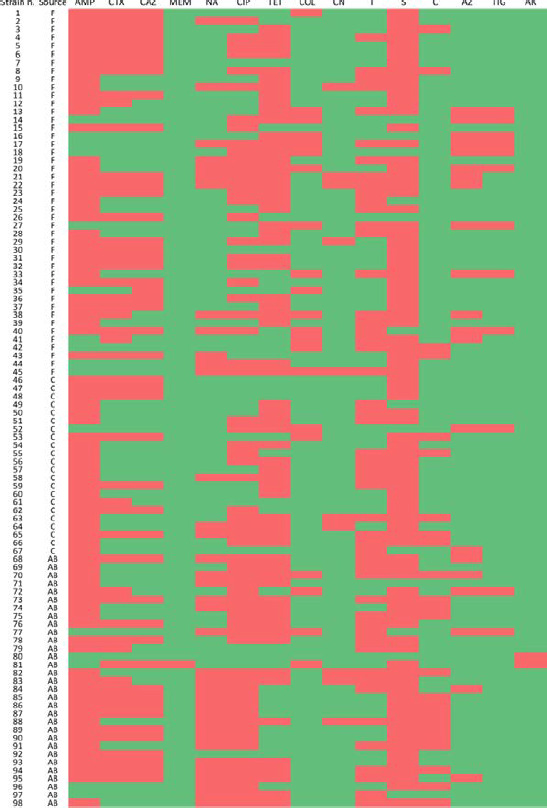
Animal sources (F= foxes, C= corvids, AB= aquatic birds) and antimicrobial resistance profile of the 98 MDR Escherichia coli isolates. Phenotypic resistance to antimicrobials is shown in red, absence in green. AMP= ampicillin, CTX= cefotaxime, CAZ= ceftazidime, MEM= meropenem, NA= nalidixic acid, CIP: ciprofloxacin, TET= tetracycline, COL= colistin, CN= gentamicin, T= trimethoprim, S= sulfa2m50ethoxazole, C= chloramphenicol, AZ= azithromycin, TIG= tigecycline, AK= amikacin.
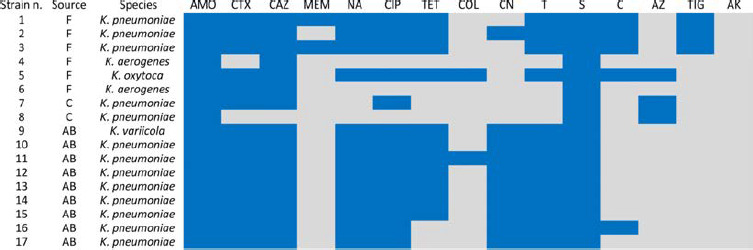
Animal sources (F= foxes, C= corvids, AB= aquatic birds), Klebsiella species and antimicrobial resistance profile of the 17 MDR Klebsiella spp. isolates. Phenotypic resistance to antimicrobials is shown in blue, absence in grey. AMP= ampicillin, CTX= cefotaxime, CAZ= ceftazidime, MEM= meropenem, NA= nalidixic acid, CIP: ciprofloxacin, TET= tetracycline, COL= colistin, CN= gentamicin, T= trimethoprim, S= sulfamethoxazole, C= chloramphenicol, AZ= azithromycin, TIG= tigecycline, AK= amikacin.
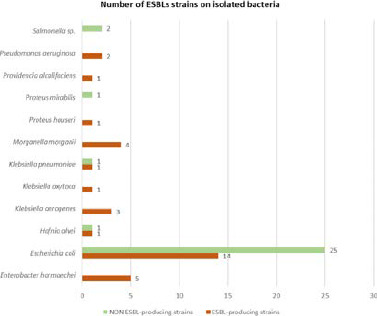
Number of ESBL-producer strains considering all the isolated bacteria. Phenotypically, 33 out of 63 strains isolated from faecal samples exhibited an ESBL-producer profile.
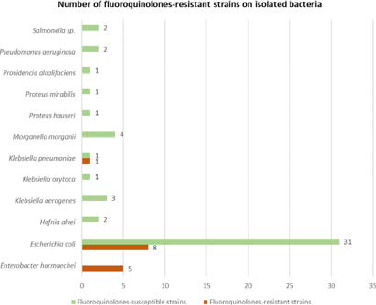
Number of fluoroquinolones-resistant strains considering all the isolated bacteria. Phenotypically, 14 out of 63 strains isolated from faecal samples were recognized as fluoroquinolones-resistant.
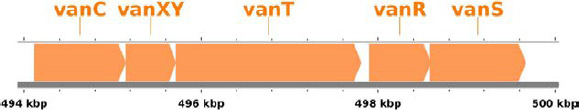
Organization of enterococcal vancomycin-resistance gene cluster in the vanC Enterococcus gallinarum, isolated from a wild owl.
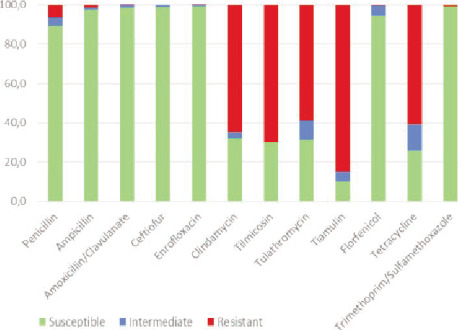
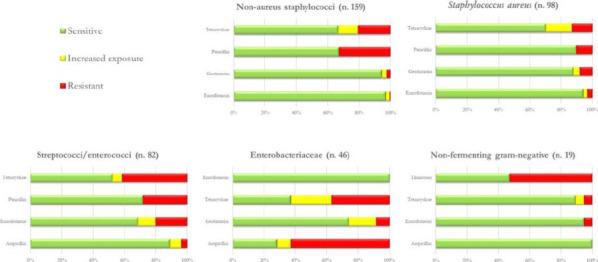
Percentage representation of susceptible, intermediate susceptible and resistant strains of S. suis. (n=525).
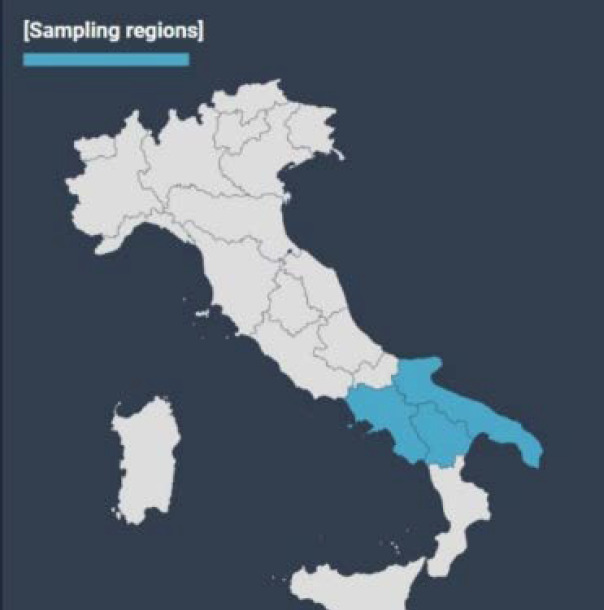
Map of sampling regions. The areas from which the tested samples originated are marked in light blue.
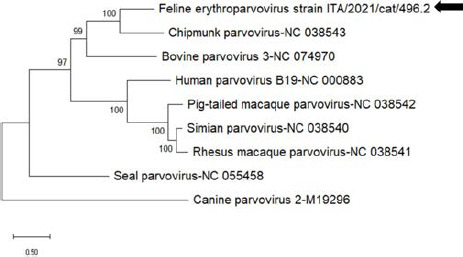
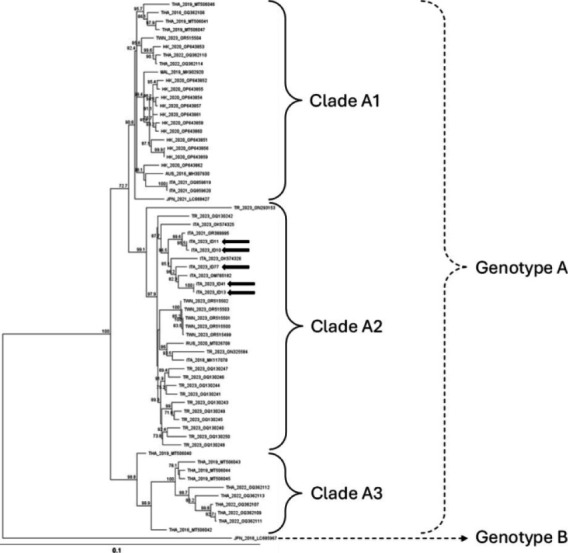
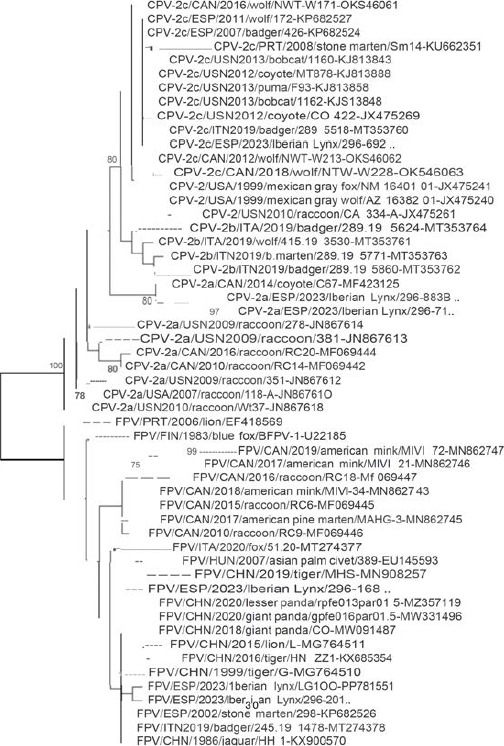
Full-genome-based unrooted phylogenetic tree of Feline Erythroparvovirus identified in this study and reference strains recovered in the GenBank database. The Maximum Likelihood method and LG model with a gamma distribution and invariable sites were used for the phylogeny. A total of 1000 bootstrap replicates were used to estimate the robustness of the individual nodes on the phylogenetic tree. Bootstrap values greater than 75% were indicated. Black arrows indicate strain detected in this study. Numbers of aminoacid substitutions are indicated by the scale bar.
Cranial mesenteric artery from a horse. Visible are endarteritis characterized by thickening of the arterial wall, roughening of the tunica intima, and a large intraluminal thrombus (arrow).
Cranial mesenteric artery from a horse. In addition to endarteritis and thrombosis, there is marked aneurysmal dilation of the cranial mesentenc artery.
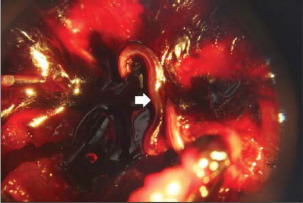
Cranial mesenteric artery from a horse, viewed through a dissecting microscope. Visible are 2 slender, larval nematodes embedded within the thrombus (arrow).
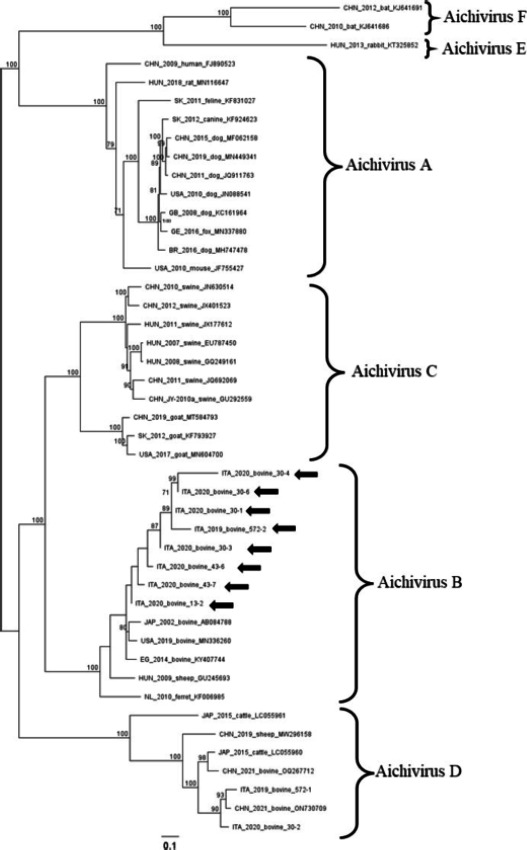
Phylogenetic reconstruction based on partial KoV sequences obtained in this study (arrows) and hit sequences obtained from the Genbank databases. Statistical support was determined using 1000 bootstrap replicates, with gamma distribution and invariant sites.
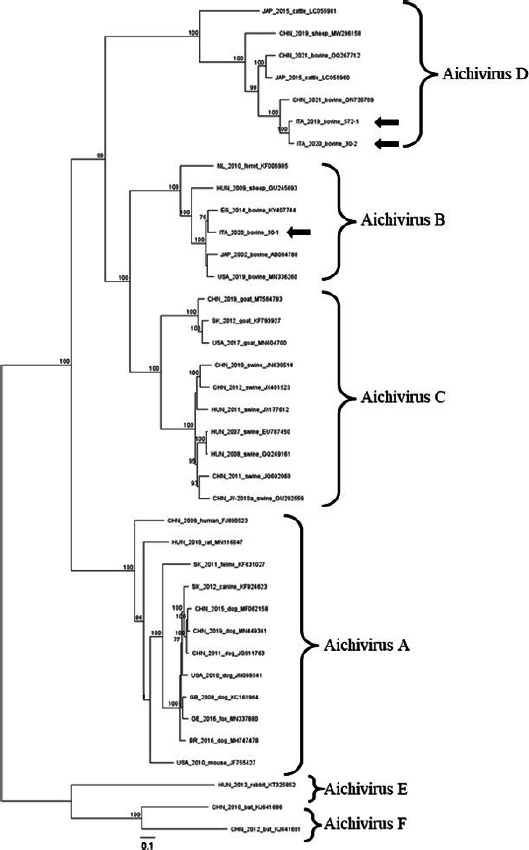
Phylogenetic reconstruction based on complete KoV ge2n9o5mes obtained in this study (arrows) and hit sequences obtained from the Genbank databases. Statistical support was determined using 1000 bootstrap replicates, with gamma distribution and invariant sites.
Rosalia ORF5 nucleotide identity (%) evolution along time.
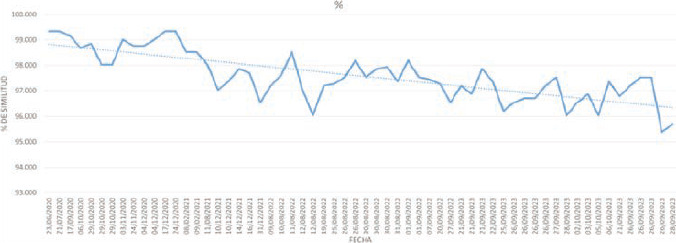
Predictive LB model results.
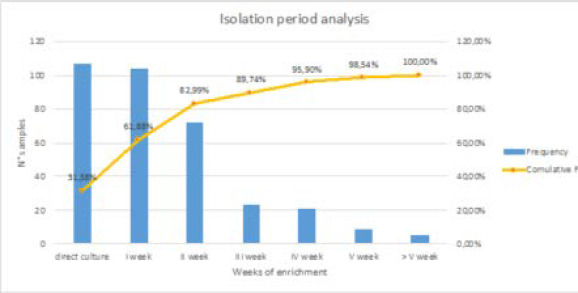
Isolation period analysis.
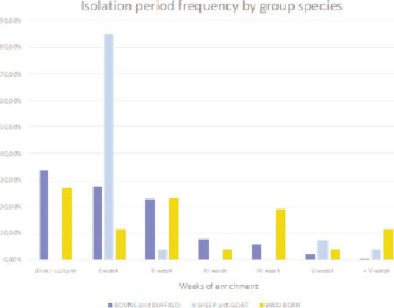
Distribution and frequency of the isolation time of Brucella on different group species
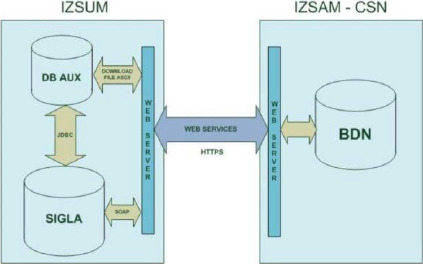
System architecture.
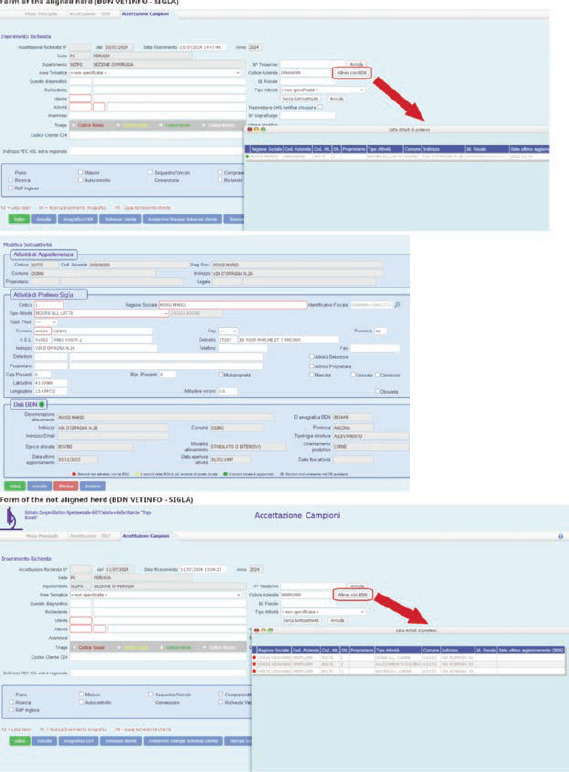
Example of a reception form with an aligned and a not aligned herd (BDN VETINFO - SIGLA)
Example of a reception form with aligned single identification animal number (BDN VETINFO – SIGLA)
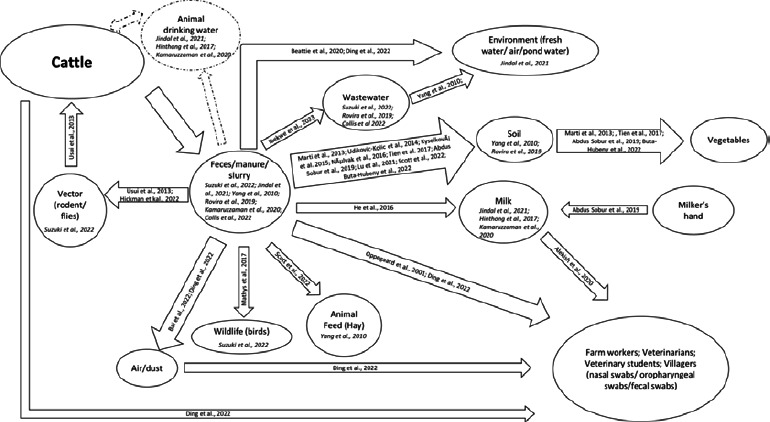
Pathway of mobile antibiotic resistance genes (MARGs) in different matrices characterizing dairy farms.
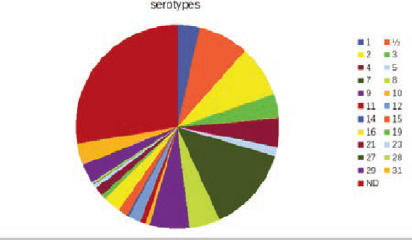
Serotypes of S. suis isolates collected in 2018-2022 the Czech republic.
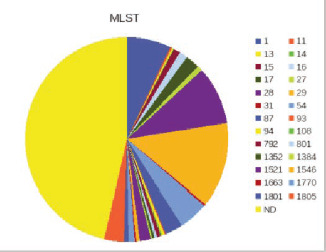
Sequence types of S. suis isolates collected in 2018-2022 in in the Czech republic.
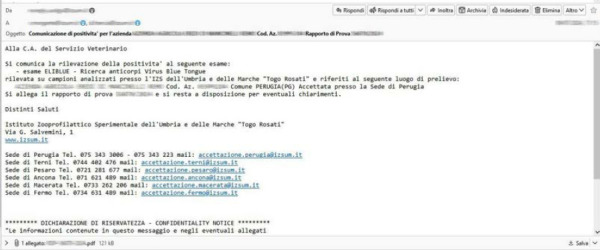
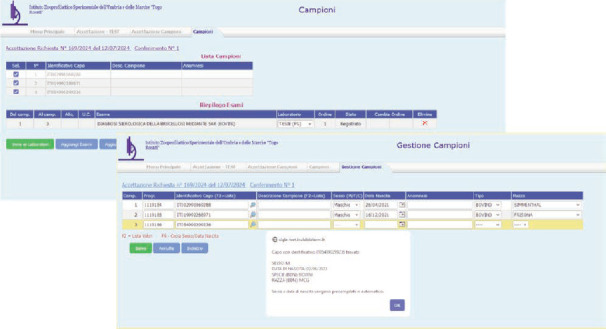
Example of a notification e-mail.
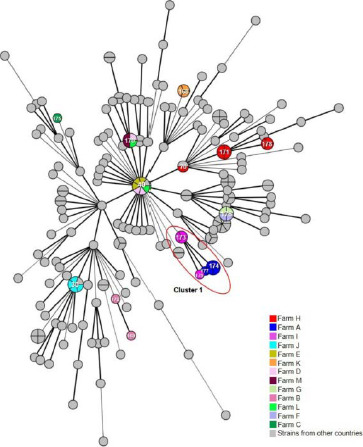
MST (Minimum Spanning Tree) of strains uploaded in PubMLST and Italian strains. Each circle and numbers correspond to a ST. Colors and size represent the different Italian farms and the number of isolates, respectively. Strains from other countries are encircled in grey. The lines joining the circles are represented with different thicknesses depending on the number of allelic differences between the respective STs (bold = 1 allelic difference, plain = 2 allelic differences). Cluster 1 highlights the genetic relationship between STs from Farm A and Farm I also shown in the figure 2.
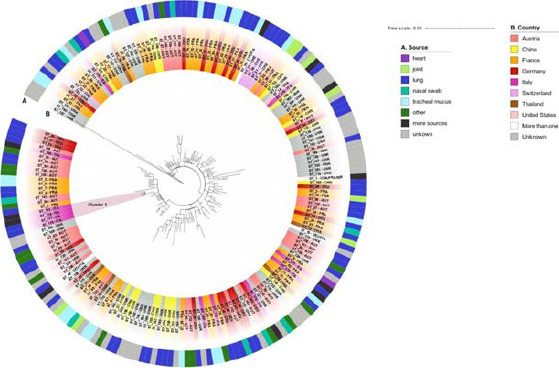
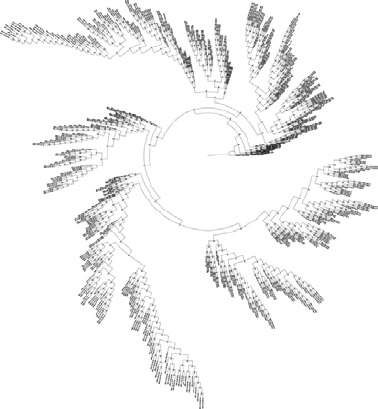
Global phylogenetic tree based on the concatenated allelic sequence (ST) of the six MHR housekeeping genes. The evolutionary history was inferred by using the Maxi3m2u1m Likelihood method based on the Tamura 3-parameter model7. A discrete Gamma distribution was used to model evolutionary rate differences among sites (5 categories (+G, parameter = 0,1162)). A. Source: classification of organic matrices shown in the external ring. B. Country: assignment of STs by countries available on PubMLST. Cluster 1 highlights the close phylogenetic relationship of STs from Farm A and Farm I shown in the figure 1. Evolutionary analyses were conducted in MEGA78. Visualization was made using.
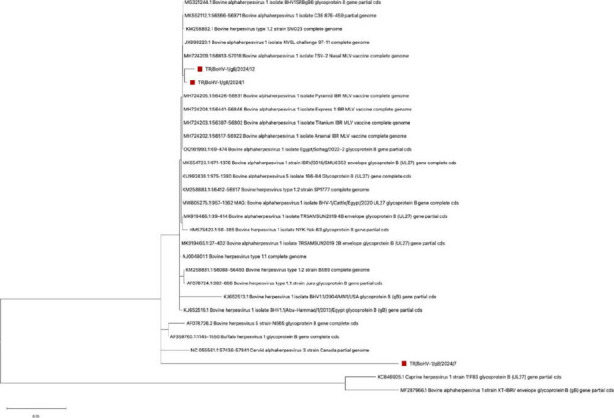
Phylogeographic analysis of BoHV-1 sequences based on partial gB gene. Newly identified Turkish BHV-1 strains are indicated by a solid red square.
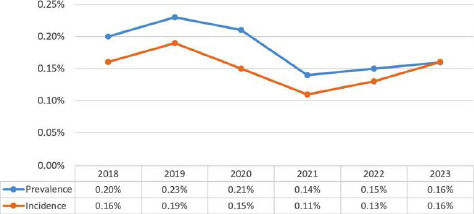
Trends of bTB incidence and prevalence at herd level, Italy 2018-2023.
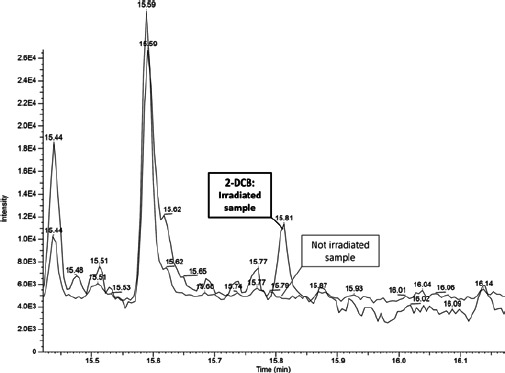
Overlay of two chromatograms (Total Ion Current) of egg samples not irradiated and irradiated at 0.5 kGy.
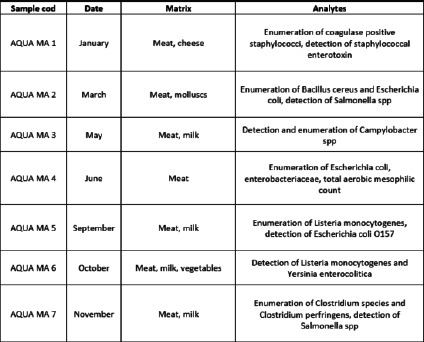
Distribution of the 144 matrices sampled in 5 months into RTE food categories.
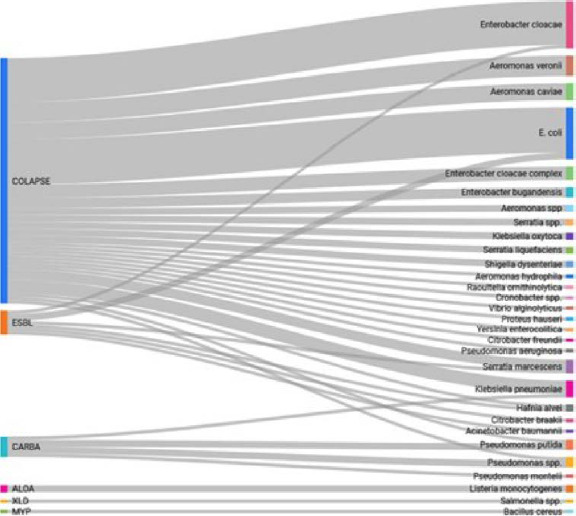
Displaying the selective media (COLAPSE, ESBL and CARBA) that allowed the growth of the following bacterial species.
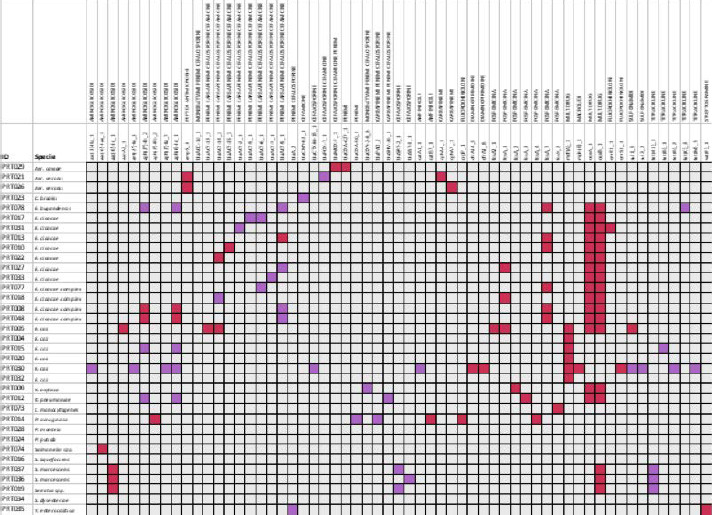
Schematic view of the resistome related to the 35 bacterial strains (ID) subjected to NGS, whose species is indicated in the second column. Resistance genes, grouped by drug class, detected in the genomic sequence are listed in the column. Predicted genes are indicated in magenta; those not detected or not tested in gray; genes whose resistance was also found in vitro are indicated in purple.
Levels of cytokines/chemokines in cages treated with probiotics (Cage 5) and control cages (Cage 6) measured in mg/ml at different time points (t0, t1, t2, t3).
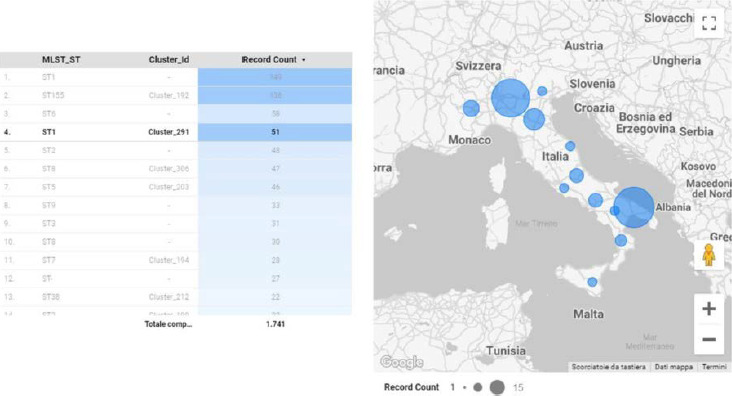
Out of 1741 genomes of human isolates of L. monocytogenes available on IRIDA-ARIES, representation of the geographical distribution of Italian clinical cases (n. 51/1741) referable to cluster 291. The 15 strains isolated in Apulia and sequenced by IZS della Puglia e della Basilicata are also included.
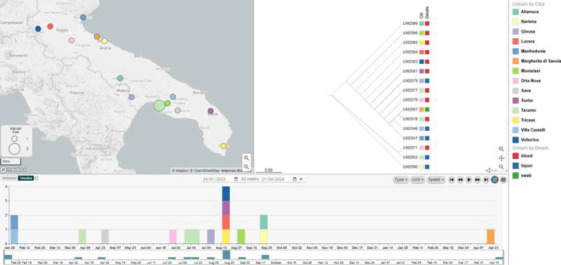
Image created with Microreact, geographically representing the cities of residence of the Apulian patients involved in the listeriosis outbreak (Cluster 291). The timeline shows the dates of sampling of clinical (blood, CSF) and environmental (swab) samples. A dendrogram obtained from the cgMLST data has been generated in the right panel.
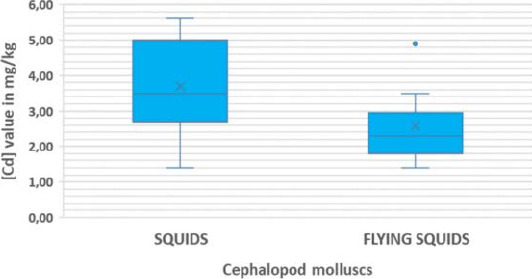
Box-plot of [Cd] values in mg/kg of non-compliant samples for the two main group of cephalopods (Squids: N=7; Flying squids: N=7). Values for octopuses (N=2) and cuttlefish (N=1) were not represented. Median value is marked with a horizontal line, while an X indicates the mean value.
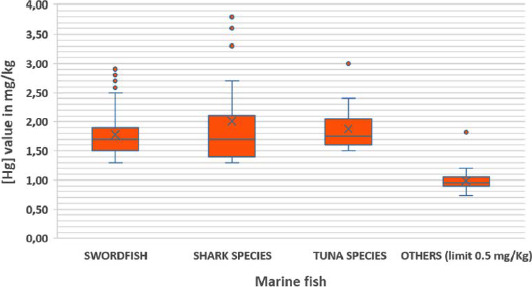
Box-plot of [Hg] values in mg/kg of non-compliant samples for each group of marine fish species (Swordfish: N=59; Shark species: N=16; Tuna species: N=14; others with limit 0.5 mg/kg: N=26). Values of samples (N=3) from other species with [Hg] limit 1.0 mg/kg were not represented. Median value is marked with a horizontal line, while an X indicates the mean value.
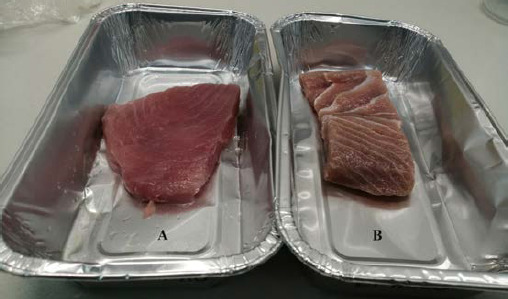
Red tuna sample treated with nitrite (A) and not treated (B) after 5 days of storage at 4°C.
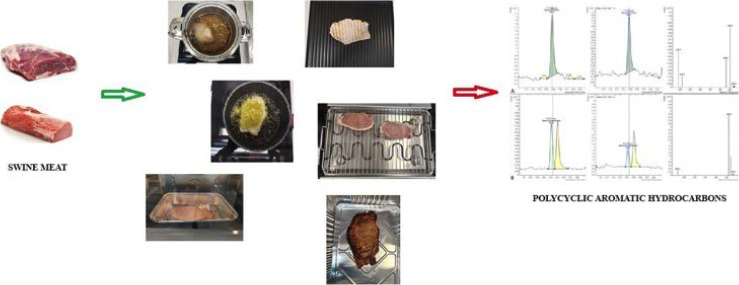
PAHs IN PORK MEAT AFTER COOKING.
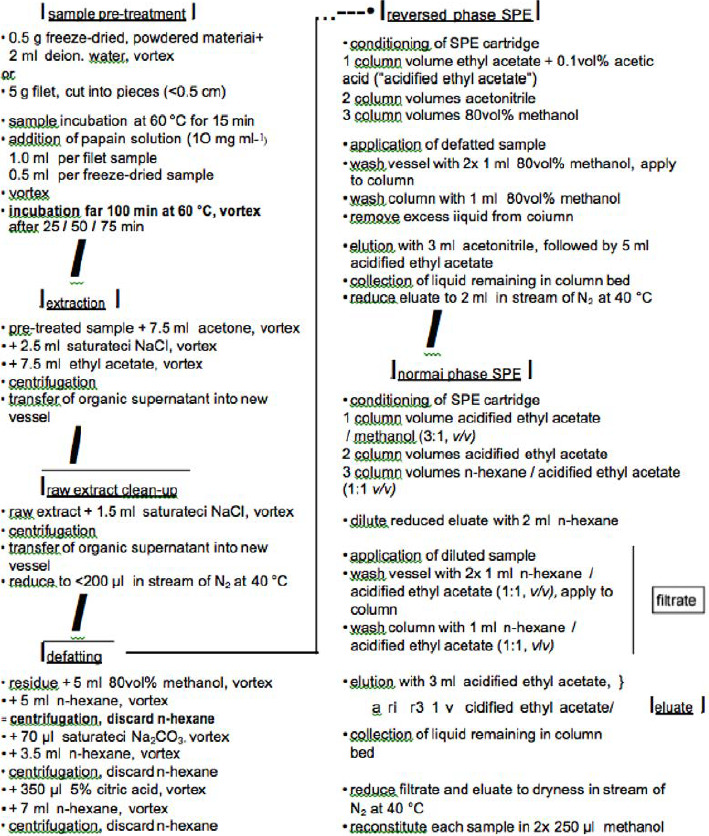
Extraction protocol for CTX (Castro et al., 2022).
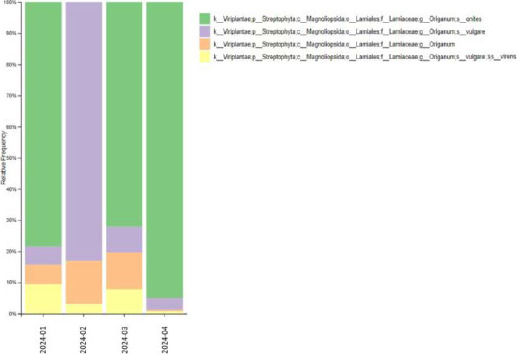
Stacked barplot of relative abundance of the species that make up the 4 oregano samples.
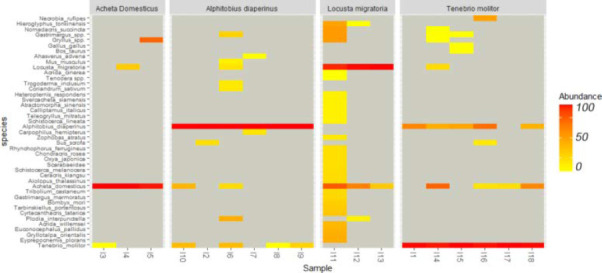
Heat map of taxa in IBFs. Colour gradients correspond to the relative percentage abundance within each sample.
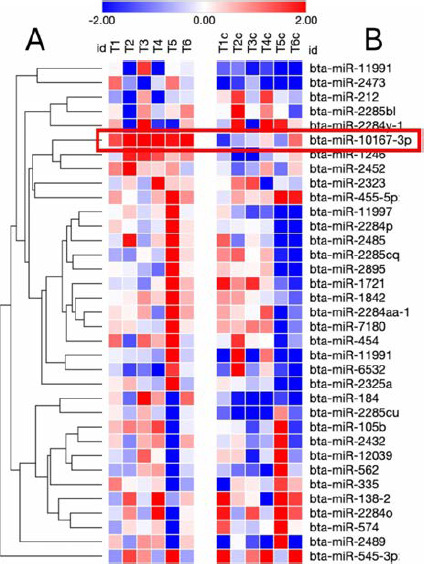
Comparison of expression levels of 35 DE miRNAs identified by sequencing analysis on milk exosomes from treated (T1-T6, A) and control cows (T1c-T6c, B). Bta-miR-10167-3p shows significant up-regulation in rbST-treated animals.
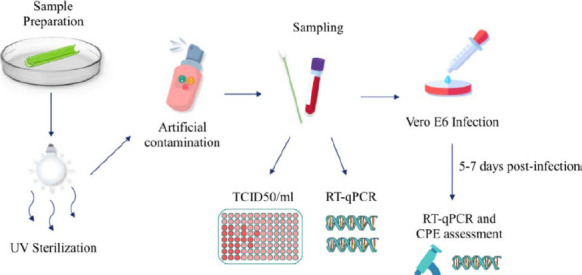
Schematic diagram of the main steps of the experiment. Samples were dissected and sterilised using UV light; SARS-CoV-2 lineage B.1 and EG.5.1 were used to perform the artificial contamination of the 10 different food matrices. From 0.5 h to 96 h post-contamination, swabs were rubbed from the matrices and deposited in 1 mL of UTM medium. Next, 50 μL of UTM were collected to perform viral titration by TCID50/mL, 200 μL for nucleic acids extraction and subsequent RT-qPCR analysis, and 100 μL were used as inoculum for Vero E6 cells. The cell cultures were daily inspected up to 7 days p.c. using an inverted microscope. When at least 50% CPE occurred, or at 5-7 days post-inoculum in the absence of CPE, the culture supernatant was collected and analysed by RT-qPCR.
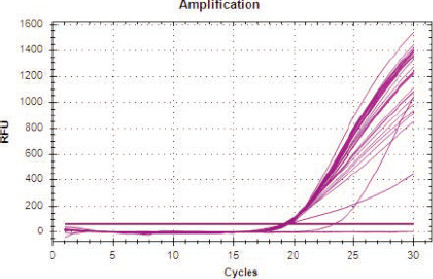
Amplification curves of the vegan real-time PCR analysis of DNA extracts from the samples to the LOD concentration corresponding to 0.01% (100 mg/kg).
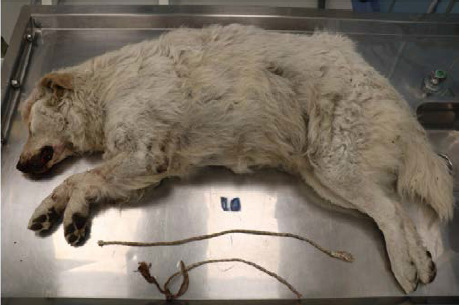
Rope foundend around the neck and metacarpal region.
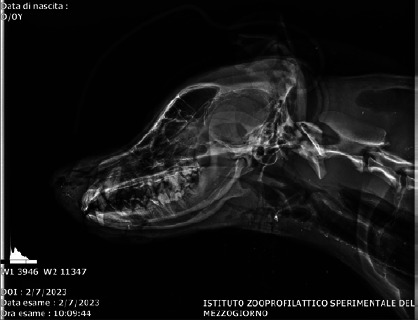
Radiographic study of the region of the head and neck.
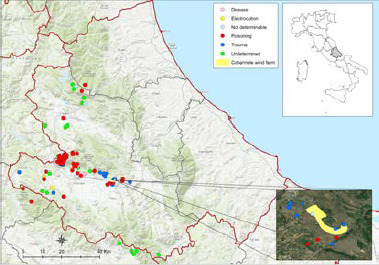
Abruzzo region, showing the municipalities of origin in wich tested vultures were found dead.
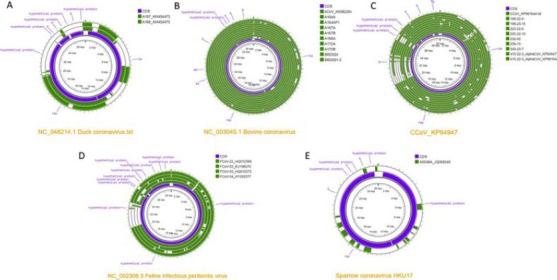
Genomes representation map and comparison. Reference genome (indicated in orange: A. Duck coronavirus comparison; B. Bovine coronavirus comparison; C. Canine coronavirus comparison; D. Feline coronavirus comparison; E. Sparrow coronavirus comparison) and complete genome/partial genome of CoVs identified in the study were compared using PROKSEE (https://proksee.ca/ ). In purple was indicated the Coding Sequences (CDS) generated on reference sequence. The genome sequenced by PanCoronavirus Panel were showed in green.
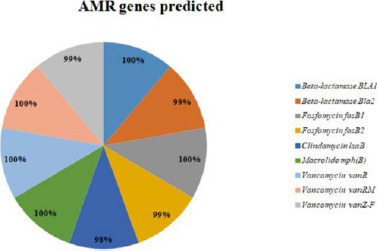
Graphic showing the different percentages of presence of predicted AMR genes performed by ABRicate v1.0.1.
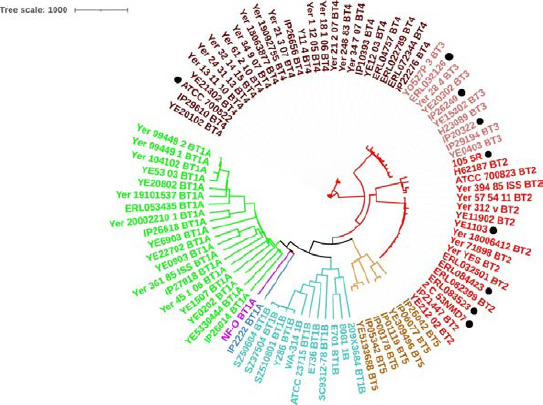
cgMLST phylogenetic tree. Information on the biotype characterization is appended to the strains’ names. The black dots indicate strains for which the biotype assignment described in the literature is different from that of the strains part of the same clade. Each clade was assigned a different colour. The largest clade grouping BT2, BT3 and BT4 strains was coloured with different shades of red attributed to the different subclades corresponding to the different biotypes.
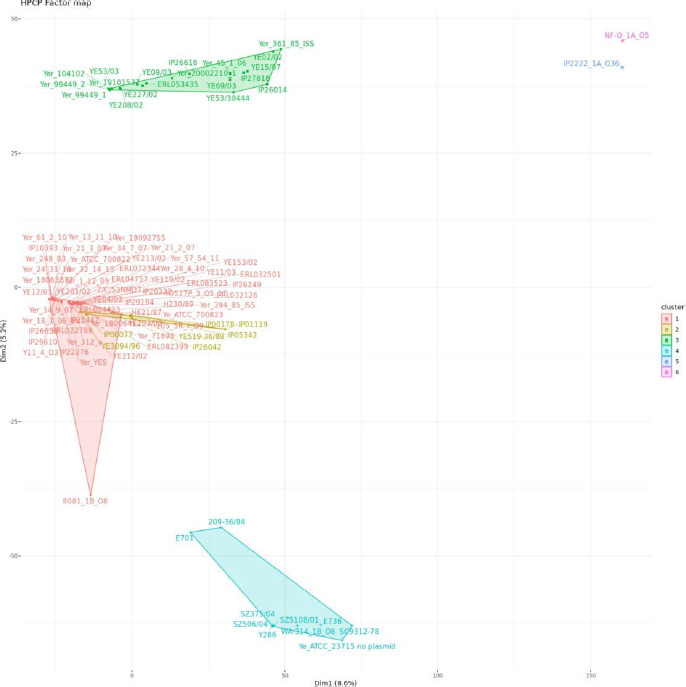
HCPC Factor Map. The clusters were coloured based on the clades detected in cgMLST analysis (Figure 1).
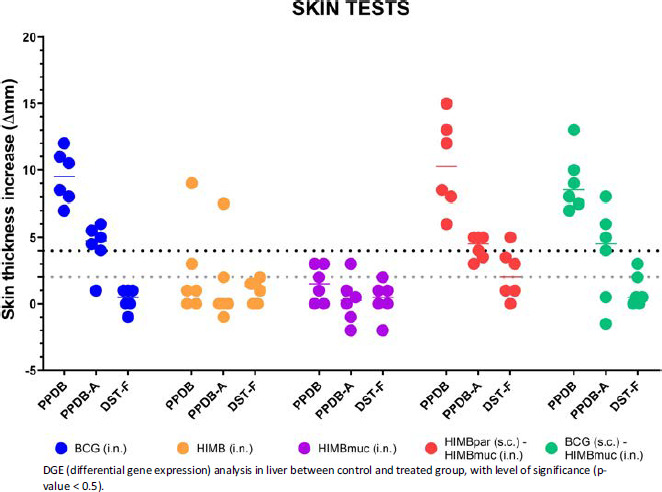
Skin fold thickness increase after PPDB and DST-F inoculation. PPDB: M. bovis tuberculin; DST-F: Fusion protein containing ESAT-6, CFP10 and EspC antigens. Each colour represents a different vaccination group. Horizontal lines in each group represent the median values. The dotted lines show the positivity cut-offs for the severe (grey) (> 2mm) and standard (black) (≥ 4mm) interpretations of the single intradermal tuberculin test (SICT) and DST-F skin test. Animals were considered positive to the skin test if their reaction was above the positivity cut-offs.
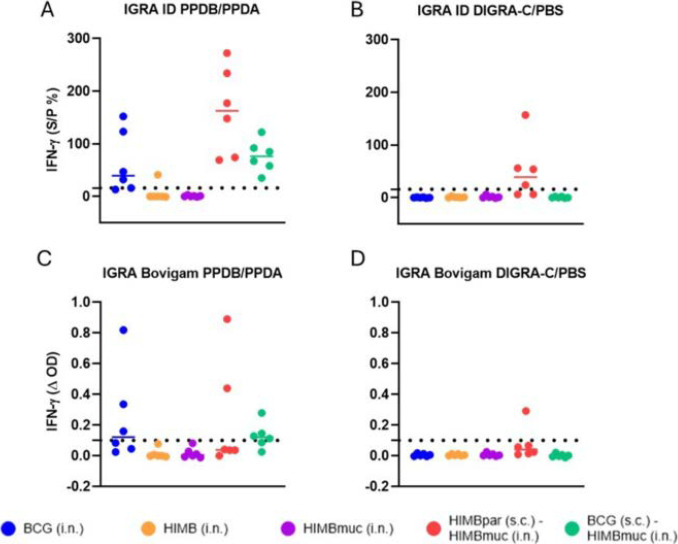
IFN- g responses using each IGRA kit. (A, B) ID Screen® Ruminant IFN-g (ID, Grabels, France). The S/P (%) ratio was calculated dividing the Optical Density (OD) PPDB – PPDA or PBS/OD Positive Control-Negative Control x 100. Cut- off for positivity: S/P ≥ 16%. (C, D) BOVIGAM™ TB (Thermo Fisher Scientific, Waltham, MA, USA). The OD was calculated using PPDB OD - PPDA OD or DIGRA-C OD - PBS OD, respectively. Cut-off for positivity: OD ≥ 0.1. The interpretation of the results was done following the indications of the Spanish National Reference Laboratory for bovine TB. Horizontal lines in each group in (A), (B), (C) and (D) represent the median values.
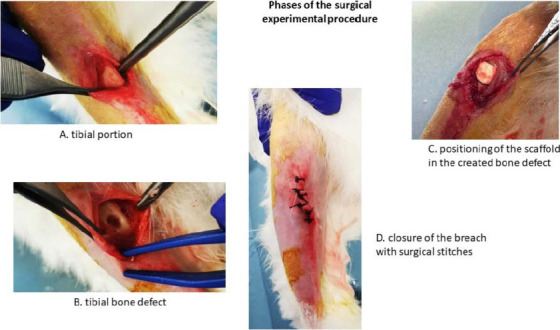
Phases of the surgical experimental procedure.
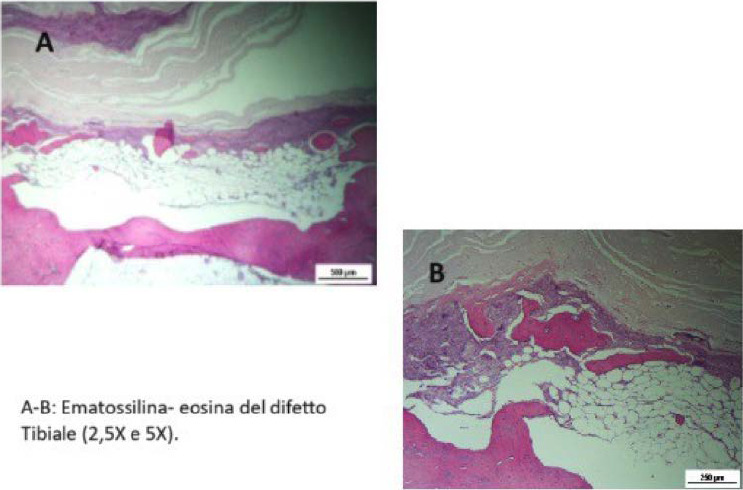
Preliminary histology results.
FlexAnalysis spectra obtained for 8 strains of Bordetella bronehiseptica in farms A. B or in pathogenic context
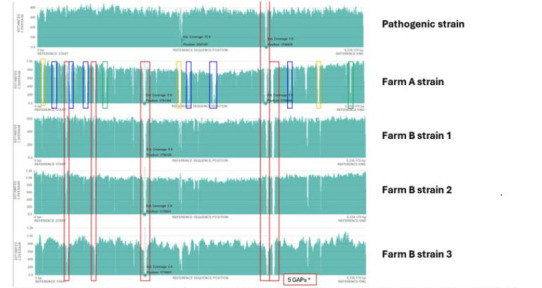
Alignment of the cleaned reads obtained for the 5 sequencing runs on the RB50 reference genome (EPI2me). Red boxes: GAPs common to the 4 non-pathogenic strains, Blue boxes:GAPS only present at farm A, Yellow boxes: regions notoovered or weakly common between farm A and B. Green boxes: weakly covered regions present only at farm A.
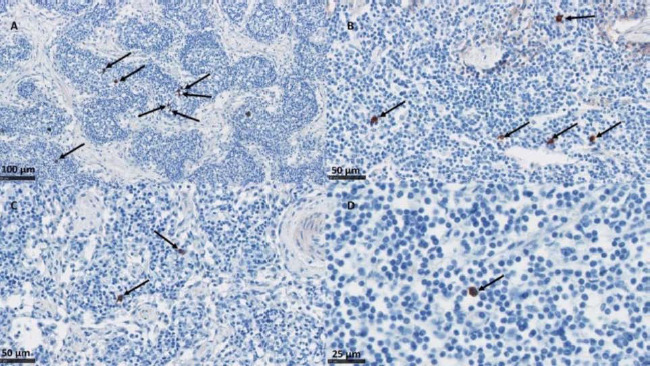
Detection of C. abortus in lymph nodes of infected ewes by IHC. The figure shows immunolabelling for C. abortus in placenta using mAb targeting C. abortus - MOMP. C. abortus -MOMP is labelled in red over a blue counterstain. Note the cells showing intracellular inclusion (arrow) in lumbo-artic (A and B), mediastinal (C) and prescapular (D) lymph node IHC using AEC red substrate and counterstained with haematoxylin.
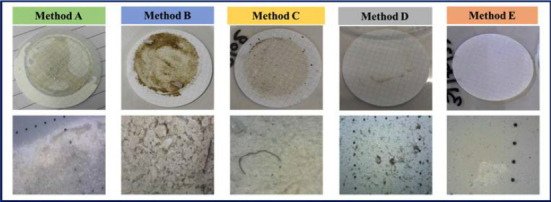
Macroscopic image and enlargement (92X) of filters obtained by the different 5 methods used for the isolation and count of microplastics (A-E).
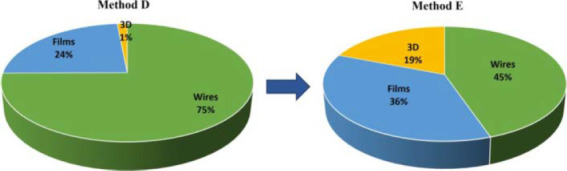
Pie chart comparing methods D and E. The graph of the E method underlines a more homogeneous characterization of MPs shape (3D = MPs fragments).
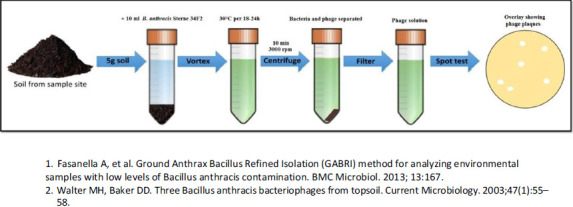
Technical procedure for phage isolation from soils sampled in environmental sites in which carcasses of animals that died from anthrax had been buried.
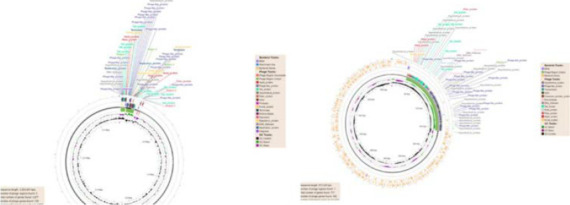
Circular map of the assemblies resulting from the genetic sequences of the FAGO-8 (right) and FAGO-C (left).
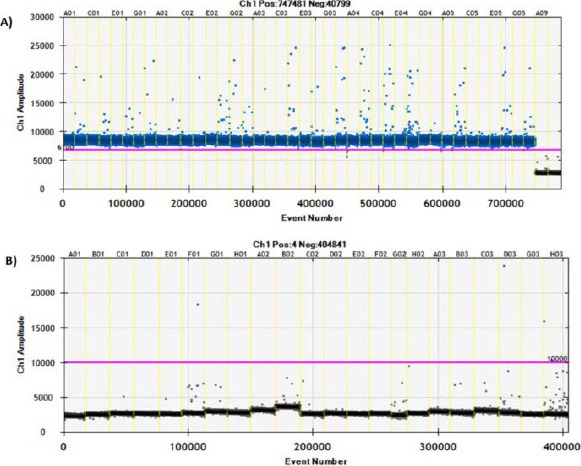
Droplet digital PCR assay for PL3. A) Positive samples droplet populations are shown in blue droplets blue. B) Negative samples in grey droplets. Threshold was set manually (pink).
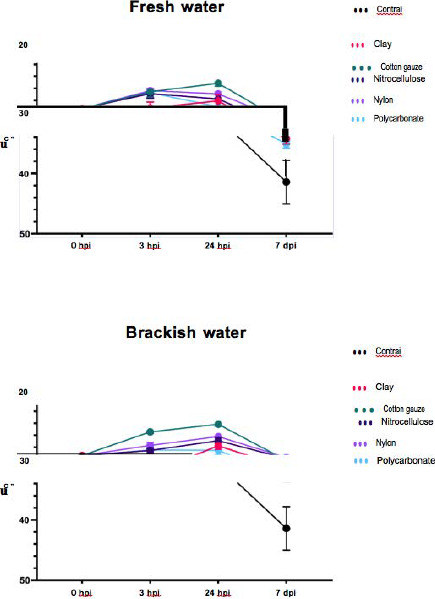
Comparison of different adsorbent materials immersed in brackish and freshwater contaminated with AIV.
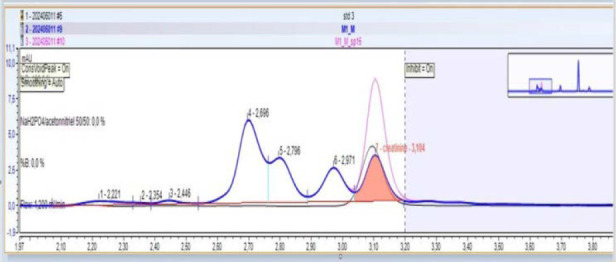
HPLC chromatogram, overlay std 5 ppm – bulk milk – spiket bulk milk (automatically integrated)
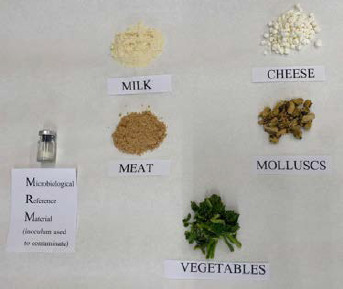
Food matrices and inoculum.
Calendar.
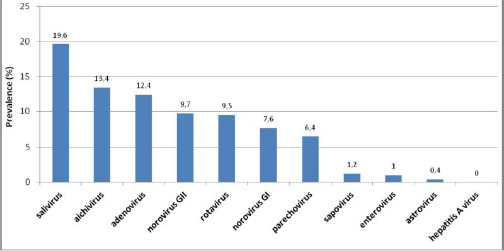
Prevalence of the viruses investigated
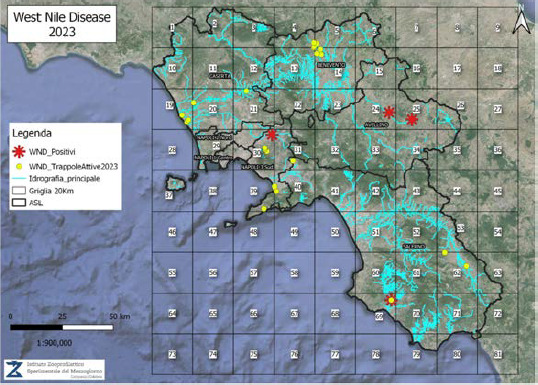
The map of the Campania region with confirmed WNV cases and active traps for entomological surveillance in the year 2023
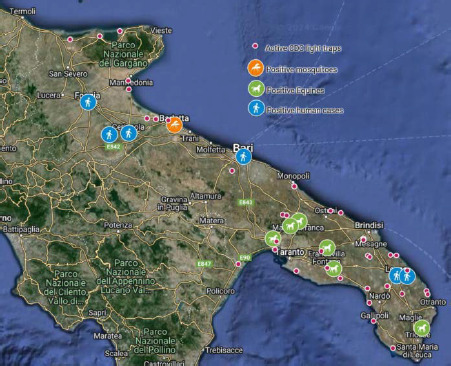
WNV lineage 2 infection cases in animals (mosquitoes, equines) and humans in Apulia region during 2023 year.
Cat, Skin. Multifocal pyogranulomatous dermatitis, severe, chronic. Hematoxylin-eosin stain.
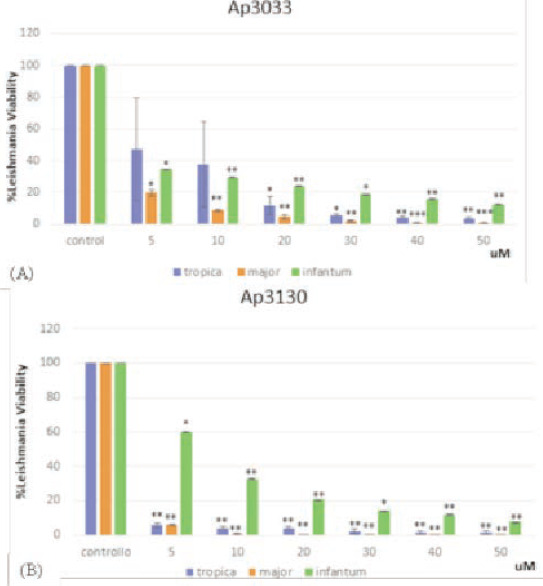
Promastigotes viability after 48h colture with serial concentrations of 3033 (A) and 3130 (B)
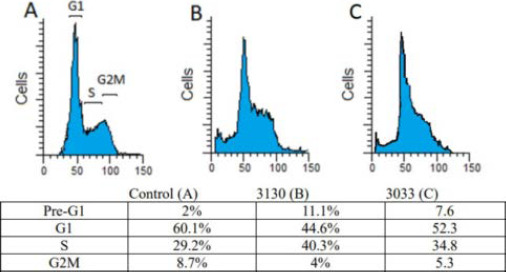
Cell cycle distribution by propidium iodide procedure at cytofluorimeter, IC90 of 3130(B), 3033 (C) and control (A) after 48h in MCAN coltures.

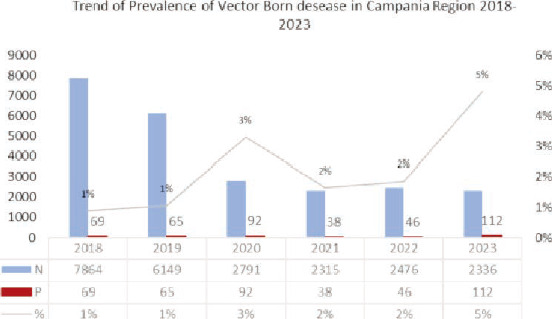
Trend of Prevalence of Vector Born disease in Campania Region 2018-2023.
Distribution of the number of days with humidity and temperature above average in Campania Region 2018-2023.
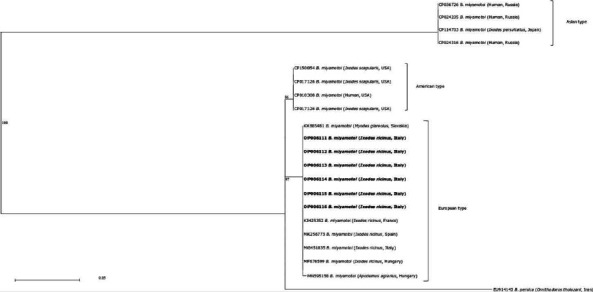
Phylogenetic analysis of B. miyamotoi isolates.
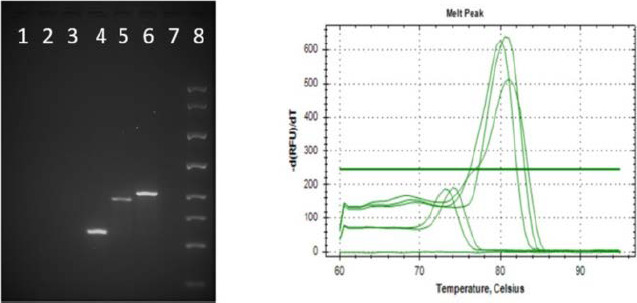
Positive and negative samples on agarose gel and positive sample melting curves
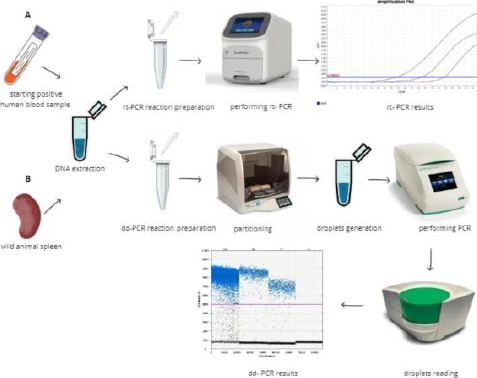
Molecular investigation workflow. Real time PCR and Droplet Digital PCR. Stage A) Starting positive human blood samples for the design of the rt-PCR and dd-PCR. Stage B) Wildlife spleens analysis.
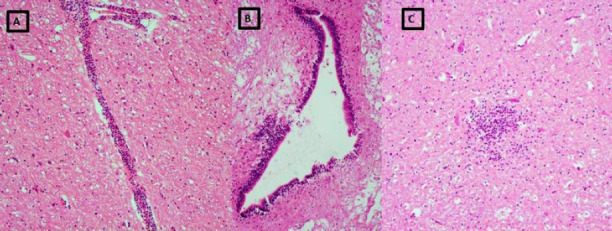
Histologic findings of brain and ependymal canal stained by hematoxylin-eosin: A-B: Details of perivascular lymphocytic infiltrates; C: focal gliosis and spongiosis.
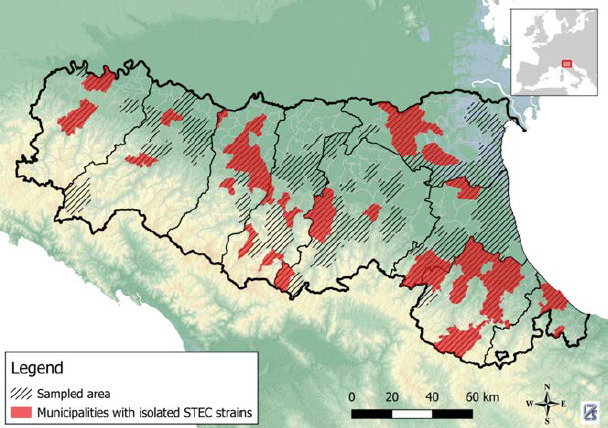
Map of RER displaying the sampled area and the municipalities with isolated STEC strains
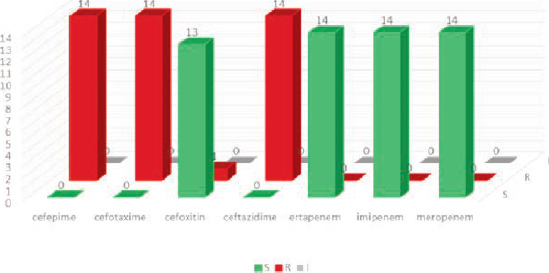
Susceptible pattern of K. pneumoniae strains toward cephalosporins and carbapenems. S, susceptible; I, intermediate; R, resistant.
Similar articles
-
Abstracts of the European Society of Veterinary Clinical Pathology (ESVCP) 10th Annual Congress in conjunction with the International Society for Animal Clinical Pathology (ISACP) 13th Biennial Congress, the Association for Acute Phase Proteins (APP) 7th Congress, and the Association for European Comparative Clinical Pathology (AECCP) 8th Congress. Barcelona, Spain. September 30–October 3, 2008.Vet Clin Pathol. 2008 Dec;37 Suppl 1:19-40. doi: 10.1111/j.1939-165X.2008.00097.x. Vet Clin Pathol. 2008. PMID: 19068069 No abstract available.
-
The Scientific Value of Abstracts on Prostate Cancer Presented at the European Association of Urology Congresses.Front Surg. 2021 Jun 15;8:683359. doi: 10.3389/fsurg.2021.683359. eCollection 2021. Front Surg. 2021. PMID: 34212000 Free PMC article.
-
What is the fate of scientific abstracts? The publication rates of abstracts presented at the 7th National Congress of Gynecology and Obstetrics.Turk J Obstet Gynecol. 2015 Mar;12(1):25-29. doi: 10.4274/tjod.77785. Epub 2015 Mar 15. Turk J Obstet Gynecol. 2015. PMID: 28913036 Free PMC article.
-
Publication rate of abstracts presented at the Congress of the European Federation of National Associations of Orthopaedics and Traumatology (EFORT).Orthop Traumatol Surg Res. 2019 Oct 3:1453-1457. doi: 10.1016/j.otsr.2019.07.014. Online ahead of print. Orthop Traumatol Surg Res. 2019. PMID: 31588034
-
Highlights of the 30th Annual Congress of the EANM, Vienna 2017: "Yes we can - make nuclear medicine great again".Eur J Nucl Med Mol Imaging. 2018 Sep;45(10):1781-1794. doi: 10.1007/s00259-018-4029-9. Epub 2018 May 3. Eur J Nucl Med Mol Imaging. 2018. PMID: 29725717 Free PMC article. Review.
References
-
- Simner PJ, Rauch CA, Martin IW, Sullivan KV, Rhoads D, Rolf R, She R, Souers RJ, Wojewoda C, Humphries RM. 2022. Raising the bar: improving antimicrobial resistance detection by clinical laboratories by ensuring use of current breakpoints. Open Forum Infect Dis 9. 10.1093/ofid/ofac007 - DOI - PMC - PubMed
-
- Rossen JWA, Friedrich AW, Moran-Gilad J, ESCMID Study Group for Genomic and Molecular Diagnostics (ESGMD) . 2018. Practical issues in implementing whole-genome-sequencing in routine diagnostic microbiology. Clin Microbiol Infect 24:355–360. Crossref. PubMed. ISI. - PubMed
-
- Timofte D., Broens E. M., Guardabassi L., Pomba C., Allerton F., Ikonomopoulos J., . . . European Network for Optimisation of Veterinary Antimicrobial Treatment (ENOVAT); ESCMID Study Group for Veterinary Microbiology (ESGVM); European College of Veterinary Microbiology (ECVM) and European Association of Veterinary Laboratory Diagnosticians (EAVLD) (2021). Driving laboratory standardisation of bacterial culture and antimicrobial susceptibility testing in veterinary clinical microbiology in Europe and beyond. Journal of Clinical Microbiology. 59, doi:10.1128/jcm.02572-20 - PMC - PubMed
-
- Koritnik Tom, Cvetkovikj Iskra, Zendri Flavia, Blum Shlomo Eduardo, Chaintoutis Serafeim Christos, Kopp Peter A., Hare Cassia, Štritof Zrinka, Kittl Sonja, Gonçalves José, Zdovc Irena, Paulshus Erik, Laconi Andrea, Singleton David, Allerton Fergus, Broens Els M., Damborg Peter, Timofte Dorina. Towards harmonised laboratory methodologies in veterinary clinical bacteriologyoutcomes of a European survey. Frontiers in Microbiology, under review (Manuscript ID: 1443755) - PMC - PubMed
-
- Marques C, Gama LT, Belas A, Bergström K, Beurlet S, Briend-Marchal A, Broens EM, Costa M, Criel D, Damborg P, van Dijk MAM, van Dongen AM, Dorsch R, Espada CM, Gerber B, Kritsepi-Konstantinou M, Loncaric I, Mion D, Misic D, Movilla R, Overesch G, Perreten V, Roura X, Steenbergen J, Timofte D, Wolf G, Zanoni RG, Schmitt S, Guardabassi L, Pomba C. 2016. European multicenter study on antimicrobial resistance in bacteria isolated from companion animal urinary tract infections. BMC Vet Res 12:213. doi: 10.1186/s12917-016-0840- - PMC - PubMed
LinkOut - more resources
Full Text Sources