[Preprint]. 2024 Oct 3:2024.10.02.616246.
doi: 10.1101/2024.10.02.616246.

Continuous cell type diversification throughout the embryonic and postnatal mouse visual cortex development

Affiliations

Continuous cell type diversification throughout the embryonic and postnatal mouse visual cortex development

Yuan Gao et al. bioRxiv. .

Abstract

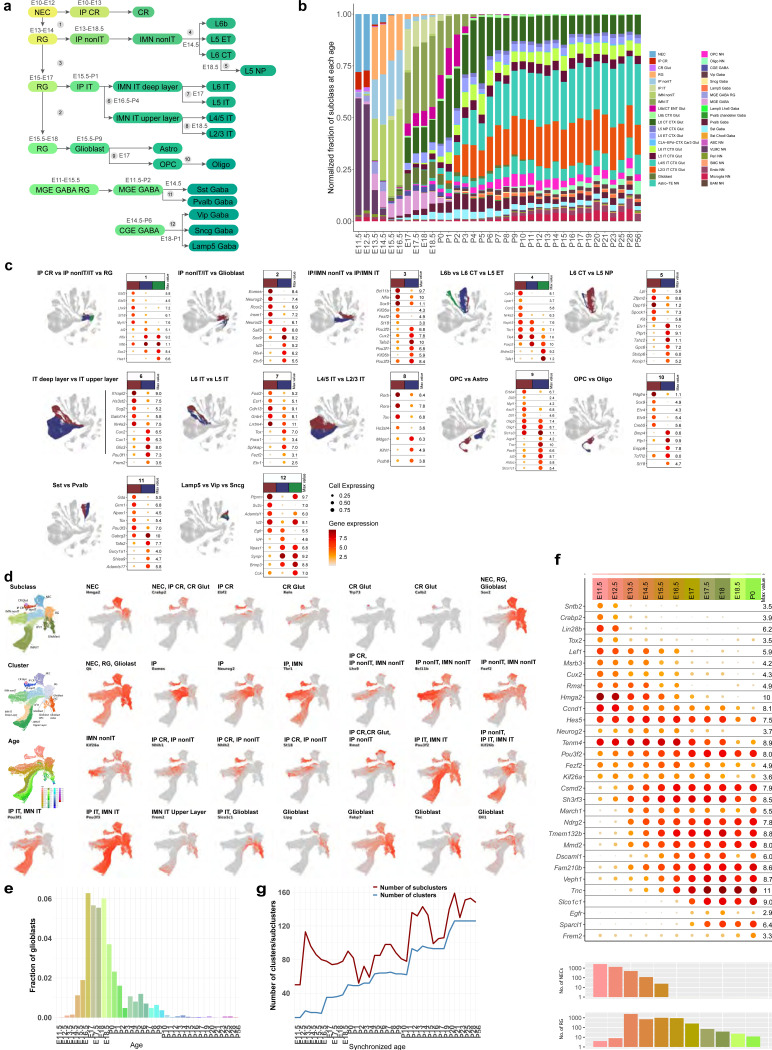
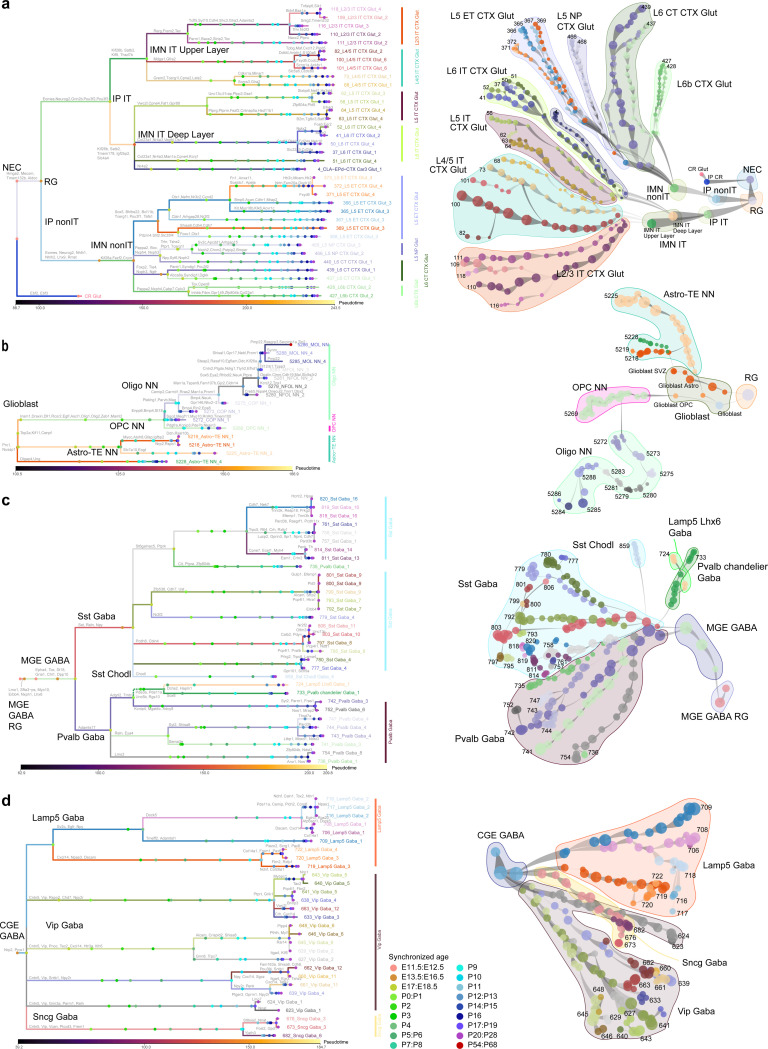
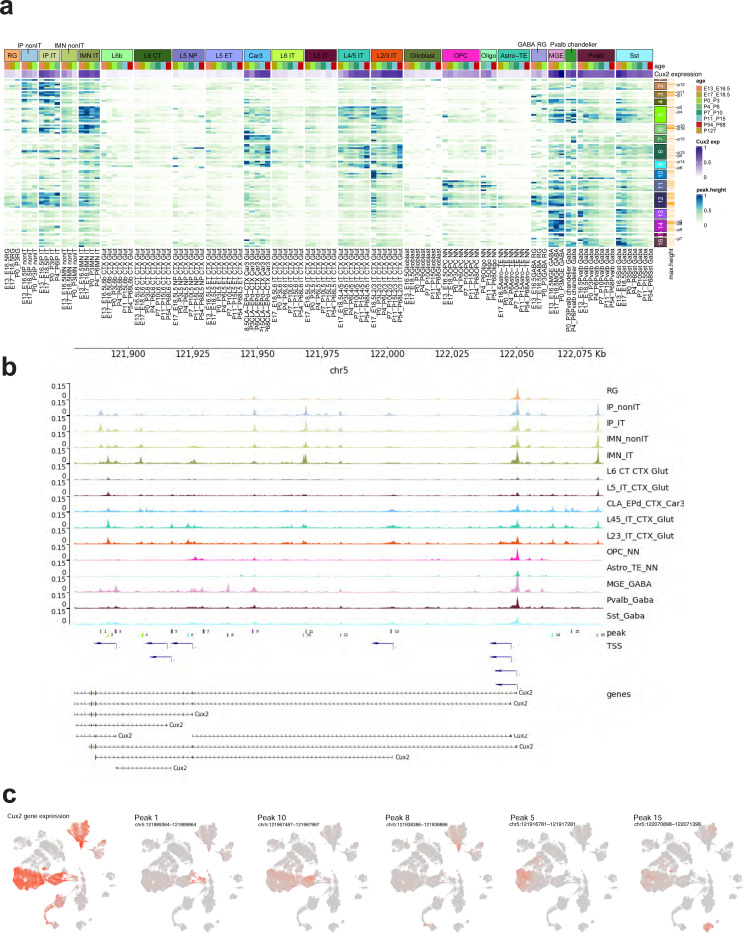
The mammalian cortex is composed of a highly diverse set of cell types and develops through a series of temporally regulated events that build out the cell type and circuit foundation for cortical function. The mechanisms underlying the development of different cell types remain elusive. Single-cell transcriptomics provides the capacity to systematically study cell types across the entire temporal range of cortical development. Here, we present a comprehensive and high-resolution transcriptomic and epigenomic cell type atlas of the developing mouse visual cortex. The atlas was built from a single-cell RNA-sequencing dataset of 568,674 high-quality single-cell transcriptomes and a single-nucleus Multiome dataset of 194,545 high-quality nuclei providing both transcriptomic and chromatin accessibility profiles, densely sampled throughout the embryonic and postnatal developmental stages from E11.5 to P56. We computationally reconstructed a transcriptomic developmental trajectory map of all excitatory, inhibitory, and non-neuronal cell types in the visual cortex, identifying branching points marking the emergence of new cell types at specific developmental ages and defining molecular signatures of cellular diversification. In addition to neurogenesis, gliogenesis and early postmitotic maturation in the embryonic stage which gives rise to all the cell classes and nearly all subclasses, we find that increasingly refined cell types emerge throughout the postnatal differentiation process, including the late emergence of many cell types during the eye-opening stage (P11-P14) and the onset of critical period (P21), suggesting continuous cell type diversification at different stages of cortical development. Throughout development, we find cooperative dynamic changes in gene expression and chromatin accessibility in specific cell types, identifying both chromatin peaks potentially regulating the expression of specific genes and transcription factors potentially regulating specific peaks. Furthermore, a single gene can be regulated by multiple peaks associated with different cell types and/or different developmental stages. Collectively, our study provides the most detailed dynamic molecular map directly associated with individual cell types and specific developmental events that reveals the molecular logic underlying the continuous refinement of cell type identities in the developing visual cortex.


Figures

Extended Data Figure 1.
Extended Data Figure 1.. scRNA-seq and Multiome data processing and analysis workflow and quality control.
(a) Number of cells at each step in the scRNA-seq and Multiome data processing and analysis pipeline. The identification of doublets and low-quality cells and clusters is described in detail in Methods. The 10xv3 and 10x Multiome data were first QC-ed and analyzed separately. After initial clustering the datasets were combined and QC-ed again before and after joint clustering. (b-c) Number of cells after each QC step in scRNA-seq (b) and Multiome data (c). The color codes of QC steps correspond to the colored QC boxes in (a). (d) Number of cells from each FACS population in scRNA-seq data. (e-h) Box plots of gene detection (e) and QC score (f) for 10xv3, and gene detection (g) and number of unique fragments (h) for 10x Multiome, per cell across different cell classes and ages.
Extended Data Figure 2.
Extended Data Figure 2.. Detailed scRNA-seq and Multiome data analysis workflow.
(a) Adjacent cell type mapping and clustering pipeline. (b) Mutual nearest neighbor (MNN) algorithm implementation for building trajectories. (c) Trajectory of glutamatergic cells built from Monocle3, showing that the embryonic part of the trajectory looks reasonable, but the postnatal part of the trajectory appears erratic. (d) Confusion matrix of the fraction of shared cells between each actual age and synchronized age. Boxes denote synchronized age bins.
Extended Data Figure 3.
Extended Data Figure 3.. Integration between adjacent age bins for label transfer.
(a-n) UMAP comparison of each synchronized age bin with its adjacent younger age bin after integration and label transfer, showing common clusters.
Extended Data Figure 4.
Extended Data Figure 4.. Expression of branching marker genes on UMAP.
(a-l) Expression of marker genes at each branching node corresponding to Figure 2a.
Extended Data Figure 5.
Extended Data Figure 5.. Developmental trajectories of visual cortex nonIT Glut cell types.
(a) Transcriptomic trajectory tree for nonIT clusters starting from the common IMN nonIT antecedent. Nodes are clusters subdivided by synchronized age bins, and edges represent antecedent-descendent relationship between adjacent nodes, with thinner end at the antecedent node, and thicker end at the descendent node. Nodes are grouped by subclass, and adult clusters are labeled. Nodes from L6b/CT ENT subclass are not included. (b-d) UMAP for nonIT cells colored by subclass (b), cluster (c) and synchronized age bin (d). (e) Clusters are grouped together based on similar trajectories. Within each cluster group, all cells along their trajectories, including all antecedent nodes, are shown and are colored by cluster membership. (f) Spatial distribution of nonIT subclasses and clusters within each subclass at adult stage, based on the ABC-WMB Atlas. (g) Marker genes illustrating cell type diversification along trajectories. (h) Cluster composition of all nonIT cells at each age.
Extended Data Figure 6.
Extended Data Figure 6.. Developmental trajectories of visual cortex IT Glut cell types.
(a) Transcriptomic trajectory tree for IT clusters starting from the common IMN IT antecedents. Nodes are clusters subdivided by synchronized age bins, and edges represent antecedent-descendent relationship between adjacent nodes, with thinner end at the antecedent node, and thicker end at the descendent node. Nodes are grouped by subclass, and adult clusters are labeled. (b-d) UMAP for nonIT cells colored by subclass (b), cluster (c) and synchronized age bin (d). (e) Clusters are grouped together based on similar trajectories. Within each cluster group, all cells along their trajectories, including all antecedent nodes, are shown and are colored by cluster membership. (f) Spatial distribution of IT subclasses and clusters within each subclass at adult stage, based on the ABC-WMB Atlas. (g) Marker genes illustrating cell type diversification along trajectories. (h) Cluster composition of all IT cells at each age.
Extended Data Figure 7.
Extended Data Figure 7.. Developmental trajectories of visual cortex Glia cell types.
(a) Transcriptomic trajectory tree for glia clusters starting from the common RG antecedent. Nodes are clusters subdivided by synchronized age bins, and edges represent antecedent-descendent relationship between adjacent nodes, with thinner end at the antecedent node, and thicker end at the descendent node. Nodes are grouped by subclass, and adult clusters are labeled. (b-d) UMAP for glial cells colored by subclass (b), cluster (c) and synchronized age bin (d). (e) Clusters are grouped together based on similar trajectories. Within each cluster group, all cells along their trajectories, including all antecedent nodes, are shown and are colored by cluster membership. (f) Spatial distribution of astrocyte clusters at adult stage, based on the ABC-WMB Atlas. (g) Marker genes illustrating cell type diversification along trajectories. (h) Cluster composition of all glial cells at each age.
Extended Data Figure 8.
Extended Data Figure 8.. Developmental trajectories of visual cortex MGE GABA cell types.
(a) Transcriptomic trajectory tree for MGE clusters starting from the common MGE GABA RG antecedent. Nodes are clusters subdivided by synchronized age bins, and edges represent antecedent-descendent relationship between adjacent nodes, with thinner end at the antecedent node, and thicker end at the descendent node. Nodes are grouped by subclass, and adult clusters are labeled. (b-d) UMAP for MGE cells colored by subclass (b), cluster (c) and synchronized age bin (d). (e) Clusters are grouped together based on similar trajectories. Within each cluster group, all cells along their trajectories, including all antecedent nodes, are shown and are colored by cluster membership. (f) Spatial distribution of MGE subclasses and clusters within each subclass at adult stage, based on the ABC-WMB Atlas. (g) Marker genes illustrating cell type diversification along trajectories. (h) Cluster composition of all MGE cells at each age.
Extended Data Figure 9.
Extended Data Figure 9.. Developmental trajectories of visual cortex CGE GABA cell types.
(a) Transcriptomic trajectory tree for MGE clusters starting from the common CGE GABA antecedent. Nodes are clusters subdivided by synchronized age bins, and edges represent antecedent-descendent relationship between adjacent nodes, with thinner end at the antecedent node, and thicker end at the descendent node. Nodes are grouped by subclass, and adult clusters are labeled. (b-d) UMAP for CGE cells colored by subclass (b), cluster (c) and synchronized age bin (d). (e) Clusters are grouped together based on similar trajectories. Within each cluster group, all cells along their trajectories, including all antecedent nodes, are shown and are colored by cluster membership. (f) Spatial distribution of CGE subclasses and clusters within each subclass at adult stage, based on the ABC-WMB Atlas. (g) Marker genes illustrating cell type diversification along trajectories. (h) Cluster composition of all CGE cells at each age.
Extended Data Figure 10.
Extended Data Figure 10.. Gene modules across ages of glutamatergic subclasses.
(a-b) Expression of DE genes for each subclass of IT (a) and nonIT (b) neurons, organized in gene co-expression modules shown as colored bars on the right of the heat map. Green and blue bars denote shared and subclass-specific modules, respectively. Module IDs are shown on the left, exemplary DE genes are shown on the right.
Extended Data Figure 11.
Extended Data Figure 11.. Gene modules across ages of GABAergic subclasses.
(a-b) Expression of DE genes for each subclass of CTX-MGE (a) and CTX-CGE (b) neurons, organized in gene co-expression modules shown as colored bars on the right of the heat map. Green and blue bars denote shared and subclass-specific modules, respectively. Module IDs are shown on the left, exemplary DE genes are shown on the right.
Extended Data Figure 12.
Extended Data Figure 12.. Correspondence of chromatin accessibility and gene expression across glutamatergic neuron types and ages during development.
(a-b) Heatmap representation of corresponding peak accessibility and gene expression in IT subclasses (a) and nonIT subclasses (b). In each panel, each row corresponds to a peak/gene pair, ordered by peak module and peak/gene correlation, and each column corresponds to a cell category defined by subclass and age group. The left heatmap shows the average peak accessibility in each subclass-by-age-group category. Accessibility values are normalized, with maximum value of 1 per peak and 0 indicating no accessibility. The right heatmap shows the average gene expression in each subclass-by-age-group category. Expression values are normalized, with maximum value of 1 per gene and 0 indicating no expression.
Extended Data Figure 13.
Extended Data Figure 13.. Correspondence of chromatin accessibility and gene expression across GABAergic and glial cell types and ages during development.
(a-b) Heatmap representation of corresponding peak accessibility and gene expression in GABA subclasses (a) and glia subclasses (b). In each panel, each row corresponds to a peak/gene pair, ordered by peak module and peak/gene correlation, and each column corresponds to a cell category defined by subclass and age group. The left heatmap shows the average peak accessibility in each subclass-by-age-group category. Accessibility values are normalized, with maximum value of 1 per peak and 0 indicating no accessibility. The right heatmap shows the average gene expression in each subclass-by-age-group category. Expression values are normalized, with maximum value of 1 per gene and 0 indicating no expression.
Extended Data Figure 14.
Extended Data Figure 14.. Differential accessibility peaks associated with the Grik1 gene in different cell types or different developmental ages.
(a) Heatmap representation of accessibility of differentially accessible peaks located in Grik1 gene body and 50 Kb upstream. Each row corresponds to a peak, ordered by peak module, and each column corresponds to a cell category defined by subclass and age group. The Grik1 gene expression level is shown in purple at the top. The heatmap color represents the average peak accessibility (height) in each subclass-by-age-group category, normalized with 1 indicating the maximum value for each peak and 0 indicating no accessibility. The peak module and maximum peak height are shown for each peak to the right. Specific peaks are numbered and labeled. (b) The accessibility tracks per subclass surrounding the Grik1 gene, along with the genomic locations of labeled peaks in (a). TSS, transcription start site. (c) UMAP representation of Multiome cells, colored by Grik1 expression and accessibility of a subset of peaks labeled in (a).
Extended Data Figure 15.
Extended Data Figure 15.. Differential accessibility peaks associated with the Fezf2 gene in different cell types or different developmental ages.
(a) Heatmap representation of accessibility of differentially accessible peaks located in Fezf2 gene body and 50 Kb upstream. Each row corresponds to a peak, ordered by peak module, and each column corresponds to a cell category defined by subclass and age group. The Fezf2 gene expression level is shown in purple at the top. The heatmap color represents the average peak accessibility (height) in each subclass-by-age-group category, normalized with 1 indicating the maximum value for each peak and 0 indicating no accessibility. The peak module and maximum peak height are shown for each peak to the right. Specific peaks are numbered and labeled. (b) The accessibility tracks per subclass surrounding the Fezf2 gene, along with the genomic locations of labeled peaks in (a). TSS, transcription start site. (c) UMAP representation of Multiome cells, colored by Fezf2 expression and accessibility of a subset of peaks labeled in (a).
Figure 1.
Figure 1.. Transcriptomic developmental cell type atlas of the mouse visual cortex.
(a) Schematic timeline of samples collected in this study along with major developmental events of the isocortex. (b) The transcriptomic taxonomy tree of 148 clusters organized in a dendrogram (10xv3 n = 568,674 cells; 10x multiome n = 194,545 nuclei). The classes and subclasses are marked on the taxonomy tree. Full cluster names are provided in Supplementary Table 3. Bar plots represent (top to bottom): major neurotransmitter type, number of scRNA-seq cells, number of multiome cells, age distribution of scRNA-seq cells, age distribution of multiome nuclei, and number of scRNA-seq subclusters for each cluster. (c-i) UMAP representation of all cell types colored by class (c), subclass (d), cluster (e), subcluster (f), age (g), synchronized age (h), and pseudotime (i). (j) Constellation plot showing the UMAP centroids of subcluster nodes colored by cluster. NEC, neuroepithelial cells. CR, Cajal–Retzius cells. RG, radial glia. IP, intermediate progenitors. IMN, immature neurons. IT, intratelencephalic. ET, extratelencephalic. L6b, layer 6b. NP, near-projecting. CGE, caudal ganglionic eminence. MGE, medial ganglionic eminence. Astro, astrocytes. Oligo, oligodendrocytes. OPC, oligodendrocyte precursor cells. GABA, GABAergic. Glut, glutamatergic. NN, non-neuronal.
Figure 2.
Figure 2.. Developmental trajectories of visual cortex cell subclasses.
(a) Transcriptomic trajectories of VIS cortical subclasses with estimated timing of onset and major branching nodes. (b) Relative proportions of cells corresponding to the different cell subclasses at each age. E11.5 and E12.5 are mainly composed of NEC, IP CR, CR, MGE GABA RG, VLMC, and microglia. RG, IP nonIT and IMN nonIT constitute a large proportion from E13.5 to E16.5. IP IT and IMN IT have large proportions from E17.0 to E18.5. Neuronal subclass composition starts to be stable from P6. Note that relative proportions between neuronal and non-neuronal cells do not reflect the actual situation due to the variable FACS plans employed for different scRNA-seq libraries (Methods, Extended Data Fig 1d, Supplementary Table 1). (c) UMAP representations of major branching nodes shown in (a) and dot plots showing marker gene expression in each descendant branch of each branching node. Dot size and color indicate proportion of expressing cells and average expression level of a marker gene in each subclass, respectively. (d) UMAP representations of early developmental cell types colored by subclass, cluster, age, and expression of key marker genes separating different trajectories. (e) Fraction of glioblast cells at each age. (f) Dot plot showing expression of DE genes across embryonic ages and P0 in NEC and RG populations. Numbers of NEC and RG cells at each age point are shown at the bottom. (g) Number of clusters and subclusters at each synchronized age.
Figure 3.
Figure 3.. Developmental trajectories of visual cortex cell types.
(a-d) Transcriptomic trajectory tree (left) and constellation plot (right) of glutamatergic (a), neuroglia (b), MGE (c), and CGE (d) clusters, which are grouped into subclasses. Each branch represents a cluster, whose name is labeled in the same color. In (a), 36 glutamatergic clusters derived from neuroectoderm. Root is NEC and tips are E14.5 terminal CR Glut cluster and P56 terminal nonIT and IT cell clusters. In (b), for neuroglia, root is RG and tips are 15 P56 terminal OPC-Oligo and Astro-TE clusters. In (c-d), MGE and CGE GABAergic neurons are derived from distinct trajectory trees. For MGE, root is MGE GABA RG and tips are 32 P56 terminal CTX-MGE and CNU-MGE clusters. For CGE, tips are 29 P56 terminal CTX-CGE clusters. Marker genes for each branch point are shown along each branch. Branch lengths represent pseudo-time, a measurement of how much progress an individual cell type has made through a process such as cell differentiation. Internal nodes on each branch represent cells from that cluster subdivided by synchronized age bins.
Figure 4.
Figure 4.. Gene co-expression modules across cell types and ages during development.
Module gene expression heatmap of each class in the developing taxonomy. Clusters are organized by gene co-expression modules shown as color bars on the right side of the heat map and by age bin and class on the top of the heatmap. Module score is the mean expression of genes in the module within each cluster. Significant GO enrichment terms of gene modules are highlighted.
Figure 5.
Figure 5.. Dynamic gene expression changes before and after eye opening.
(a)-(d) UMAP representation of the IT Glut and IMN IT cell types (a), nonIT Glut and IMN nonIT cell types (b), CTX-MGE GABA and CNU-MGE GABA cell types (c) and CTX-CGE GABA (d) colored by subclass and age (before eye opening: P7–10; after eye opening: P11–15). (e) DE genes between before and after eye-opening age points for all cell subclasses. Bottom, log2 fold change of each DE gene. Middle, number of DE genes up or down regulated during eye opening. Top, sum of log2 fold changes of all DE genes up or down regulated during eye opening. (f) Heat map showing the expression of specific DE genes in each subclass before and after eye opening. (g-j) Expression changes of IEGs on IT (g), nonIT (h), CTX-MGE and CNU-MGE (i) and CTX-CGE (j) UMAPs. (k) GO enrichment dot plot showing example significant top GO terms before or after eye opening in each neuronal subclass. Dot size and color indicate gene ratio (the percentage of genes that are present in a GO term compared to the total number of genes in that category) and significance (-log adjP value), respectively. Max gene ratio was set to 0.2 and max significance was set to 20.
Figure 6.
Figure 6.. Integration of scRNA-seq and Multiome data and identification of transcription factor regulators for cell-type specific epigenomic dynamics.
(a-c) UMAP representation of scRNA-seq and Multiome cells in the integrated space, colored by subclass (a), age group (b), and modality (c). The scRNA-seq cells shown in the UMAP are the subsampled ones (up to 200 cells per cluster) used for scVI integration. (d-g) Transcription factor motif enrichment for chromatin accessibility peak modules with different cell type and temporal specificities in IT (d), nonIT (e), RG/IP/Glia (f), and GABA (g). Within each panel, the dot plot at the top shows the average motif frequency for each peak module, dot size indicates the frequency, and color corresponds to the frequency normalized for each motif with maximum of 1. The large heatmap at the bottom shows the average accessibility for each peak module (in columns) across each subclass-by-age group (in rows). Accessibility values are normalized per peak module with 1 indicating the maximum value, and 0 indicating no accessibility. The heatmap at the left shows the average expression of specific transcription factors belonging to the motif families across each subclass-by-age group. The values are normalized per gene with 1 indicating the maximum value, and 0 indicating no expression.
Figure 7.
Figure 7.. Differential accessibility peaks associated with the Cux2 gene in different cell types or different developmental ages.
(a) Heatmap representation of accessibility of differentially accessible peaks located in Cux2 gene body and 50 Kb upstream. Each row corresponds to a peak, ordered by peak module, and each column corresponds to a cell category defined by subclass and age group. The Cux2 gene expression level is shown in purple at the top. The heatmap color represents the average peak accessibility (height) in each subclass-by-age-group category, normalized with 1 indicating the maximum value for each peak and 0 indicating no accessibility. The peak module and maximum peak height are shown for each peak to the right. Specific peaks are numbered and labeled. (b) The accessibility tracks per subclass surrounding the Cux2 gene, along with the genomic locations of labeled peaks in (a). TSS, transcription start site. (c) UMAP representation of Multiome cells, colored by Cux2 expression and accessibility of a subset of peaks labeled in (a).
Figure 8.
Figure 8.. Cell-type specific chromatin accessibility changes before and after eye opening.
(a) Heatmap representation of accessibility of DA peaks before and after eye opening. Each row corresponds to a peak, ordered by the subclass and age group with maximum accessibility. (b) Number of DA peaks before and after eye opening shared among different glutamatergic subclasses. Each column corresponds to a combination of different subclasses, and the bar height represents the number of peaks shared by the given combination of subclasses. The bar graph to the left of the subclass labels shows the total number of DA peaks for each subclass before or after eye opening. (c) Correlation of the chromatin accessibility changes before and after eye opening among all subclasses. The chromatin accessibility change is measured as the difference of average peak height between the two age groups for the given subclass, based on all the DA peaks defined in (a). (d) Cumulative positive and negative changes for each subclass before and after eye opening based on all the DA peaks defined in (a). (e) The differential motifs between increased and decreased DA peaks identified in each subclass. The average number of motif occurrences per peak is shown on the Y axis, the -log10(adjusted P value) for significance is labeled for each comparison. The expression values of putative transcription factor regulators are shown in the UMAP.

References

    1. Petilla Interneuron Nomenclature Group et al. Petilla terminology: nomenclature of features of GABAergic interneurons of the cerebral cortex. Nat Rev Neurosci 9, 557–68 (2008). - PMC - PubMed
    1. Zeng H. & Sanes J. R. Neuronal cell-type classification: challenges, opportunities and the path forward. Nat Rev Neurosci 18, 530–546 (2017). - PubMed
    1. Yuste R. et al. A community-based transcriptomics classification and nomenclature of neocortical cell types. Nat Neurosci 23, 1456–1468 (2020). - PMC - PubMed
    1. Harris K. D. & Shepherd G. M. The neocortical circuit: themes and variations. Nat Neurosci 18, 170–81 (2015). - PMC - PubMed
    1. Cadwell C. R., Bhaduri A., Mostajo-Radji M. A., Keefe M. G. & Nowakowski T. J. Development and Arealization of the Cerebral Cortex. Neuron 103, 980–1004 (2019). - PMC - PubMed

Publication types