[Preprint]. 2025 Jul 29:2025.01.06.630955.
doi: 10.1101/2025.01.06.630955.

Butyrolactol A potentiates caspofungin efficacy against resistant fungi via phospholipid flippase inhibition

Affiliations

Butyrolactol A potentiates caspofungin efficacy against resistant fungi via phospholipid flippase inhibition

Xuefei Chen et al. bioRxiv. .

Abstract

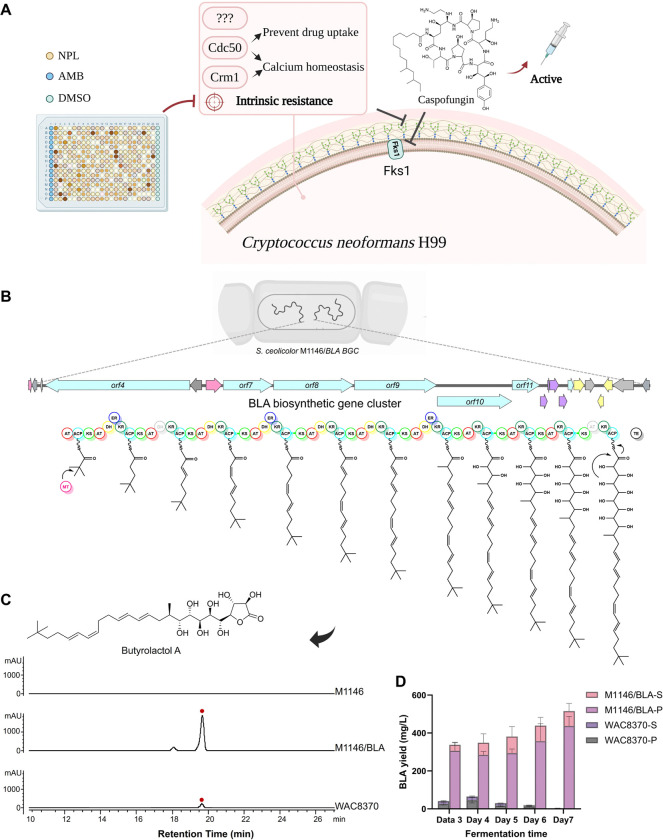
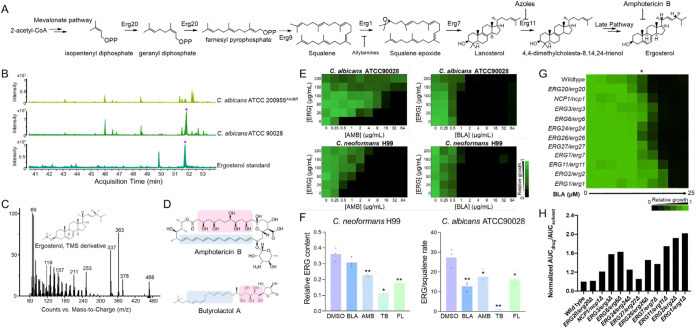
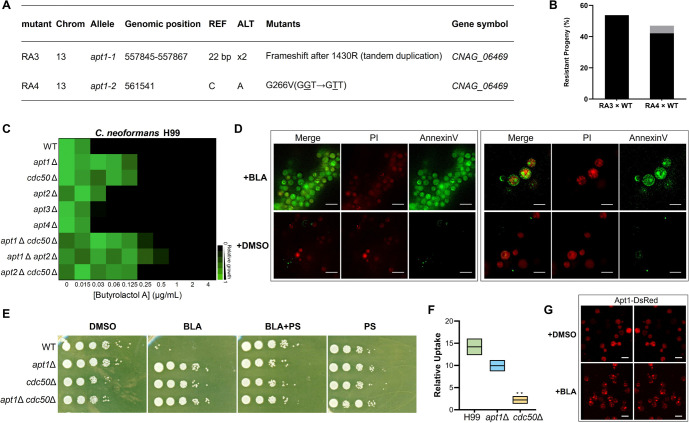
Fungal infections cause millions of deaths annually and are challenging to treat due to limited therapeutic options and rising resistance. Cryptococci are intrinsically resistant to the latest generation of antifungals, echinocandins, while Candida auris, a notorious global threat, is also increasingly resistant. We performed a natural product extract screen to rescue caspofungin fungicidal activity against Cryptococcus neoformans H99 and identified butyrolactol A, which restores echinocandin efficacy against resistant fungal pathogens, including multidrug-resistant C. auris. Mode of action studies revealed that butyrolactol A inhibits the phospholipid flippase Apt1-Cdc50, blocking phospholipid transport. Cryo-electron microscopy analysis of the Apt1•butyrolactol A complex revealed that the flippase is trapped in a dead-end state. Apt1 inhibition disrupts membrane asymmetry, vesicular trafficking, and cytoskeletal organization, thereby enhancing echinocandin uptake and potency. This study identifies lipid flippases as promising antifungal targets and demonstrates the potential of revisiting natural products to expand the antifungal arsenal and combat resistance.

Keywords: Apt1–Cdc50; Candida auris; Cryptococcus; antifungal; echinocandin; flippase; fungal resistance; natural product; synergy.


Conflict of interest statement

DECLARATION OF INTERESTS L.E.C. is a co-founder and shareholder in Bright Angel Therapeutics, a platform company for the development of novel antifungal therapeutics. E.D.B is the CEO and L.E.C. and G.D.W. are Science Advisors for Kapoose Creek Bio, a company that harnesses the therapeutic potential of fungi. All other authors have no competing interests to declare.

Figures

Figure 1.
Figure 1.. A high throughput screen for potentiators of caspofungin against Cryptococcus neoformans H99 and generation of high-yield biosynthetic producers of butyrolactol A.
(A) Overview of the screening strategy using the natural product library (NPL) to identify caspofungin potentiators that can overcome intrinsic resistance in Cryptococcus species. Amphotericin B (AMB) is a positive antifungal control. See also Figure S1A. (B) Identification and expression of the butyrolactol A (BLA) biosynthetic gene cluster (BGC) from the genome of Streptomyces ardesiacus WAC8370. The organization of BLA BGC is color-coded: blue for polyketide backbone (PKS), purple for hydroxymalonyl-ACP biosynthesis genes, pink for the transcriptional regulator, light yellow for the transporter, and grey for other genes. PKS domains are labeled as follows: AT, acyltransferase; KS, keto synthase; ACP, acyl carrier protein; KR, ketoreductase; DH, dehydratase; ER, enoylreductase; TE, thioesterase. See also Table S4. (C) Chromatographic analysis of BLA produced by heterologous hosts, compared to the natural producer S. ardesiacus WAC8370. M1146 refers to S. coelicolor M1146; M1146/BLA contains the butyrolactol A biosynthetic gene cluster. See also Figure S3. (D) Refactoring and heterologous expression significantly enhanced the production of butyrolactol A over time. Extracellular and intracellular levels of butyrolactol A were quantified in wild-type S. ardesiacus WAC8370 and the engineered S. coelicolor strain (M1146/BLA) from day 3 to day 7 of fermentation. S = supernatant (conditioned media); P = pellet (cell-associated fraction).
Figure 2.
Figure 2.. Butyrolactol A synergizes with caspofungin in Cryptococcus spp. and multidrug-resistant Candida auris.
(A) Checkerboard assays depicted as heatmaps show the average growth of biological duplicates, normalized to no compound controls. Compound potentiation was assessed against C. neoformans H99 and JEC20, C.s gattii R265 and WM276, and C. auris CBS12766 and CBS12776. Relative growth is quantitatively represented by color (see scale bar at the bottom right). Fractional Inhibitory Concentration Index (FICI) values were calculated as described in the methods and are displayed in the top right corner of each checkerboard. FICI values below 0.5 indicate synergistic interactions. The yellow asterisk highlights the rescue concentration of butyrolactol A (BLA), which reduces the minimum inhibitory concentration (MIC) of caspofungin to 2 μg/mL. See also Figure S4A. (B) Fungicidal activity of BLA + CAP combination treatment. Fungal colony-forming units (CFUs) were quantified following 24 h and 48 h treatments with vehicle control (NT), butyrolactol A (BLA), caspofungin (CAP), their combination (BLA + CAP), amphotericin B (AmB), and fluconazole (FL). (Top) C. auris CBS12766: BLA (2 μg/mL), CAP (2 μg/mL), AmB (4 μg/mL), FL (64 μg/mL). (Bottom) C. neoformans H99: BLA (0.5 μg/mL), CAP (4 μg/mL), AmB (0.5 μg/mL), FL (8 μg/mL). Data are presented as mean ± SEM from three independent biological replicates. p-values were calculated using unpaired t-tests, statistically significant comparisons are indicated on the graph. Samples with no detectable CFUs (CFU = 0) were considered below the detection limit and are plotted as log10 CFU/mL = 0 for visualization only. See also Figure S4B. (C) C. elegans were infected with C. auris CBS 12766 (upper) and G. mellonella were infected with C. neoformans H99 (bottom). Survival was monitored in the presence of butyrolactol A (BLA), caspofungin (CAP), the combination of both, amphotericin B (AMB)or without treatment. For each condition, 20 C. elegans worms were used, and survival was tracked over 48 hours across 3 independent trials. Similarly, 10 G. mellonella larvae were used for each condition, and survival was tracked over ten days after injection with ~106 per larvae in 3 independent trials. Survival was plotted using a Kaplan-Meier survival curve. Significance was determined using the Log-rank (Mantel-Cox) test, comparing monotherapy of CAP and BLA to combination therapy, with the corresponding p-values indicated as numerical values or **** for p < 0.0001. (D) G. mellonella larvae infected with C. neoformans H99 were treated with butyrolactol A (BLA) + caspofungin (CAP) at ¼ MIC each, amphotericin B (AMB, MIC), or vehicle as control (H99). Fungal burden (CFU per larva) was quantified at Day 2 and Day 4 post-infection. Data are presented as mean ± SEM from 6 larvae per group. Statistical significance was determined using Dunnett’s multiple comparisons test relative to the infected control group: *p < 0.05, **p < 0.01, ***p < 0.001, ****p < 0.0001. (E) Histopathological analysis of G. mellonella tissues following treatment of C. neoformans infection. Representative histological sections of G. mellonella larvae harvested 2 days post-infection with C. neoformans H99, subjected to different treatments. Tissues were stained with hematoxylin and eosin (H&E) or periodic acid–Schiff (PAS) and imaged at 20× magnification. The panels show fungal morphology, host immune responses, and tissue integrity across treatment conditions. E, epithelial layer; FB, fat body; h, hemocyte; N, hemocyte nodule; M, muscle; m, melanin; T, trachea. Black arrows indicate encapsulated yeast cells of C. neoformans localized within hemocyte nodules, consistent with immune activation. Scale bar = 20 μm. See also Figure S4C. (F) Butyrolactol A and caspofungin combination reduces C. auris fungal burden in a murine skin colonization model. C57BL/6N mice were topically infected with C. auris CBS12776 (1 × 10⁸ CFU) and treated with vehicle, butyrolactol A (BLA, 10 mg/kg), caspofungin (CAP, 10 mg/kg), amphotericin B (AmB, 25 mg/kg), or BLA–CAP combination at subtherapeutic doses. Treatments were administered at 24, 26, 28, and 44 h post-infection. Fungal burden was quantified at 48 h from homogenized skin tissue. Each dot represents one animal, and data are presented as mean ± s.e.m. Statistical analysis was performed using the Kruskal–Wallis test followed by Dunn’s multiple comparisons test; *p < 0.05, **p < 0.01, ***p < 0.001, ****p < 0.0001. See also Figure S4D.
Figure 3.
Figure 3.. Butyrolactol A perturbs sterol homeostasis without directly targeting ergosterol or the cell wall.
(A) Simplified schematic of the ergosterol biosynthesis pathway, along with antifungals targeting ergosterol or its biosynthesis. (B) Gas chromatography-mass spectrometry (GC-MS) analysis of ergosterol in amphotericin B-resistant C. albicans ATCC200955 (upper) and amphotericin B-sensitive C. albicans ATCC90028 (middle). The ergosterol standard is shown as a reference (bottom). (C) Chemical structure and GC-MS spectrum of ergosterol-TMS derivative. (D) Structural comparison of butyrolactol A and amphotericin B, highlighting structural similarities. The hydrophobic polyene region is indicated in blue, while the hydrophilic polyol structure is in pink. (E) Rescue effect of exogenous ergosterol (ERG) on cell viability during treatment with butyrolactol A (BLA), with amphotericin B (AMB) used as a positive control. Two-fold serial dilutions of ergosterol were added to C. neoformans H99 and C. albicans ATCC90028 in the presence of AMB or BLA, respectively. Biological duplicates were averaged and normalized to no-drug and no-ergosterol controls. Relative growth is quantitatively represented by color (see scale bar at the bottom right). (F) Relative ergosterol (ERG) abundance in C. neoformans H99 and C. albicans ATCC90028, treated or untreated with butyrolactol A and different agents targeting ergosterol biosynthesis: amphotericin B (AMB), terbinafine (TB), and fluconazole (FL). The median value of three biological replicates is represented by the height of each bar, with individual experimental values indicated by dots. Significance was determined by one-way ANOVA with Dunnett’s multiple comparisons test, comparing each treatment to the untreated control (* p < 0.05, ** p < 0.01, t-test). (G) In vitro susceptibility of C. albicans wild-type (WT) and heterozygous-deletion mutants to BLA. Dose-response assays were performed in YPD medium, with growth measured by absorbance at 600 nm after 24 hours at 30°C. Optical densities were averaged from duplicate measurements and normalized to the growth of untreated WT strains. Results are depicted as in Figure 2A (see bar for scale). (* indicates concentrations selected for plotting the growth curve). (H) Relative growth of C. albicans strains at 1.56 μM BLA (indicated by * in Figure 3G). The area under the growth curve (AUC) for strains in the presence of BLA was normalized to their AUC in the absence of BLA to eliminate baseline growth discrepancies. Data are presented as the mean of technical replicates.
Figure 4.
Figure 4.. Identification of butyrolactol A as an inhibitor of the flippase complex Apt1–Cdc50.
(A) Genotypes of BLA-resistant mutants, carrying mutations in APT1 (CNAG_06469). See also BLA susceptibility results in Figure S5A and the mutations mapped onto the Apt1 structure in S5B. (B) Results of the genetic cross between BLA-resistant mutants and the wild-type strain (KN99a). The y-axis represents the percentage of resistant progeny, with the inherited resistant genotypes from the parent strains shown in black. The x-axis shows different cross tests between independent resistant mutants RA3 and RA4 (as mentioned in Figure 4A) and the wild-type strain KN99a (WT). See also Table S8. (C) Dose-response assays were performed against wild-type C. neoformans (H99) and various flippase-compromised mutants. Growth was measured using absorbance at 530 nm in SDB medium at 30 °C after 48 hours. Growth relative to untreated wild-type control wells is presented in a heatmap format (see scale bar). Each colored box represents the mean of duplicate experiments. (D) C. neoformans H99 cells in log phase were treated with BLA (upper) or an equivalent amount of DMSO (bottom) and were co-incubated with Annexin V Alexa Fluor 488 and Propidium Iodide (PI), then observed using fluorescence microscopy. The Annexin V Alexa Fluor 488 signal was detected in the FITC channel, and the PI signal was detected in the TexRed channel. Scale bars are shown in each image: 10 μm (left column) and 5 μm (right column). (E) The effect of exogenous phosphatidylserine (PS) on the viability of wild-type C. neoformans H99, apt1Δ, cdc50Δ, and apt1Δ cdc50Δ mutants in the presence or absence of BLA. Strains were inoculated in SDB medium treated with BLA, PS, or a combination of BLA and PS for 24 hours. Equivalent vehicle DMSO was used as a control. Ten-fold serial dilutions of the 24-hour cultures were spotted onto yeast extract peptone dextrose (YPD) plates. Plates were incubated at 30 °C for 2 days before imaging. (F) The relative intracellular concentrations of BLA accumulated in C. neoformans H99 and apt1Δ and cdc50Δ mutants were measured after 15 minutes of treatment. Data are presented as mean ± SD of biological triplicates. Statistical significance was determined using multiple unpaired t-tests with Holm-Sidak’s multiple comparisons correction, comparing all conditions to wild-type H99. p-values: ** <0.01. (G) Localization of DsRed-Apt1p in C. neoformans H99 cells with (upper row) and without (lower row) BLA treatment. Representative Airyscan super-resolution 3D images. Z-stacks were reconstructed into 3D projections. The left and right panels show the same cell from two different viewing angles to illustrate its spatial distribution. Scale bar, 5 μm.
Figure 5.
Figure 5.. Cryo-EM reveals butyrolactol A binding to Apt1–Cdc50 and obstruction of the lipid transport channel.
(A) Overall structure of C. neoformans Apt1–Cdc50 bound with BLA (salmon spheres) in the E2P state with major domains shown in different colors. The global view on the left is also shown with the cryo-EM map density fit. TM-domain, transmembrane domain; S-domain, support domain; T-domain, transport domain; P-domain, phosphorylation domain; A-domain, actuator domain; N-domain, nucleotide-binding domain. Top right: enlarged view of BLA binding site with the EM density of BLA and its surrounding residues superimposed on the atomic model and shown as transparent surfaces. BLA and residues surrounding the BLA binding site are shown in sticks. The key residues forming either H-bonds (indicated by dashed line with a cutoff distance of 3.5 Å) or hydrophobic interactions (cutoff distance: 4.0 Å) with BLA are labeled in red. A 2D plot of BLA and its interacting residues is also shown next to the corresponding 3D view. Bottom right: enlarged view of the autoregulatory C-tail with the GFGFT motif shown in teal sticks. (B) Binding of BLA to Apt1 in the E2P state induces closure of the lipid entry site shown in hydrophobicity surface. BLA is shown in salmon sticks and a cartoon representation of the lipid entry site boxed in red is also shown in the inset with the entry closing residues in cyan sticks. (C) Lipid entry site of S. cerevisiae Dnf1 in the E2P state remains open upon binding of the substrate lipid PC as shown in the hydrophobicity surface (PDB ID 7KYC). PC is shown in magenta sticks and a cartoon representation of the lipid entry site in the open state boxed in red is also shown in the inset. (D) Lipid entry site of Apt1 in the E1 state is closed as shown in the hydrophobicity surface (PDB ID 9DZV, this study). A cartoon representation of the closed lipid entry site boxed in red is also shown in the inset with interacting residues in cyan sticks. (E) The closed lipid entry site of S. cerevisiae Dnf1 in the E1 state as shown in the hydrophobicity surface (PDB ID 7KY6). A cartoon representation of the entry closing boxed in red is also shown in the inset with interacting residues in cyan sticks. (F) BLA susceptibility of wild-type C. neoformans H99 and various mutants, including FLAG-tagged Apt1 (Apt1-FLAG), single substitutions P127A, I481A, S482A, N1109A, a quintuple mutant (I130A, I134A, I485A, I493A, I1118A), and the Apt1-FLAG promoter disrupted mutant. Relative growth is shown in heat-map format (see scale bar). Each colored box represents the mean of duplicate measurements. Refer to the transcriptional and translational levels of Apt1 in wild-type and mutant strains in Figures S9B and S9C. (G) BLA inhibition of PS-stimulated ATPase activity of wild-type C. neoformans Apt1 and mutants P127A and N1109A in the presence of 0.05 mM PS and increasing concentrations of BLA. The control activity in the absence of BLA was taken as 100% for each protein and data were fitted to an inhibitory dose-response equation with variable slope and IC50 indicated by the arrow. Data points represent the mean ± SD in triplicate (n = 3) for WT and duplicate (n = 2) for mutants. Refer to Figure S9D for activity comparison between WT and mutants without BLA.
Figure 6.
Figure 6.. BLA inhibition of Apt1–Cdc50 disrupts membrane architecture and trafficking.
(A) Cellular and extracellular ATP levels were measured following treatment. Log-phase C. neoformans H99 cells were cultured in SDB medium in the presence of amphotericin B (AMB), terbinafine (TB), butyrolactol A (BLA), or vehicle (−). Data are expressed as the mean ± SD of biological triplicates. Statistical significance was determined by multiple t-tests compared to the vehicle control (*P < 0.05, **P < 0.01). (B) ATP leakage was tracked by the extracellular ATP of C. neoformans H99 measured at 0.5-, 1.5-, and 2.5-hours post-treatment. 5-fluorocytosine (5FC), Fluconazole (FL). Experiments were performed in triplicate, and error bars represent standard deviations (n = 3). Statistical significance was assessed by multiple t-tests, with significance denoted by asterisks (*P < 0.05, **P < 0.01) for each treatment compared to the vehicle control. (C) C. neoformans accumulates abnormal membrane structures following BLA treatment. Cells were grown in SDB medium with BLA or vehicle, fixed, and visualized using transmission electron microscopy (TEM). Vehicle (DMSO) treated cells are shown in (a), while cells treated with 1 μM BLA are displayed in (b-d), and cells treated with 0.5 μM BLA in (e-f), with (f) showing a magnified view. Membrane defects in BLA-treated cells include enlarged atypical vacuoles (AV), double-membrane rings, crescent-shaped structures (white arrowheads), accumulated vesicles (black arrowheads), electron-dense misfolded membranes (red arrowheads), lipid bodies (LB), nuclei (N), mitochondria (M), and vacuoles (V). (D) BLA two-fold dose-response assays were conducted using wild-type and conditional expression C. albicans strains of PAN1 (tetO-PAN1/pan1Δ), CDC50 (tetO-CDC50/cdc50Δ), and CHC1 (tetO-CHC1/chc1Δ) with varying concentrations of doxycycline (DOX, 0.05 μg/mL and 20 μg/mL). Growth was measured by absorbance at 600 nm after 48 hours at 30°C. Data are presented as a heatmap, with color representing relative growth, normalized to no-drug controls. (E) Endocytosis was assessed in C. neoformans H99 treated with or without BLA. Mid-log-phase cells were stained with FM 4–64 and DAPI, then visualized by fluorescence microscopy (100×). Yellow arrowheads indicate abnormal vacuoles/endosomes, and blue arrowheads indicate DAPI-stained nuclei. Scale bar (5 μm) is located at the bottom left. (F) The effect of BLA on actin cytoskeleton organization in C. neoformans H99 was examined by epifluorescence microscopy. Early-log-phase cells treated with low concentrations of BLA, or vehicle were fixed and stained with Alexa Fluor 568 phalloidin, and mounted with DAPI. Scale bar = 2 μm. (G) In vitro BLA susceptibility of C. albicans wild-type (WT) and heterozygous deletion mutants for genes involved in actin assembly. Dose-response assays were performed in YPD medium, with growth measured by absorbance at 600 nm after 24 hours at 30 °C. Data are depicted as in panel (D). (* indicates concentrations selected for growth curve plotting in Figure S10D). (H) Synergy plots for BLA in combination with drugs targeting ergosterol or its biosynthesis. Checkerboard assays, presented as heatmaps, show the average growth inhibition of C. albicans ATCC200955 across biological triplicates, normalized to no-compound controls. Fractional Inhibitory Concentration Index (FICI) values are shown in the top right of each heatmap, with values <0.5 indicating synergistic interactions.
Figure 7.
Figure 7.. Butyrolactol A (BLA) potentiates the fungicidal activity of caspofungin against Cryptococci by inhibiting the Apt1–Cdc50 complex.
(A) Schematic illustrating the proposed mechanism of action for BLA. The misloading of BLA blocks the entrance of the phospholipid substrate, resulting in impaired membrane asymmetry, which disrupts membrane organization and vesicle budding, ultimately blocking secretory and endocytosis pathways. Color coding is indicated within the figure. (B) Susceptibility of FK506 against C. neoformans H99 and flippase-deficient (cdc50Δ, apt1Δ, and apt1Δ cdc50Δ). A broth microdilution assay was performed in RPMI 1640 medium, and growth was measured by absorbance at 530 nm after 48 hours at 30 °C. Results are analyzed and depicted as described in Figure 5F. (C) Susceptibility of caspofungin against C. neoformans H99 wild type, apt1Δ, cdc50Δ and apt1Δ cdc50Δ mutants. Dose-response assays were performed, and data were analyzed as described in Figure 5F. Relative growth is represented quantitatively by color (see bar for scale). (D) Relative caspofungin accumulation in C. neoformans H99 wild type, with or without BLA, and in apt1Δ and cdc50Δ mutants after 15 minutes of treatment. All experiments were performed in biological triplicates, and data are presented as mean ± SEM. Significance was determined using multiple unpaired t-tests, comparing the wild-type without BLA to each group; p-value: *< 0.05, ** < 0.01. (E) The synergistic effect of caspofungin and BLA was assessed against C. neoformans H99 wild type, apt1Δ, cdc50Δ, and apt1Δ cdc50Δ mutants. Checkerboard assays were performed in SDB medium at 30 °C, and growth was measured by absorbance at 530 nm after 48 hours. Biological duplicates were averaged, and measurements were normalized to no-drug controls and depicted as heatmaps. Relative growth is represented quantitatively by color (see scale bar at the bottom right).

References

    1. Iliev I.D., Brown G.D., Bacher P., Gaffen S.L., Heitman J., Klein B.S., and Lionakis M.S. (2024). Focus on fungi. Cell 187, 5121–5127. 10.1016/j.cell.2024.08.016. - DOI - PMC - PubMed
    1. Denning D.W. (2024). Global incidence and mortality of severe fungal disease. Lancet Infect. Dis. 24, e428–e438. 10.1016/S1473-3099(23)00692-8. - DOI - PubMed
    1. Brown G.D., Denning D.W., Gow N.A.R., Levitz S.M., Netea M.G., and White T.C. (2012). Hidden Killers: Human Fungal Infections. Sci. Transl. Med. 4, 165rv13–165rv13. 10.1126/scitranslmed.3004404. - DOI
    1. Bongomin F., Gago S., Oladele R., and Denning D. (2017). Global and Multi-National Prevalence of Fungal Diseases—Estimate Precision. J. Fungi 3, 57. 10.3390/jof3040057. - DOI
    1. Lionakis M.S., and Chowdhary A. (2024). Candida auris Infections. N. Engl. J. Med. 391, 1924–1935. 10.1056/NEJMra2402635. - DOI - PubMed

Publication types