[Preprint]. 2025 Jan 8:2024.12.25.630221.
doi: 10.1101/2024.12.25.630221.

ChromBPNet: bias factorized, base-resolution deep learning models of chromatin accessibility reveal cis-regulatory sequence syntax, transcription factor footprints and regulatory variants

Affiliations

ChromBPNet: bias factorized, base-resolution deep learning models of chromatin accessibility reveal cis-regulatory sequence syntax, transcription factor footprints and regulatory variants

Anusri Pampari et al. bioRxiv. .

Abstract

Despite extensive mapping of cis-regulatory elements (cREs) across cellular contexts with chromatin accessibility assays, the sequence syntax and genetic variants that regulate transcription factor (TF) binding and chromatin accessibility at context-specific cREs remain elusive. We introduce ChromBPNet, a deep learning DNA sequence model of base-resolution accessibility profiles that detects, learns and deconvolves assay-specific enzyme biases from regulatory sequence determinants of accessibility, enabling robust discovery of compact TF motif lexicons, cooperative motif syntax and precision footprints across assays and sequencing depths. Extensive benchmarks show that ChromBPNet, despite its lightweight design, is competitive with much larger contemporary models at predicting variant effects on chromatin accessibility, pioneer TF binding and reporter activity across assays, cell contexts and ancestry, while providing interpretation of disrupted regulatory syntax. ChromBPNet also helps prioritize and interpret regulatory variants that influence complex traits and rare diseases, thereby providing a powerful lens to decode regulatory DNA and genetic variation.


Conflict of interest statement

Competing interests: A.S. was a consultant for MyoKardia. W.J.G. is a consultant and equity holder for 10x Genomics, Nvidia, Guardant Health, Quantapore, and Ultima Genomics, and cofounder of Protillion Biosciences, and is named on patents describing ATAC-seq.. A.S is an employee of Insitro. S.N is an employee of Genentech. A.S.K is an employee of Ultima Genomics. V.R is an employee of Rockefeller University. A.K. is on the scientific advisory board of SerImmune, TensorBio, AINovo, is a consultant with Arcardia Science, Inari, Precede Biosciences, was a consultant with Illumina and PatchBio and has a financial stake in DeepGenomics, Immunai and Freenome.

Figures

Extended Figure 1:
Extended Figure 1:. Convolutional neural networks accurately predict base-resolution DNase-seq profiles from local DNA sequence context but are confounded by DNase-I sequence bias.
(a) Exemplar locus on chr11 (held-out test chromosome) showing observed (Obs) DNase-seq profiles, BPNet predicted (Pred) profiles at multiple resolutions and DeepLIFT sequence contribution scores to count and profile shape predictions. High count contribution scores highlight TF motif instances, whereas high profile contributions also capture spurious features that resemble DNase-I sequence preference. (b) Top 15 TF-MODISCO contribution weight matrix (CMW) motifs derived from count contribution scores of the K562 DNase-seq BPNet model map to well known TF motifs. (c) Top 15 TF-MODISCO contribution weight matrix (CMW) motifs derived from profile contribution scores of the K562 DNase-seq BPNet model map to well known TF motifs. (d) Comparison of the frequency of high-confidence predictive instances (seqlets) of each TF-MODISCO motif identified from the count and profile heads show that Dnase-I bias motifs moderately dominate the profile contribution scores over TF motifs.
Extended Figure 2:
Extended Figure 2:. Comparison of count and profile head performance across different models, assays and cell-lines.
(a) Uncorrected total count predictions from expanded BPNet models and bias-factorized ChromBPNet models of K562 ATAC-seq data show identical similarity to the measured total counts. (b,c) ChromBPNet models trained on ATAC-seq and DNase-seq data from diverse cell-lines show comparable and stable total count prediction performance (b) and profile prediction performance (c) across folds (box-plots), assays and cell-lines despite differences in read depth.
Extended Figure 3:
Extended Figure 3:. Performance evaluation of BPNet bias models:
(a,b) Comparison of position frequency matrices derived from k-mers centered on 5’ ends of GM12878 ATAC-seq reads (a) and DNase-seq reads (b) (from chr20) mapping to the + strand only, - strand only, or both strands with different strand-specific shifts (+4/−5 or +4/−4 for ATAC-seq and 0/0 or 0/+1 for DNase-seq). The +4/−4 shift and the 0/+1 shifts correct the misalignment of strand-specific Tn5 and DNase-I PWMs respectively. Filter weights from the 1-filter CNN chromatin background bias model shows correct Tn5 and DNase-I bias motifs when trained on ATAC-seq reads with +4/−4 shift and DNase-seq reads with 0/+1 shifts respectively. (c,d) GM12878 ATAC-seq chromatin background BPNet bias model shows strong prediction of total counts in background regions of held-out test chromosomes (c) and strong prediction of profile shape (d) (blue distribution) relative to shuffled observed profiles (grey distribution) and average observed profiles (green distribution) in background regions of held-out test chromosomes. (e) GM12878 ATAC-seq chromatin background BPNet bias model shows poor prediction of total counts in ATAC-seq peak regions in held-out test chromosomes, indicating that bias does not affect total counts in peaks. (f) GM12878 ATAC-seq chromatin background BPNet bias model achieves high performance (blue distribution) at predicting profile shapes in peak regions in held-out test chromosomes compared to pseudoreplicate concordance (red), outperforming average observed profiles (green) and shuffled observed profiles (grey) baselines, suggesting Tn5 bias strongly influences profile shapes in peaks. (g,h) Performance of chromatin background BPNet bias models at predicting total counts (g) and profile shapes (h) in peak regions in held-out test chromosomes for ATAC-seq and DNase-seq data from diverse cell-lines. (i) Schematic of the marginal footprinting approach that averages model predictions over a library of background sequences containing a centrally embedded query motif. (j,k) Marginal footprints of various Tn5 (j) and DNase-I (k) TF-MODISCO bias motifs (rows) from predicted profiles of GM12878 ATAC-seq (j) and DNase-seq (k) chromatin background BPNet bias models.
Extended Figure 4:
Extended Figure 4:. Tn5 bias models derived from naked DNA transposition libraries differ from those derived from chromatin background resulting in incomplete bias correction.
(a) TF-MODISCO motifs derived from profile contribution scores of BPNet bias models trained on naked DNA transposition library (column 1) show stronger A/T content compared to those derived from bias models trained on HepG2 (col2) and GM12878 (col3) ATAC-seq background chromatin profiles. (b) Top ranked TF-MODISCO motifs derived from profile contribution scores of peak regions from GM12878 ATAC-seq ChromBPNet models coupled to BPNet bias model trained on naked DNA library (col1) or chromatin background from HepG2 ATAC-seq experiment (col2). The former show strong G/C contamination of learned TF motifs showing incomplete bias correction. (c) Marginal footprints of various TF-MODISCO Tn5 bias motifs (rows) using predicted profiles from GM12878 ATAC-seq ChromBPNet models using different bias models (no bias model, naked DNA bias model, HepG2 chromatin background bias model, GM12878 chromatin background bias model) show that the naked DNA BPNet bias model does not completely eliminate Tn5 bias and that chromatin bias models can provide very effective bias correction even across cell-lines. (d) Marginal footprints of various predictive TF motifs (rows) using predicted profiles from GM12878 ATAC-seq ChromBPNet models that use different bias models show that naked DNA BPNet bias model does not completely eliminate Tn5 bias (especially visible for NFYA, POU2F2 and the control motif of GATA1 that is not expressed in GM12878).
Extended Figure 5:
Extended Figure 5:. Bias-factorized ChromBPNet models of DNase-seq profiles coupled to neural network models of DNase-I bias deconvolve DNase-I bias from regulatory TF motif syntax.
(a) TF-MODISCO motifs derived from profile contribution scores of HEPG2 BPNet bias model trained on chromatin background capture different variations of the canonical DNase-I sequence preference motif (b) Exemplar locus at chr20:3,753,160–3,753,300 showing several tracks from top to bottom: observed GM12878 DNase-seq profile; uncorrected predicted profile from ChromBPNet; uncorrected profile contribution scores from ChromBPNet shows spurious DNase-I bias; predicted DNase-I bias profiles from BPNet bias model shows moderate resemblance to observed and uncorrected profiles; profile contribution scores from bias model match spurious DNase-I bias features; bias-corrected predicted profile from ChromBPNet shows a strong, denoised latent footprint; bias-corrected profile contribution scores from ChromBPNet are devoid of spurious DNase-I bias highlighting CTCF and ZBTB7A motifs; predicted profiles from ChromBPNet model using HINT-ATAC’s bias correction method; profile contribution scores from HINT-ATAC ChromBPNet model show spurious DNase-I bias; predicted profiles from ChromBPNet model that uses a simplified 1-filter CNN bias model; profile contribution scores from ChromBPNet model with 1-filter CNN bias model shows spurious DNase-I bias (c) Relative frequency of high-confidence predictive instances (seqlets) of TF-MODISCO motifs derived from profile contribution scores of various ChromBPNet models trained on GM12878 DNase-seq data using different bias models (no bias model, 1-filter CNN bias model and BPNet bias model) or pre-corrected profiles (HINT-ATAC) shows that DNase-I bias motifs dominate all but the ChromBPNet model coupled with the BPNet bias model. (d) Marginal footprints of various TF-MODISCO DNase-I bias motifs (rows) using predicted profiles from GM12878 DNase-seq ChromBPNet models that use different bias models or pre-corrected profiles (cols) show that only the BPNet bias model enables near optimal correction of DNase-I bias. (e) Marginal footprints of various predictive TF motifs (rows) using predicted profiles from GM12878 DNase-seq ChromBPNet models that us different bias models or pre-corrected profiles (cols) show that only the BPNet bias model removes confounding DNase-I bias.
Extended Figure 6:
Extended Figure 6:. Additional evidence for ChromBPNet derived TF motif lexicons, cooperative composite elements and predictive motif instances with support from TF ChIP-seq.
(a) Top 10 TF-MODISCO motifs (ranked by number of predictive motif instances) derived from profile contribution scores from ATAC-seq ChromBPNet models of diverse cell-lines. Motifs names containing / refer to multiple TFs of the same family that match the motif. Motif names containing - refer to composite elements. (b) Exemplar composite motifs identified by TF-MODISCO from contribution scores derived from ChromBPNet models trained on ATAC-seq and DNase-seq data from IMR90 (FOS-TEAD composite) and GM12878 (SPI1-IRF and AP1-IRF composites). (c) Marginal profiles at FOS motif, TEAD motif, FOS-TEAD composite motif and the sum of FOS and TEAD marginal profiles from BPNet model of FOS TF ChIP-seq data from IMR90 demonstrates the super-additive cooperative effect of the FOS-TEAD composite on FOS binding (top). Variation of the strength (maximum) of predicted marginal FOS ChIP-seq profiles anchored at FOS and TEAD motifs with variable spacing inserted in background sequences shows strong cooperative effects on FOS binding only at the fixed 6 bp spacing (bottom). (d) Exemplar accessible region in chr1 near the PKLR gene in K562 displaying the observed profile from ATAC-seq and GATA1, TAL1 ChIP-seq data, alongside uncorrected and bias corrected predicted profiles, and count contribution scores from ATAC-seq ChromBPNet model and TF ChIP-seq BPNet models. Predictive motif instances from ChromBPNet and BPNet models are in strong agreement.
Extended Figure 7:
Extended Figure 7:. ChromBPNet models of DNase-seq data reveal compact TF motif lexicons, cooperative composite elements and predictive motif instances that influence chromatin accessibility and TF occupancy.
(a,b) Top 10 TF-MODISCO motifs (ranked by number of predictive motif instances) derived from count contribution scores (a) and profile contribution scores (b) from DNase-seq ChromBPNet models of diverse cell-lines. Motifs names containing / refer to multiple TFs of the same family that match the motif. Motif names containing - refer to composite elements. (c) Marginal footprints for TF-MODISCO motifs using normalized uncorrected (red) and bias-corrected profile predictions (black) from DNase-seq ChromBPNet models of diverse cell-lines. Bias-correction reveals cell-type specificity of footprints. (d) Marginal footprints for the FOS motif, TEAD motif, FOS-TEAD composite motif and the sum of FOS and TEAD marginal footprints demonstrates the super-additive cooperative effect of the FOS-TEAD composite (top). Variation of the strength (maximum) of marginal footprints anchored at FOS and TEAD TF motifs with variable spacing inserted in background sequences shows strong cooperative effects only at the fixed 6 bp spacing (bottom). (e) Exemplar accessible region in chr19 near the LDLR gene in HEPG2 displaying the observed profile from DNase-seq, alongside uncorrected and bias corrected predicted profiles, and count contribution scores from DNase-seq ChromBPNet model. (f) Exemplar accessible region in chr1 near the PKLR gene in K562 displaying the observed profile from DNase-seq, alongside uncorrected and bias corrected predicted profiles, and count contribution scores from DNase-seq ChromBPNet model.
Extended Figure 8:
Extended Figure 8:. Impact of training data read depth and variant scoring measures on ChromBPNet’s variant classification and effect prediction performance for DNase-seq QTLs (dsQTLs) in Yoruban lymphoblastoid cell lines (LCLs)
(a) Comparison of variant classification performance (average precision (AP)) of ChromBPNet models trained on GM12878 DNase-seq and ATAC-seq data (with two different read depths) at discriminating significant dsQTLs in Yoruban LCLs from control variants. Performance evaluated using different variant effect measures shows that the Integrative Prioritization Score (IPS) outperforms Active Allele Quantile (AAQ), log-fold change in predicted coverage (logFC), Jensen Shanon distance (JSD) of predicted allelic profiles, JSD x AAQ and logFC x AAQ. (b) LCL dsQTL variant classification performance (y-axis) of ChromBPNet models trained on GM12878 ATAC-seq data decreases with read depth (572M, 250M, 100M, 50M, 25M, and 5M reads) of the training dataset (x-axis). Performance of GM12878 DNase-seq models (gkmSVM, ChromBPNet and Enformer) are also shown for comparison. (c) Correlation between LCL dsQTL observed effect sizes (signed and unsigned) and GM12878 ATAC-seq ChromBPNet model’s predicted allelic log-fold changes of total counts or changes in profile shape (JSD) remain stable across most read depths (572M, 250M, 100M, 50M, 25M, and 5M reads) of the training set. Effect size prediction performance of various GM12878 DNase-seq models (gkmSVM, ChromBPNet and Enformer) are shown for comparison.
Extended Figure 9:
Extended Figure 9:. Comparison of ChromBPNet and Enformer models for variant classification and effect size prediction caQTLs across various significance thresholds.
(a) Comparison of variant classification performance (average precision (AP)) of ChromBPNet and Enformer trained on GM12878 DNase-seq or ATAC-seq data at discriminating significant ATAC-seq QTLs (caQTLs) from European LCLs at varying caQTL significance thresholds (x-axis) versus control variants. (b) Comparison of correlation between observed effect sizes (signed and unsigned) of significant caQTLs from European LCLs selected at varying thresholds (x-axis) and predicted effect sizes (top: allelic log fold change of total counts, bottom: JSD between allelic profiles) of ChromBPNet and Enformer models trained on GM12878 DNase-seq or ATAC-seq data. (c) Comparison of variant classification performance of ChromBPNet and Enformer trained on GM12878 DNase-seq or ATAC-seq data at discriminating significant ATAC-seq QTLs (caQTLs) from African LCLs at varying caQTL significance thresholds (x-axis) versus control variants. (d) Comparison of correlation between observed effect sizes (signed and unsigned) of significant caQTLs from African LCLs selected at varying thresholds (x-axis) and predicted effect sizes (top: allelic log fold change of total counts, bottom: JSD between allelic profiles) of ChromBPNet and Enformer models trained on GM12878 DNase-seq or ATAC-seq data. (e) Predicted allelic effects on profile shape (Jensen Shannon Distance (JSD)) for the significant African LCL caQTLs from ChromBPNet models trained on ATAC-seq data from reference LCLs from different ancestry groups/subgroups (each row/column in the matrix) are highly correlated. (f) Correlation of observed allelic imbalance (signed and unsigned) of ATAC-seq coverage (log fold changes) at heteroyzgous variants in the African caQTL LCL cohort with predicted effect sizes (logFC and JSD) from ChromBPNet models trained on GM12878 ATAC-seq (at two read depths) or DNase-seq. (g) Correlation of observed effect sizes (regression betas) of significant caQTLs in microglia with various predicted effect sizes (logFC and JSD) from a ChromBPNet model trained on a reference microglia scATAC-seq pseudobulk dataset (h) Correlation of the observed effect sizes (effect sizes from the RASQUAL method) of significant caQTLs in coronary artery smooth muscle cell-lines with various predicted effect sizes (logFC and JSD) from a ChromBPNet model trained on a reference caSMC scATAC-seq pseudobulk dataset.
Extended Figure 10:
Extended Figure 10:. Additional evidence for benchmarks of ChromBPNet’s variant effect prediction performance against SPI1 binding QTLs, massively parallel reporter activity of cRE mutagenesis and fine mapped GWAS variants.
(a) Comparison of distribution of observed SPI1 bQTL effect sizes (left), predicted effect sizes from ChromBPNet model of GM12878 ATAC-seq data (middle) and GM12878 DNase-seq data (right) stratified by p-value of the bQTL association significance (y-axis). More significant bQTL associations show stronger effect sizes. (b) Comparison of variant classification performance (average precision (AP)) of ChromBPNet and Enformer trained on GM12878 DNase-seq or ATAC-seq data at discriminating significant SPI1 bQTLs in LCLs at varying bQTL significance thresholds (x-axis) versus control variants. (c) Comparison of correlation between observed effect sizes (signed and unsigned) of significant bQTLs from LCLs selected at varying thresholds (x-axis) and predicted effect sizes (top: allelic log fold change of total counts, bottom: JSD between allelic profiles) of ChromBPNet and Enformer models trained on GM12878 DNase-seq or ATAC-seq data. (d) Comparison of the observed MPRA effects (x-axis) against the predicted effects from Enformer (top plot) or ChromBPNet (bottom plot) for all mutants of the IRF4 and SORT1 cREs. (e) Benchmark testing overlap enrichment (y-axis) of fine mapped variants from GWAS loci associated with red blood cell traits that pass various posterior probability (PIP) thresholds (x-axis) with variants predicted to have strong effects (at various thresholds) by ChromBPNet model trained on K562 DNase-seq data. Each curve corresponds to a different ChromBPNet effect size threshold (the right panel shows the threshold scores and the number of variants that pass each threshold). Enrichments increase with increasing PIP and more stringent ChromBPNet thresholds.
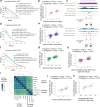
Figure 1:
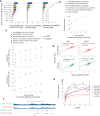
Figure 1:. Convolutional neural networks accurately predict base-resolution ATAC-seq profiles from local DNA sequence context but are confounded by Tn5 sequence bias.
(a) Schematic of the expanded BPNet architecture that maps 2114 bp of input sequence to 1 Kb base-resolution DNase-seq or ATAC-seq cleave profiles as two complementary outputs - a count head capturing the total coverage (log scale) and a profile head that captures the base-resolution multinomial probability distribution of reads (b) Exemplar locus on chr11 (held-out test chromosome) showing observed (Obs) ATAC-seq profiles, BPNet predicted (Pred) profiles at multiple resolutions and DeepLIFT sequence contribution scores to count and profile shape predictions. High count contribution scores highlight TF motif instances, whereas high profile contributions also capture spurious features that resemble Tn5 sequence preference. (c) Measured and predicted log(total counts) from K562 ATAC-seq peaks in held-out chromosomes exhibit high and statistically significant correlation. (d) Distribution of Jensen-Shannon Distance (JSD) between measured and predicted base-resolution K562 ATAC-seq profiles from peak regions in held-out chromosomes (blue) partially overlaps with distribution of concordance of pseudo-replicate profiles (red) which acts an upper bound, and is substantially better that baseline concordance between observed profiles and the average profile over all peaks (green) and between observed profiled and scrambled versions of the observed profiles (grey). (e) Top 15 TF-MODISCO contribution weight matrix (CMW) motifs derived from count contribution scores of the K562 ATAC-seq BPNet model map to well known TF motifs. (f) TF-MODISCO CWM motifs derived from profile contribution scores map to Tn5 bias motifs and distorted TF motifs. (g) Comparison of the frequency of high-confidence predictive instances (seqlets) of each TF-MODISCO motif identified from the count and profile heads show that Tn5 bias motifs dominate the profile contribution scores over TF motifs.
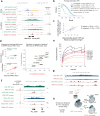
Figure 2:
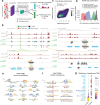
Figure 2:. Bias-factorized ChromBPNet models of ATAC-seq profiles coupled to neural network models of Tn5 bias deconvolve Tn5 bias from regulatory TF motif syntax.
(a) Schematic of BPNet models used to learn Tn5 bias from ATAC-seq profiles from background chromatin that excludes ATAC-seq peaks. (b) Exemplar locus at chr20:3,753,160–3,753,300 showing several tracks from top to bottom: observed GM12878 ATAC-seq profile; uncorrected predicted profile from ChromBPNet; uncorrected profile contribution scores from ChromBPNet shows spurious Tn5 bias; predicted Tn5 bias profiles from BPNet bias model shows strong resemblance to observed and uncorrected profiles; profile contribution scores from bias model match spurious Tn5 bias features; bias-corrected predicted profile from ChromBPNet shows a strong, denoised latent footprint; bias-corrected profile contribution scores from ChromBPNet are devoid of spurious Tn5 bias highlighting CTCF and ZBTB7A motifs; predicted profiles from ChromBPNet model using HINT-ATAC’s bias correction method; profile contribution scores from HINT-ATAC ChromBPNet model show spurious Tn5 bias; predicted profiles from ChromBPNet model using TOBIAS’s bias correction method; profile contribution scores from TOBIAS ChromBPNet model shows spurious Tn5 bias; predicted profiles from ChromBPNet model that uses a simplified 1-filter CNN bias model; profile contribution scores from ChromBPNet model with 1-filter CNN bias model shows spurious Tn5 bias. (c) TF-MODISCO motifs derived from profile contribution scores of the BPNet bias model trained on chromatin background capture different variations of the canonical Tn5 sequence preference motif. (d) Schematic of the bias-factorized architecture of ChromBPNet consisting of a pre-trained bias model and residual TF sub-model with trainable parameters. (e) Relative frequency of high-confidence predictive instances (seqlets) of TF-MODISCO motifs derived from profile contribution scores of various ChromBPNet models trained on GM12878 ATAC-seq data using different bias models (no bias model, TOBIAS bias model, 1-filter CNN bias model and BPNet bias model) or pre-corrected profiles (HINT-ATAC) shows that Tn5 bias motifs dominate all but the ChromBPNet model coupled with the BPNet bias model. (f) Marginal footprints of various TF-MODISCO Tn5 bias motifs (rows) using predicted profiles from GM12878 ATAC-seq ChromBPNet models using different bias models or pre-corrected profiles (cols) show that only the BPNet bias model enables near optimal correction of Tn5 bias. (g) Marginal footprints of various predictive TF motifs (rows) using predicted profiles from GM12878 ATAC-seq ChromBPNet models that use different bias models or pre-corrected profiles (cols) show that only the BPNet bias model removes confounding Tn5 bias.
Figure 3:
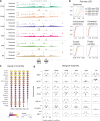
Figure 3:. ChromBPNet’s bias correction improves concordance between ATAC-seq and DNase-seq experiments.
(a) Exemplar locus at chr1:27,122,675–27,122,980 showing several tracks from top to bottom: observed K562 ATAC-seq profile; uncorrected predicted ATAC-seq profile from ATAC-seq ChromBPNet; bias-corrected predicted ATAC-seq profile; bias-corrected count and profile contribution scores from ATAC-seq ChromBPNet highlighting AP1 and SP1 motifs (on right zoomed in panel); observed K562 DNase-seq profile shows poor similarity to observed ATAC-seq profile; uncorrected predicted DNase-seq profile from DNase-seq ChromBPNet; bias-corrected predicted DNase-seq profile from DNase-seq ChromBPNet is more similar to bias-corrected ATAC-seq profile but shows narrower footprints; bias-corrected count and profile contribution scores from DNase-seq ChromBPNet highlighting AP1 and SP1 motifs that are highly concordant with contribution scores derived from ATAC-seq ChromBPNet; (b) Distribution of discordance (measured using JSD) between pairs of observed K562 DNase-seq and ATAC-seq profiles over peak regions, and predicted (uncorrected and bias-corrected) ATAC-seq and DNase-seq profiles. (c) Distribution of discordance (JSD) between pairs of different types of contribution score profiles from ATAC-seq and DNase-seq ChromBPNet models over peak regions. From top to bottom: count contribution scores from uncorrected ChromBPNet; count contribution scores from bias-corrected ChromBPNet; profile contribution scores from uncorrected ChromBPNet; profile contribution scores from bias-corrected ChromBPNet. Bias-correction significantly improves concordance of corrected profile contribution scores. (d) Relative frequency of high-confidence predictive motif instances (seqlets) of TF-MODISCO motifs derived from bias-corrected profile contribution scores derived from K562 ATAC-seq and DNase-seq ChromBPNet models show high similarity. (e) Comparison of marginal footprints at TF-MODISCO motifs derived from uncorrected and bias-corrected normalized probability profiles from K562 ATAC-seq (top) and DNase-seq (bottom) ChromBPNet models (y-axis scales are the same for top and bottom panels of each column). (f) Schematic showing definition of height and width of marginal footprints. (g) Distribution of widths of bias-corrected marginal footprints at TF-MODISCO motifs from ATAC-seq and DNase-seq ChromBPNet models shows that DNase-seq produces narrower footprints. (h) In contrast, the heights of the bias-corrected marginal footprints from DNase-seq and ATAC-seq models are highly correlated across TF motifs.
Figure 4:
Figure 4:. ChromBPNet can impute base-resolution profiles, TF footprints and predictive sequence motifs from low coverage ATAC-seq and DNase-seq datasets.
(a) Exemplar locus on chr1 (held-out test chromosome) showing observed (Obs) GM12878 ATAC-seq profiles deteriorating with progressively subsampled datasets (250M, 100M, 50M, 25M, and 5M total reads). However, bias-corrected predicted profiles and contribution scores from GM12878 ATAC-seq ChromBPNet models trained on datasets of all read depths are highly concordant. (b) Distribution of discordance (JSD) between pairs (maximal read depth vs. progressively subsampled data) of various types of profiles over peak regions. Observed ATAC-seq profiles (which exhibit increasing discordance with reducing read depth). In contrast, uncorrected and bias-corrected predicted profiles, bias-corrected count and profile contribution scores exhibit very similar distributions as low as 25M. Some deterioration is only visible at 5M reads. (c) Comparison of recall of predictive instances of top ranking TF-MODISCO motifs in profile contribution scores from the GM12878 ChromBPNet models trained on various subsampled datasets, using the instances identified at 572M reads (full read-depth) as ground truth. Motif recall is high and consistent across most read depths. Rare motifs are lost at low read depths (5M reads). (d) Comparison of marginal footprints at representative TF-MODISCO motifs from ChromBPNet models trained on GM12878 ATAC-seq data at different subsampled read-depths.
Figure 5:
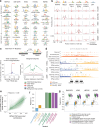
Figure 5:. ChromBPNet models of ATAC-seq data reveals compact TF motif lexicons, cooperative composite elements and predictive motif instances that influence chromatin accessibility and TF occupancy.
(a) Top 10 TF-MODISCO motifs (ranked by number of predictive motif instances) derived from count contribution scores from ATAC-seq ChromBPNet models of diverse cell-lines. (b) Marginal footprints of TF-MODISCO motifs using normalized uncorrected (red) and bias-corrected profile predictions (black) from ATAC-seq ChromBPNet models of diverse cell-lines. Bias-correction reveals cell-type specificity of footprints. (c) TF-MODISCO applied to the IMR90 ATAC-seq ChromBPNet model reveals a FOS-TEAD composite heterodimer motif (top). Strength (maximum) of marginal footprints of paired FOS and TEAD motifs with variable spacing shows strong cooperative effects only at the fixed 6 bp spacing (bottom-left). Marginal footprints of the FOS motif, TEAD motif, FOS-TEAD composite motif and the sum of FOS and TEAD marginal footprints demonstrates the super-additive cooperative effect of the FOS-TEAD composite (bottom-right). (d) Exemplar accessible region in chr19 near the LDLR gene in HEPG2 displaying the observed profile from ATAC-seq and FOXA2, FOSL2 and CEPBP ChIP-seq data, alongside uncorrected and bias corrected predicted profiles, and count contribution scores from ATAC-seq ChromBPNet model and TF ChIP-seq BPNet models. Predictive motif instances from ChromBPNet and BPNet models are in strong agreement. (e) Count contribution scores derived from HepG2 ATAC-seq ChromBPNet model and CTCF TF ChIP-seq BPNet model are highly correlated at CTCF motif matches in CTCF peaks overlapping ATAC-seq peaks in HepG2. (f) Comparison of correlation of CTCF ChIP-seq BPNet model count contribution scores at CTCF motif matches with various types of motif activity scores derived from ATAC-seq data in HEPG2. Count and profile contribution scores from ATAC-seq and DNase-seq ChromBPNet models substantially outperform observed peak-level ATAC-seq and DNase-seq counts and TOBIAS footprint scores. (g) Similar comparisons as in (f) over motif instances of various TF-MODISCO motifs derived from ChromBPNet models of different cell-lines show that motif contribution scores from ATAC-seq and DNase-seq ChromBPNet models show much stronger correlations with motif contribution scores from matched TF ChIP-seq BPNet models compared to the alternative measures (observed peak-level ATAC-seq and DNase-seq counts and TOBIAS footprint scores) of motif activity.
Figure 6:
Figure 6:. ChromBPNet predicts effects of genetic variants on chromatin accessibility across assays, ancestry groups, cell-lines and primary cells.
(a) Comparison of variant classification performance (Precision-recall curves and average precision (AP)) of different models (gkmSVM, ChromBPNet and Enformer) trained on GM12878 DNase-seq or ATAC-seq at discriminating significant DNase-seq QTLs (dsQTLs) in Yoruban lymphoblastoid cell-lines (LCLs) from controls variants. ChromBPNet is highly competitive with Enformer and substantially outperforms gkmSVM. (b) The observed effect sizes (x-axis, regression betas) of significant dsQTLs are significantly correlated with GM12878 ATAC-seq ChromBPNet’s predicted effect sizes (y-axis, log fold changes). (c) Example locus around dsQTL SNP rs11242436. Tracks displayed include bias-corrected predicted profiles from ChromBPNet models trained on GM12878 ATAC-seq and DNase-seq data and predicted profiles from Enformer’s GM12878 DNase-seq head for both alleles. Also shown are ChromBPNet’s contribution scores for both alleles illustrating the disruption of an AP1 motif by the variant and a cooperative effect on another adjacent AP1 motif. (d) Comparison of variant classification performance of ChromBPNet and Enformer trained on GM12878 DNase-seq or ATAC-seq data at discriminating significant ATAC-seq QTLs (caQTLs) in European LCLs from control variants. (e) The observed effect sizes (x-axis, regression betas) of significant European LCL caQTLs are significantly correlated with GM12878 ATAC-seq ChromBPNet’s predicted effect sizes (y-axis, log fold changes). (f) Comparison of variant classification performance of ChromBPNet and Enformer trained on GM12878 DNase-seq or ATAC-seq data at discriminating significant ATAC-seq QTLs (caQTLs) in African LCLs from control variants. (g) The observed effect sizes (x-axis, regression betas) of significant African LCL caQTLs are significantly correlated with GM12878 ATAC-seq ChromBPNet’s predicted effect sizes (y-axis, log fold changes). (h) The observed allelic imbalance of ATAC-seq coverage (x-axis, log fold changes) at heteroyzgous variants in the African caQTL LCL cohort is significantly correlated with GM12878 ATAC-seq ChromBPNet’s predicted effect sizes (y-axis, log fold changes). (i) Predicted effect sizes (log fold changes) for the significant African LCL caQTLs from ChromBPNet models trained on ATAC-seq data from reference LCLs from different ancestry groups/subgroups (each row/column in the matrix) are highly correlated. (j) The observed effect sizes (x-axis, regression betas) of significant caQTLs in microglia are significantly correlated with predicted effect sizes from a ChromBPNet model trained on a reference microglia scATAC-seq pseudobulk dataset (y-axis, log fold changes). (k) The observed effect sizes (x-axis, effect sizes from the RASQUAL method) of significant caQTLs in coronary artery smooth muscle cell-lines are significantly correlated with predicted effect sizes from a ChromBPNet model trained on a reference caSMC scATAC-seq pseudobulk dataset (y-axis, log fold changes).
Figure 7:
Figure 7:. ChromBPNet predicts effects of genetic variants influencing pioneer TF occupancy, massively parallel reporter activity of cRE mutagenesis, complex traits and rare disease.
(a) Example locus around SNP rs5764238, which is a significant SPI1 binding QTL (bQTL) in LCLs. Predicted profiles and contribution scores from various models are shown. From top to bottom: SPI1 BPNet ChIP-seq model in GM12878, GM12878 ATAC-seq ChromBPNet and GM12878 DNase-seq ChromBPNet. Contributions consistently illustrate the creation of a strong SPI1 motif by the G allele, with a neighboring weak SPI1 motif driving weak accessibility for the C allele. (b) Comparison of variant classification performance (Precision-recall curves and average precision (AP)) of different models (ChromBPNet and Enformer) trained on GM12878 DNase-seq or ATAC-seq at discriminating SPI1 bQTLs in LCLs from controls variants shows that ChromBPNet is competitive with Enformer. (c) The observed effect sizes (x-axis, allele specific ChIP frequencies) of significant SPI1 bQTLs are significantly correlated with GM12878 ATAC-seq ChromBPNet’s predicted effect sizes (y-axis, log fold changes). (d) Benchmark against massively parallel reporter assays (MPRAs) that measure effects of saturated mutagenesis of various cREs (enhancers and promoters) in various cell-lines. The cREs are named based on the nearest gene locus. For each cRE mutagenesis experiment, Pearson correlation is computed between the measured MPRA effect and the predicted effect from DNase-seq ChromBPNet models trained in the closest matched cell-line, over all mutants. Pearson correlation was also estimated using predicted effects from Enformer DNase-seq heads in the closest matched cell-lines. The scatter plot on the right compares the Pearson correlations of ChromBPNet (x-axis) to the Pearson correlations of Enformer (y-axis) for all cREs. Grey lines flanking the diagonal represent +/− 0.5 from the diagonal. ChromBPNet outperforms Enformer at several cREs (marked in bold, IRF4, SORT1, HNF4A, MSMB, HBG1). The scatter plots on the left compare the observed MPRA effects (x-axis) against the predicted effects from Enformer (top plot) or ChromBPNet (bottom plot) for all mutants of the HBG1 cRE. (e) Benchmark testing overlap enrichment (y-axis) of fine mapped variants from GWAS loci associated with red blood cell traits that pass various posterior probability (PIP) thresholds (x-axis) with variants predicted to have strong effects (at various thresholds) by ChromBPNet model trained on K562 ATAC-seq data. Each curve corresponds to a different ChromBPNet effect size threshold (the right panel shows the threshold scores and the number of variants that pass each threshold). Enrichments increase with increasing PIP and more stringent ChromBPNet thresholds. (f) Example locus around SNP rs11553699, which is a high-PIP fine mapped variant in a GWAS locus associated with the Mean Corpuscular Volume (MCV) read blood cell trait. Bias-corrected predicted profiles and contribution scores for each allele from GM12878 ATAC-seq and DNase-seq ChromBPNet model show that the G allele disrupts a GATA motif. (g) Example locus around variant hs2599, which is a de novo variant from a patient with severe, undiagnosed neurodevelopmental disorder (NDD). Bias-corrected predicted profiles and contribution scores are shown for both alleles from a ChromBPNet model trained on scATAC-seq pseudobulk data from glutamatergic neuron cell-type from human fetal brain tissue. The G allele is predicted to reduce accessibility due to the creation of a repressive NR2F1 motif with strong negative contribution scores. (h) Transgenic mouse reporter assay in the E11.5 developmental stage to test the de novo NDD variant shows mice with the activating A allele showing strong enhancer activity in various brain regions, consistent with our model’s predictions in (g). In contrast, mice with the alternate G allele showed significantly reduced enhancer activity, in the forebrain (fb), hindbrain (hb), eyes and midbrain (mb).

References

    1. Lee B.-K. et al. Cell-type specific and combinatorial usage of diverse transcription factors revealed by genome-wide binding studies in multiple human cells. Genome Res 22, 9–24 (2012). - PMC - PubMed
    1. Wasserman W. W. & Sandelin A. Applied bioinformatics for the identification of regulatory elements. Nat. Rev. Genet. 5, 276–287 (2004). - PubMed
    1. Morgunova E. & Taipale J. Structural perspective of cooperative transcription factor binding. Curr Opin Struct Biol 47, 1–8 (2017). - PubMed
    1. Lai W. K. M. & Pugh B. F. Understanding nucleosome dynamics and their links to gene expression and DNA replication. Nat Rev Mol Cell Biol 18, 548–562 (2017). - PMC - PubMed
    1. Isbel L., Grand R. S. & Schübeler D. Generating specificity in genome regulation through transcription factor sensitivity to chromatin. Nat. Rev. Genet. 23, 728–740 (2022). - PubMed

Publication types

LinkOut - more resources