[Preprint]. 2025 Aug 14:2024.11.01.621152.
doi: 10.1101/2024.11.01.621152.

Single-cell profiling of trabecular meshwork identifies mitochondrial dysfunction in a glaucoma model that is protected by vitamin B3 treatment

Affiliations

Single-cell profiling of trabecular meshwork identifies mitochondrial dysfunction in a glaucoma model that is protected by vitamin B3 treatment

Nicholas Tolman et al. bioRxiv. .

Abstract

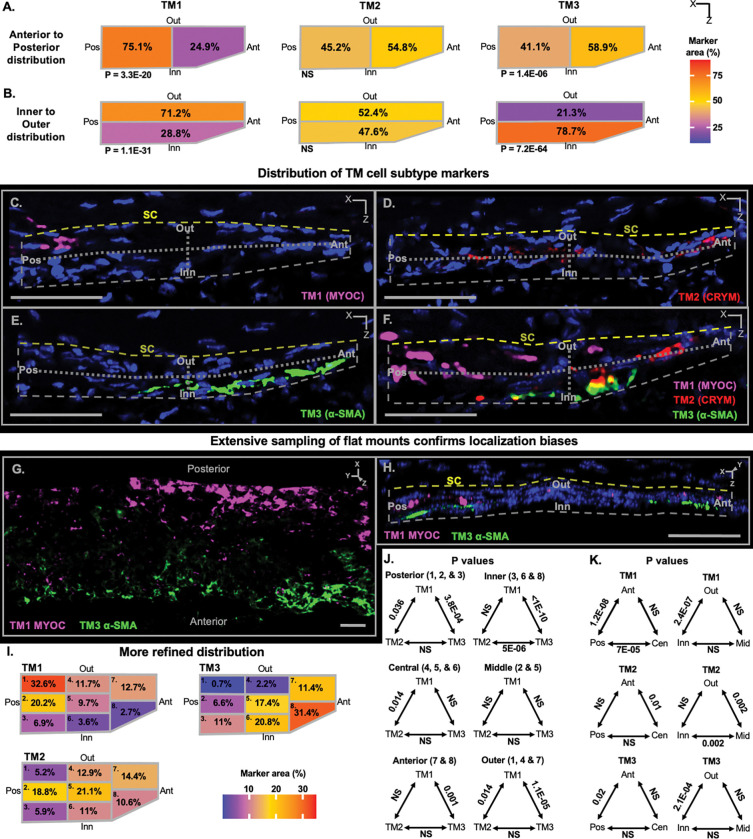
Since the trabecular meshwork (TM) is central to intraocular pressure (IOP) regulation and glaucoma, a deeper understanding of its genomic landscape is needed. We present a multimodal, single-cell resolution analysis of mouse limbal cells (includes TM). In total, we sequenced 9,394 wild-type TM cell transcriptomes. We discovered three TM cell subtypes with characteristic signature genes validated by immunofluorescence on tissue sections and whole-mounts. The subtypes are robust, being detected in datasets for two diverse mouse strains and in independent data from two institutions. Results show compartmentalized enrichment of critical pathways in specific TM cell subtypes. Distinctive signatures include increased expression of genes responsible for 1) extracellular matrix structure and metabolism (TM1 subtype), 2) secreted ligand signaling to support Schlemm's canal cells (TM2), and 3) contractile and mitochondrial/metabolic activity (TM3). ATAC-sequencing data identified active transcription factors in TM cells, including LMX1B. Mutations in LMX1B cause high IOP and glaucoma. LMX1B is emerging as a key transcription factor for normal mitochondrial function and its expression is much higher in TM3 cells than other limbal cells. To understand the role of LMX1B in TM function and glaucoma, we single-cell sequenced limbal cells from Lmx1b V265D/+ mutant mice (2,491 TM cells). In V265D/+ mice, TM3 cells were uniquely affected by pronounced mitochondrial pathway changes. Mitochondria in TM cells of V265D/+ mice are swollen with a reduced cristae area, further supporting a role for mitochondrial dysfunction in the initiation of IOP elevation in these mice. Importantly, treatment with vitamin B3 (nicotinamide), to enhance mitochondrial function and metabolic resilience, significantly protected Lmx1b mutant mice from IOP elevation.


Figures

Fig 1.
Fig 1.. scRNA-seq data identifies three TM cell clusters.
(A) Cells from limbal tissue dissected and sequenced at Columbia University (integrated B6 and 129/Sj datasets) are depicted in clusters on a UMAP space. (B) A separate UMAP representation of the trabecular meshwork (TM) containing cluster following subclustering. Three distinct TM cell clusters are identified (TM1, TM2, and TM3). (C) Dendrogram illustrating the relationships among these subclusters. TM1 and TM2 are more similar to each other than to TM3. (D) Heatmap showing the signature genes for TM1, TM2, and TM3 cells. The scaled RNA expression indicates how many standard deviations a given gene’s expression is from the average expression across all examined cells (positive value is greater than the expression average and negative values are lower than expression average). (E) The scaled expression of select marker genes that robustly differentiate TM cell subsets from each other are shown with a dot plot. CE: corneal endothelium, CM: ciliary muscle, IS: iris stroma, Kera: corneal keratocytes, Scl: scleral.
Fig 2.
Fig 2.. Biased localization of TM cell subtypes within the TM.
(A-B) Summary diagrams showing the location of expression of TM1, TM2, and TM3 signature markers in the TM. For quantification of marker distributions, the TM was divided in half along both anterior-posterior (A) and inner-outer (B) axes (see Figure S7 localization of TM and SC). The area of the TM that was positive for each marker within each region was calculated as a percentage of the total area occupied by that marker in the entire TM on each section. The percentage of marker localization to each region was averaged across all analyzed sections. The average localization across all markers used for each TM cell subtype (see S8 and S9 Figs) is shown on the diagrammatic representations of the TM using heatmaps. TM1 localization is biased towards the posterior and outer TM, whereas TM3 is biased towards the anterior and inner TM. No clear bias for TM2 was observed. A total of 286 sections were examined using immunofluorescence (IF) and in situ hybridization (ISH). Between 130–160 sections were examined for each TM cell subtype. (C-F) Representative sections for a subset of markers for each subtype used for quantification. See Figure S6 for explanation of indicated tissue orientations. (G) En face image of the TM in a 3D reconstruction of a tissue whole mount, clearly demonstrating the anterior vs posterior localization bias for TM1 (posterior bias) and TM3 (anterior bias) cell types. (H) Orthogonal 3D image that is cropped and oriented in the same planes as the tissue sections. The inner bias for α-SMA (Acta2, TM3) compared to an outer bias for MYOC (TM1) is evident. (I) More spatially refined analyses were subsequently conducted using extremely high-quality sections (50–60 per marker) by dividing the TM into 8 smaller zones (S7 Fig). In this more refined study, TM2 cells have a biased localization to a posterior and central region of TM (most enriched in zones 2 and 5, see Figure S7). (J-K) The TM subtype distributions were statistically compared across the combined zones (in parentheses) as indicated. ANOVA followed by Tukey’s honestly significant difference test. Ant: anterior TM, Pos: posterior TM, Inn: inner TM, Out: outer TM, SC: Schlemm’s canal. Grey dotted lines mark the TM zones, yellow dotted lines mark inner wall of Schlemm’s canal. All scale bars: 50 μm.
Fig 3.
Fig 3.. Pathway analysis suggests differential involvement of TM cell subtypes in extracellular matrix regulation, growth factor signaling, and actin-binding
(A-B) Molecular comparison of all three TM cell subtypes to all other sequenced cells using gene ontology (GO) of differentially expressed genes (DEGs). The top five most significant pathways as well as three additional pathways of interest are shown for each indicated comparison (adjusted P values, X-axis was cutoff at P < 1E-10). GSEA analysis was also used to assess the enrichment or underrepresentation of these GO pathways with GSEA scores color coded on the GO charts above. Pathways significantly different by GSEA analysis are indicated by asterisks. Overall, TM cells have over-representation of various extracellular matrix (ECM) molecules/ pathways including collagens, glycosaminoglycans, and integrins compared to non-TM cells. Growth factor signaling is also enriched in TM cells compared to other cell types. (C-D) When comparing TM cell subtypes, TM1 cells are further enriched for ECM molecules such as collagens, glycosaminoglycans, and integrins as well as TGF-β signaling. (E-F) TM2-enriched ECM pathways include glycosaminoglycan binding and the laminin complex. TM2 cells are also enriched for receptor-ligand signaling and insulin growth factor binding. (G-H) Actin-binding and mitochondrial metabolism genes are enriched in TM3 cells. ECM = extracellular matrix. ECS = extracellular structure. ER = endoplasmic reticulum. IMM = inner mitochondrial membrane.
Fig 4.
Fig 4.. Signaling interactions directed from TM cells to Schlemm’s canal and vascular endothelial cells differ across TM subtypes.
(A) Circos plot showing the top predicted interactions between TM cell ligands and Schlemm’s canal endothelial (SEC) target molecules. The top predicted targets in all TM cells are split by their expression across subtypes. TM1 and TM2 participate in more predicted signaling events compared to TM3. TM1-biased ligands include members of the Tgf-β and fibronectin signaling families. Various endothelial trophic factors are predominantly expressed in TM2 including endothelin 3, vascular endothelial growth factor A, and angiopoietin 1. See Table S4 for comprehensive list of ligand-target interaction data. (B-C) TM cell ligands that signal to collector channel (CC) endothelial cells (B) or blood endothelial cells (BECs, C). (D) The expression of all ligands predicted to have signaling interactions with SECs, CCs, or BECs, are displayed across TM cell subtypes (Dot plot).
Fig 5.
Fig 5.. Transcription factors dictating gene expression in TM cells
(A) A schematic representation of the pipeline used to identify open chromatin sites and active transcription factors (TFs). Individual cells were profiled using both single nucleus (sn) RNA and ATAC sequencing (multiome). TM cell clusters were identified using the snRNA-seq data, while significantly open chromatin regions were identified using the snATAC-seq data. Active TFs were determined based on the odds ratio of TF binding motifs within these open chromatin regions. Schematic created with BioRender.com (B) UMAP of subclusters derived from TM cell containing cluster (cluster 1) in the snRNA-seq data. (C-E) Example ATAC tracts for the promotor regions of selected marker genes for TM1 (C), TM2 (D), and TM3 (E). Each of these marker genes has greater promoter accessibility in the TM cell subtype in which its RNA expression is enriched (orange box). The aligned marker gene positions are shown. Coverage = normalized ATAC signal reads in transcription start site. CS = coverage scale. (F) Correlations between RNA expression levels (snRNA-seq dataset) of each TF and the chromatin accessibility levels (snATAC-seq dataset) of their respective predicted target binding motifs across all TM cell subtypes (see Methods). Select TFs with strong positive (red) or negative correlations (blue) are named.
Fig 6.
Fig 6.. Differential molecular responses of TM cell subtypes to an Lmx1b mutation
(A) UMAPs of limbal cells from WT and Lmx1bV265D/+ (V265D) mutant mice (both genotypes B6 background). (B) Lmx1b expression across limbal cell types. Lmx1b expression is highest in TM3 cells. (C) Pathways that are changed in all TM cell subtypes. (D-F) Top pathways that are significantly altered when comparing each indicated TM cell subtype across genotypes. Many of these pathways were not significantly changed when comparing all TM cell subtypes as a group, indicating that the V265D-induced changes are strongest within each TM cell subtype. V265D has a pronounced effect on mitochondrial pathways in TM3 cells but much less so in other TM cells. ECM = extracellular matrix. ECS = extracellular structure. (G) Mitochondria in V265D mutant TM cells are reduced in number per cell, have increased area, and decreased cristae area (cristae fraction is ratio of area occupied by cristae: total area of mitochondria; shown as bar plots with standard error). A total of 160–180 mitochondria were analyzed across 3 eyes per genotype (approximately 60 mitochondria per eye). Groups were compared using Student’s t-test. (H) Representative images show mitochondria defined by their outer membranes (OM) and inner membrane folds (cristae). Asterisks indicate a subset of representative cristae for each genotype. Mutant mitochondria exhibit increased area (space enclosed by the OM) and disorganized cristae structure. Arrows highlight regions in mutant mitochondria that lack cristae. Scale bar = 500 nm.
Figure 7:
Figure 7:. Nicotinamide treatment protects from IOP elevation in Lmx1b mutants.
(A) Representative photos of eyes from mice of the indicated genotypes and treatments (UNT = untreated, NAM = nicotinamide treated, 550mg/kg/day provided in drinking water). NAM treatment substantially lessens anterior chamber deepening (ACD), a sensitive indicator of IOP elevation in mice. The WT and NAM-treated mutant eyes have very shallow anterior chambers while the untreated mutant eye has an obviously deepened chamber (arrowheads). (B) Distributions of anterior chamber depth based on previously defined scoring system [40]. Groups compared by Fisher’s exact test. (C-D) Boxplots of IOP (interquartile range and median line) in WT and mutant eyes of both NAM treated and untreated groups. NAM treatment significantly lessens IOP elevation in mutants compared to untreated mutant controls. Groups compared by ANOVA followed by Tukey’s honestly significant difference (see Table S7 for additional statistics). n ≥ 35 eyes examined in each WT group and n ≥ 40 in V265D mutant groups. Geno = genotype.

References

    1. Quigley HA, Broman AT. The number of people with glaucoma worldwide in 2010 and 2020. Br J Ophthalmol. 2006;90(3):262–7. Epub 2006/02/21. doi: 10.1136/bjo.2005.081224. - DOI - PMC - PubMed
    1. Stamer WD, Clark AF. The many faces of the trabecular meshwork cell. Exp Eye Res. 2017;158:112–23. Epub 2016/07/23. doi: 10.1016/j.exer.2016.07.009. - DOI - PMC - PubMed
    1. Keller KE, Peters DM. Pathogenesis of glaucoma: Extracellular matrix dysfunction in the trabecular meshwork-A review. Clin Exp Ophthalmol. 2022;50(2):163–82. Epub 2022/01/18. doi: 10.1111/ceo.14027. - DOI - PMC - PubMed
    1. Buffault J, Labbe A, Hamard P, Brignole-Baudouin F, Baudouin C. The trabecular meshwork: Structure, function and clinical implications. A review of the literature. J Fr Ophtalmol. 2020;43(7):e217–e30. Epub 2020/06/21. doi: 10.1016/j.jfo.2020.05.002. - DOI - PubMed
    1. Acott TS, Kelley MJ. Extracellular matrix in the trabecular meshwork. Exp Eye Res. 2008;86(4):543–61. Epub 2008/03/04. doi: 10.1016/j.exer.2008.01.013. - DOI - PMC - PubMed

Publication types

LinkOut - more resources