[Preprint]. 2025 Apr 16:2025.01.07.631779.
doi: 10.1101/2025.01.07.631779.

Regionalized regulation of actomyosin organization influences cardiomyocyte cell shape changes during chamber curvature formation

Affiliations

Regionalized regulation of actomyosin organization influences cardiomyocyte cell shape changes during chamber curvature formation

Dena M Leerberg et al. bioRxiv. .

Abstract

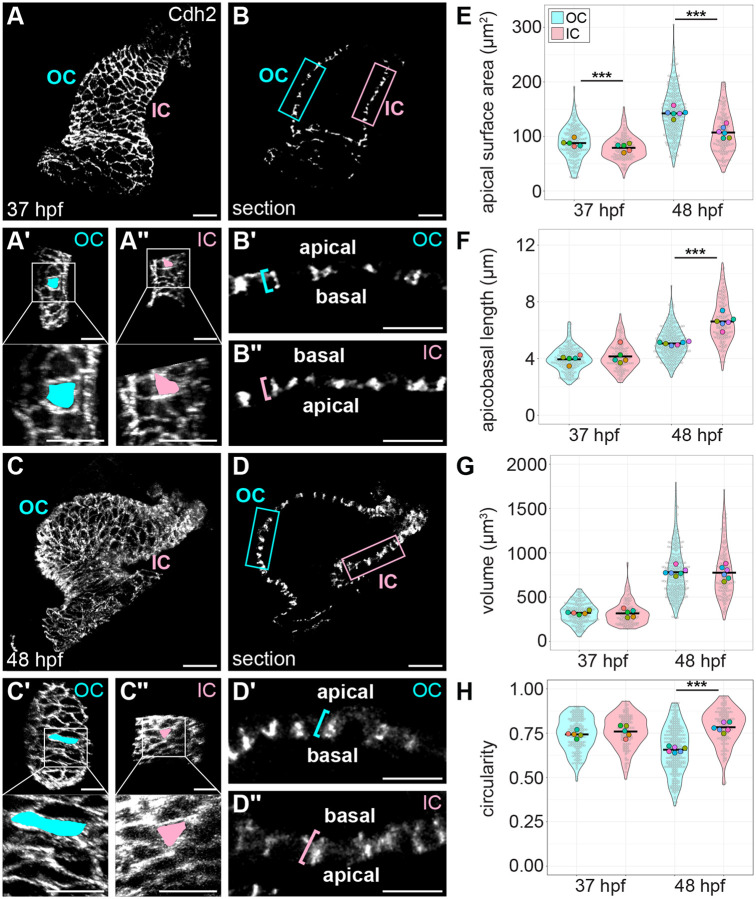
Cardiac chambers emerge from a heart tube that balloons and bends to create expanded ventricular and atrial structures, each containing a convex outer curvature (OC) and a recessed inner curvature (IC). The cellular and molecular mechanisms underlying the formation of these characteristic curvatures remain poorly understood. Here, we demonstrate in zebrafish that the initially similar populations of OC and IC ventricular cardiomyocytes diverge in the organization of their actomyosin cytoskeleton and subsequently acquire distinct OC and IC cell shapes. Altering actomyosin dynamics hinders cell shape changes in the OC, and mosaic analyses indicate that actomyosin regulates cardiomyocyte shape in a cell-autonomous manner. Additionally, both biomechanical cues and the transcription factor Tbx5a influence the basal enrichment of actomyosin and squamous cell morphologies in the OC. Together, our findings demonstrate that intrinsic and extrinsic factors intersect to control actomyosin organization in OC cardiomyocytes, which in turn promotes the cell shape changes that accompany curvature morphogenesis.


Conflict of interest statement

Competing interests Authors declare that they have no competing interests.

Figures

Figure 1.
Figure 1.. OC and IC cardiomyocyte morphologies diverge during curvature formation.
(A and C) 3D reconstructions of 37 hpf (A) and 48 hpf (C) wild-type hearts. Immunostaining for Cdh2 labels lateral membranes of cardiomyocytes (see Figure 1—figure supplement 2 and Materials and Methods for more detail regarding use of Cdh2). OC (A′ and C′) and IC (A″ and C″) are shown for hearts in (A) and (C), respectively. Insets show higher magnification. Apical surface area of an individual cardiomyocyte is illustrated by blue or pink fill. (B and D) Sections through hearts in (A and C). (B′, B″, D′, and D″) are magnified views of blue (OC) and pink (IC) boxed regions in (B and D); blue and pink brackets highlight apicobasal length of individual cardiomyocytes. (E-H) Violin plots compare apical surface area, apicobasal length, volume, or circularity of OC and IC cardiomyocytes at 37 and 48 hpf. Each small grey dot represents an individual cell, each black bar represents the mean of values from individual cells, and each large colored dot represents the mean of all values from an individual embryo. Volume is calculated as LxWxH; circularity is calculated as 4⫪(A/P2). *** denotes p < 0.001, Wilcoxon test. Significance only shown for OC/IC comparisons; all metrics are significantly different between developmental stages of the same region (i.e. 37 hpf OC vs 48 hpf OC, and 37 hpf IC vs 48 hpf IC). 37 hpf OC (N=5 embryos, n=183 cells); 37 hpf IC (N=5 embryos, n=127 cells); 48 hpf OC (N=6 embryos, n=281 cells); 48 hpf IC (N=6 embryos, n=143 cells). Scale bars = 30 μm (A, B, C, and D); 20 μm (A′, A″, C′, and C″); 15 μm (B′, B″, D′, and D″).
Figure 2.
Figure 2.. OC and IC cardiomyocytes exhibit differential localization of subcellular actomyosin during early curvature formation.
(A) Whole heart from a 36 hpf embryo carrying Tg(myl7:eGFP-Hsa.HRAS) (D’Amico et al., 2007), immunostained for membrane-bound GFP and pMyosin and stained with Phalloidin to label F-actin. Inset magnifies a single cardiomyocyte. (B) Visual representation of approach for measuring the percentages of F-actin or pMyosin at each membrane in individual cardiomyocytes. Briefly, each OC or IC cardiomyocyte was bisected in two axes, resulting in two cross-sections for each cell (X, purple; Y, orange). The cell boundaries in X and Y are visible due to eGFP localization to the membranes. In these images, the basal membrane is always at the bottom. (C and D) Cross-sections through representative individual cardiomyocytes from the OC (C) or IC (D). Empty arrowheads: apical membranes. Filled arrowheads: basal membranes. Arrows: lateral membranes. (E) Stacked bar charts showing the mean percentage of F-actin or pMyosin at each membrane. Refer to Tables S1 and S2 for summary statistics. * denotes p < 0.05 and *** denotes p < 0.001, Wilcoxon test. OC (N=10 embryos, n=199 cells); IC (N=10 embryos, n=123 cells). Scale bars = 50 μm (A); 2 μm (C and D).
Figure 3.
Figure 3.. Tissue-specific modulation of NMII activity dampens the divergence of OC and IC cardiomyocyte morphologies.
(A, C, and E) 3D reconstructions of 48 hpf hearts expressing Tg(myl7:WT-myl9-mScarlet) (A), Tg(myl7:DN-myl9-eGFP) (C), or Tg(myl7:CA-myl9-eGFP) (E). Immunostaining for Cdh2 labels lateral membranes of cardiomyocytes. OCs (A′, C′, and E′) and ICs (A″, C″, and E″) are shown for hearts in (A, C, and E). Insets show higher magnification. Apical surface area of an individual cardiomyocyte is illustrated by blue or pink fill. (B, D, and F) Sections through hearts in (A, C, and E). (B′, B″, D′, D″, F′, and F″) are magnified views of blue (OC) and pink (IC) boxed regions in (B, D, and F); blue and pink brackets highlight apicobasal length of individual cardiomyocytes. (G-I) Violin plots compare apical surface area, apicobasal length, or circularity of cardiomyocytes between embryos expressing the different transgenes, split by curvature. Circularity is calculated as 4⫪(A/P2). Each small grey dot represents an individual cell, each black bar represents the mean of values from individual cells, and each large colored dot represents the mean of all values from an individual embryo. * denotes p < 0.05, ** denotes p < 0.01, and *** denotes p < 0.001, Wilcoxon test. Tg(myl7:WT-myl9-mScarlet) OC (N=6 embryos, n=308 cells); Tg(myl7:WT-myl9-mScarlet) IC (N=6 embryos, n=159 cells); Tg(myl7:DN-myl9-eGFP) OC (N=6 embryos, n=298 cells); Tg(myl7:DN-myl9-eGFP) IC (N=6 embryos, n=143 cells); Tg(myl7:CA-myl9-eGFP) OC (N=6 embryos, n=253 cells); Tg(myl7:CA-myl9-eGFP) IC (N=6 embryos, n=123 cells). Scale bars = 20 μm.
Figure 4.
Figure 4.. Cell-intrinsic modulation of NMII activity alters cardiomyocyte shape.
(A) Schematic of blastomere transplantation experiment. (B and H) 3D reconstructions of 48 hpf wild-type (WT) host hearts containing donor-derived cardiomyocytes expressing Tg(myl7:CA-myl9-eGFP) (B) or Tg(myl7:DN-myl9-eGFP) (H); immunostaining for Alcama labels lateral membranes of cardiomyocytes. (B′ and H′) Sections through hearts in (B and H). OC (C and I) and IC (D and J) are shown from additional mosaic hearts other than those in (B and H). (C′, D′, I′, and J′) Tracings of the cardiomyocytes in (C, D, I, and J). Green outlines indicate donor-derived cardiomyocytes; black outlines indicate host-derived cardiomyocytes. (C″, D″, I″, and J″) Cross-sections through positions indicated by dotted lines in (C, D, I, and J). Blue and pink brackets highlight apicobasal length of individual cardiomyocytes, with dashed brackets for host-derived cardiomyocytes and solid brackets for donor-derived cardiomyocytes. (E-G and K-M) Violin plots compare apical surface area, apicobasal length, and circularity of host-derived cardiomyocytes to those of donor-derived cardiomyocytes. Each dot represents an individual cell. ** denotes p < 0.01 and *** denotes p < 0.001, Wilcoxon test. For Tg(myl7:CA-myl9-eGFP) into WT transplants: host OC (N=8 embryos, n=145 cells); donor OC (N=8 embryos, n=49 cells); host IC (N=7 embryos, n=91 cells); donor IC (N=7 embryos, n=44 cells). For Tg(myl7:DN-myl9-eGFP) into WT transplants: host OC (N=10 embryos, n=156 cells); donor OC (N=10 embryos, n=65 cells); host IC (N=8 embryos, n=60 cells); donor IC (N=8 embryos, n=27 cells). Scale bars = 15 μm.
Figure 5.
Figure 5.. Reduced blood flow inhibits the divergence of OC and IC cardiomyocyte shapes and actomyosin organization.
(A-H) Comparison of cardiomyocyte morphologies in wild-type and myh6 mutant hearts. (A and C) 3D reconstructions of wild-type (A) and myh6 mutant (C) hearts at 48 hpf; immunostaining for Cdh2 labels lateral membranes of cardiomyocytes. OCs (A′ and C′) and ICs (A″ and C″) are shown for hearts in (A and C). Insets show higher magnification. Apical surface area of an individual cardiomyocyte is illustrated by blue or pink fill. (B and D) Sections through hearts in (A and C). (B′, B″, D′, and D″) Magnified views of blue (OC) and pink (IC) boxed regions in (B and D); blue and pink brackets highlight apicobasal length of individual cells. (E-H) Violin plots compare apical surface area, apicobasal length, volume, and circularity for cells from wild-type and myh6 mutant hearts. (H) Note that myh6 OC cardiomyocytes are more elongated than wild-type OC cardiomyocytes, a finding that contrasts with our previous work (Auman et al., 2007). We posit that this discrepancy could arise from changes in the genetic background over time or to differences in how data were collected (e.g. where the OC boundary was drawn or how individual cardiomyocytes were measured). (I-P) Comparison of subcellular actomyosin organization in wild-type and myh6 mutant cardiomyocytes. (I and J) Wild-type (I) and myh6 mutant (J) hearts at 36 hpf, immunostained for pMyosin and stained with Phalloidin to label F-actin. Immunostaining for Alcama labels lateral membranes of cardiomyocytes. (K-N) Cross-sections through representative cardiomyocytes from the OC (K and L) and IC (M and N) of 36 hpf wild-type (K and M) and myh6 mutant (L and N) hearts. Empty arrowheads: apical membranes. Filled arrowheads: basal membranes. Arrows: lateral membranes. (O) Violin plots show calculated values of (mean basal F-actin / (mean apical F-actin + mean lateral F-actin)) for individual cells. (P) Violin plots of calculated values as in (O), but for pMyosin. For all violin plots, each small grey dot represents an individual cell, each black bar represents the mean of values from individual cells, and each large colored dot represents the mean of all values from an individual embryo; * denotes p < 0.05, ** denotes p < 0.01, and *** denotes p < 0.001, Wilcoxon test. For morphometrics: wild-type OC (N=5 embryos, 267 cells); myh6 OC (N=6 embryos, n=275 cells); wild-type IC (N=5 embryos, n=120 cells); myh6 IC (N=6 embryos, n=135 cells). For actomyosin localization: wild-type proximal OC (N=5 embryos, n=39 cells); myh6 proximal OC (N=4 embryos, n=32 cells); wild-type distal OC (N=5 embryos, n=41 cells); myh6 distal OC (N=4 embryos, n=24 cells); wild-type IC (N=5 embryos, n=54 cells); myh6 IC (N=4 embryos, n=35 cells). Scale bars = 20 μm (A-D, I, and J); 2 μm (K-N).
Figure 6.
Figure 6.. tbx5a regulates pathways that support the divergence of OC and IC cardiomyocyte morphologies and actomyosin organization.
(A-H) Comparison of cardiomyocyte morphologies in wild-type and tbx5a mutant hearts. (A and C) 3D reconstructions of wild-type (A) and tbx5a mutant (C) hearts at 48 hpf; immunostaining for Cdh2 labels lateral membranes of cardiomyocytes. OCs (A′ and C′) and ICs (A″ and C″) are shown for hearts in (A and C). Insets show higher magnification. Apical surface area of an individual cardiomyocyte is illustrated by blue or pink fill. (B and D) Sections through hearts in (A and C). (B′, B″, D′, and D″) Magnified views of blue (OC) and pink (IC) boxed regions in (B and D); blue and pink brackets highlight apicobasal length of individual cardiomyocytes. (E-H) Violin plots compare apical surface area, apicobasal length, volume, and circularity for cardiomyocytes from wild-type and tbx5a mutant hearts. (I-P) Comparison of subcellular actomyosin organization in wild-type and tbx5a mutant cardiomyocytes. (I and J) Wild-type (I) and tbx5a mutant (J) hearts at 36 hpf, immunostained for membrane-bound eGFP and pMyosin, and stained with Phalloidin to label F-actin. (K-N) Cross-sections through representative cardiomyocytes from the OC (K and L) and IC (M and N) of 36 hpf wild-type (K and M) and tbx5a mutant (L and N) hearts. Empty arrowheads: apical membranes. Filled arrowheads: basal membranes. Arrows: lateral membranes. (O) Violin plots show calculated values of (mean basal F-actin / (mean apical F-actin + mean lateral F-actin)) for individual cells. (P) Violin plots of calculated values as in (O), but for pMyosin. For all violin plots, each small grey dot represents an individual cell, each black bar represents the mean of values from individual cells, and each large colored dot represents the mean of all values from an individual embryo. ** denotes p < 0.01 and *** denotes p < 0.001, Wilcoxon test. For morphometrics: wild-type OC (N=5 embryos, n=214 cells); tbx5a OC (N=5 embryos, n=220 cells); wild-type IC (N=5 embryos, n=126 cells); tbx5a IC (N=5 embryos, n=141 cells). For actomyosin localization: wild-type proximal OC (N=5 embryos, n=58 cells); tbx5a proximal OC (N=5 embryos, n=64 cells); wild-type distal OC (N=5 embryos, n=61 cells); tbx5a distal OC (N=5 embryos, n=67 cells); wild-type IC (N=5 embryos, n=69 cells); tbx5a IC (N=5 embryos, n=81 cells). Scale bars = 20 μm (AD, I, and J); 2 μm (K-N).
Figure 7.
Figure 7.. tbx5a functions in a partially cell-autonomous manner to support subcellular F-actin organization.
(A-D) 3D reconstructions show examples of mosaic 36 hpf hearts resulting from blastomere transplantation. Immunostaining for Alcama labels lateral membranes of cardiomyocytes (blue), and donor-derived cells are labeled with rhodamine-dextran (magenta). (E, F, H, I, K, L, N, and O) Cross-sections through representative cardiomyocytes from the OC (E, H, K, and N) and IC (F, I, L, and O) from each of the four transplant scenarios. Immunostaining for Alcama labels lateral membranes of cardiomyocytes (blue) and staining with Phalloidin labels F-actin (green); rhodamine dextran labels donor-derived cardiomyocytes (magenta). Empty arrowheads: apical membranes. Filled arrowheads: basal membranes. Asterisks: basal extreme of lateral membranes. (G, J, M, and P) Violin plots compare calculated values of (mean basal F-actin / (mean apical F-actin + mean lateral F-actin)) of host-derived cardiomyocytes to those of donor-derived cardiomyocytes for each transplant scenario. Each dot represents an individual cell. * denotes p < 0.05, and ** denotes p < 0.01, Wilcoxon test. For WT into WT transplants: host proximal OC (N=6 embryos, n=55 cells); donor proximal OC (N=7 embryos, n=14 cells); host distal OC (N=5 embryos, n=30 cells); donor distal OC (N=6 embryos, n=29 cells); host IC (N=4 embryos, n=30 cells); donor IC (N=4 embryos, n=29 cells). For WT into tbx5a transplants: host proximal OC (N=5 embryos, n=40 cells); donor proximal OC (N=5 embryos, n=25 cells); host distal OC (N=5 embryos, n=40 cells); donor distal OC (N=5 embryos, n=35 cells); host IC (N=5 embryos, n=18 cells); donor IC (N=5 embryos, n=14 cells). For tbx5a into WT transplants: host proximal OC (N=7 embryos, n=38 cells); donor proximal OC (N=5 embryos, n=14 cells); host distal OC (N=6 embryos, n=28 cells); donor distal OC (N=5 embryos, n=13 cells); host IC (N=5 embryos, n=44 cells); donor IC (N=5 embryos, n=18 cells). For tbx5a into tbx5a transplants: host proximal OC (N=4 embryos, n=16 cells); donor proximal OC (N=2 embryos, n=3 cells); host distal OC (N=4 embryos, n=21 cells); donor distal OC (N=4 embryos, n=14 cells); host IC (N=5 embryos, n=36 cells); donor IC (N=5 embryos, n=14 cells). Scale bars = 20 μm (A-D); 3 μm (E, F, H, I, K, L, N, and O).
Figure 8.
Figure 8.. Changes to the actin cytoskeleton and cardiomyocyte shape during curvature formation.
(A) During the second day of zebrafish development, the linear heart tube transforms into a two-chambered heart. Once similarly contoured regions (light purple) bend and stretch to become the convex OC (blue) and the concave IC (pink). (B and C) Schematic portrays select cellular and subcellular traits and events that accompany curvature formation. At the linear heart tube stage, cardiomyocytes in the future OC and IC (particularly those positioned more proximally, as shown here; light purple) present similar morphologies and F-actin organization, with most F-actin restricted to the basal surface. Over the next 12 hours, OC (B, light blue) and IC (C, light pink) cardiomyocytes have begun to diverge slightly in shape, and F-actin organization has also diverged. In the OC, there remains a large pool of basal F-actin, whereas in the IC, a lower proportion of F-actin resides at the basal surface and there instead exists a larger pool of apical and lateral F-actin. This difference is facilitated by NMII activity, as well as by blood flow through the ventricle and by tbx5a-regulated pathways; specifically, these factors appear to influence either the retention of basal F-actin or the prevention of formation of F-actin networks at the lateral and apical surfaces in OC cardiomyocytes. We propose that the basal enrichment of F-actin in OC cardiomyocytes (B) allows for interaction with focal adhesions to enact outward pushing of the basal surface (thick black arrows). Simultaneously, maintaining a low amount of actomyosin at the apical surface may allow this surface to passively expand along with the actively spreading basal surface (grey arrows). In the IC (C), we speculate that lower levels of basal F-actin might result in weakened interaction with focal adhesions and less outward pushing (thin black arrows), while more actomyosin at the apical surface may increase tension and prevent passive spreading (inward-facing thin black arrows). As a consequence of limited planar expansion, the increasing volume of IC cardiomyocytes instead leads to expansion along the apicobasal axis (thick black arrows). By 48 hpf, OC (darker blue) and IC (darker pink) cells have acquired strikingly different cell morphologies. In contrast, the actin cytoskeleton seems to have converged into similar arrangements in both OC and IC cardiomyocytes, with F-actin distributed fairly equally around all cell membranes, and, in both regions, it seems that the role of actomyosin changes altogether, with the primary role of NMII being to maintain cell shapes.

References

    1. Albu M., Affolter E., Gentile A., Xu Y., Kikhi K., Howard S., Kuenne C., Priya R., Gunawan F., & Stainier D. Y. R. (2024). Distinct mechanisms regulate ventricular and atrial chamber wall formation. Nature Communications, 15(1), 8159. 10.1038/s41467-024-52340-3 - DOI - PMC - PubMed
    1. Andrews T. G. R., & Priya R. (2024). The Mechanics of Building Functional Organs. Cold Spring Harbor Perspectives in Biology, a041520. 10.1101/cshperspect.a041520 - DOI - PMC - PubMed
    1. Aphalo P. (2024). ggpmisc: Miscellaneous Extensions to “ggplot2” [Computer software]. https://CRAN.R-project.org/package=ggpmisc
    1. Auman H. J., Coleman H., Riley H. E., Olale F., Tsai H.-J., & Yelon D. (2007). Functional Modulation of Cardiac Form through Regionally Confined Cell Shape Changes. PLoS Biology, 5(3), e53. 10.1371/journal.pbio.0050053 - DOI - PMC - PubMed
    1. Auman H. J., Fernandes I. H., Berríos-Otero C. A., Colombo S., & Yelon D. (2024). Zebrafish smarcc1a mutants reveal requirements for BAF chromatin remodeling complexes in distinguishing the atrioventricular canal from the cardiac chambers. Developmental Dynamics, 253(1), 157–172. 10.1002/dvdy.595 - DOI - PMC - PubMed

Publication types

LinkOut - more resources