[Preprint]. 2025 Jan 10:2025.01.09.632276.
doi: 10.1101/2025.01.09.632276.

Neural plate pre-patterning enables specification of intermediate neural progenitors in the spinal cord

Affiliations

Neural plate pre-patterning enables specification of intermediate neural progenitors in the spinal cord

Sandy Nandagopal et al. bioRxiv. .

Abstract

Dorsal-ventral patterning of neural progenitors in the posterior neural tube, which gives rise to the spinal cord, has served as a model system to understand how extracellular signals organize developing tissues. While previous work has shown that signaling gradients diversify progenitor fates at the dorsal and ventral ends of the tissue, the basis of fate specification in intermediate regions has remained unclear. Here we use zebrafish to investigate the neural plate, which precedes neural tube formation, and show that its pre-patterning by a distinct signaling environment enables intermediate fate specification. Systematic spatial analysis of transcription factor (TF) expression and signaling activity using a reference-based mapping approach shows that the neural plate is partitioned into a striking complexity of TF co-expression states that, in part, correspond to the activity of gastrulation signals such as FGF and Wnt that persist through axis extension. Using in toto analysis of cellular movement combined with fate mapping, we find that dbx1b-expressing intermediate progenitors (p0) originate from a neural-plate specific state characterized by transient co-expression of the TFs pax3a, olig4 and her3. Finally, we show that this state is defined by Wnt signaling in the posterior neural plate and that ectopic Wnt activation within pax3a/olig4+ cells is sufficient to promote dbx1b expression. Our data broadly support a model in which neural progenitor specification occurs through the sequential use of multiple signals to progressively diversify the neural tissue as it develops. This has implications for in vitro differentiation of spinal cord cell types and for understanding signal-based patterning in other developmental contexts.


Figures
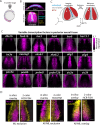
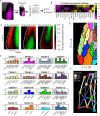
Figure 1.
Figure 1.. The neural plate shows patterned expression of several transcription factors, which can be compared in silico after reference-mapping.
(A) Schematic showing approximate orientation of 5–6 somite-stage (ss) zebrafish embryo used for imaging the neural plate. (B) 3D-rendered visualization of 5–6 ss embryo expressing shh:GFP (cyan), with HCR RNA-FISH labeling of sox19a (magenta) and ripply1 (yellow) expression, and imaged as in (A). Lateral and dorsal views are shown. “A” = Anterior; “P” = Posterior. “D” = Dorsal; “V” = Ventral. (C)Schematic showing reference-mapping transformation from imaging coordinates to reference-based coordinates. “M” = Medial; “L” = Lateral. (D) Reference-maps showing mRNA expression (magenta) of the indicated transcription factors, measured using HCR RNA-FISH. The black background corresponds to the neural plate, co-labeled in each measurement using sox19a. Each map depicts the average of reference-mapped HCR RNA-FISH signal across n = 3 embryos, each symmetrized and normalized to the maximal detected signal within the image. See also Figure S1C, S2A–D. (E) Comparison between in silico overlays of the reference-maps for the indicated genes (left half of each split panel) and representative examples of their co-expression within a single embryo (right half of each split panel, maximum intensity projection), measured using two-color HCR RNA-FISH. Scale bar indicates 50 μm.
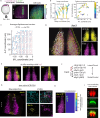
Figure 2.
Figure 2.. The neural plate is partitioned into multiple TF co-expression states.
(A) Schematic of analysis workflow. Each TF reference-map was first downsampled through binning of pixels to generate a corresponding map of ‘superpixels’. Superpixels were then analyzed by principal component analysis (PCA) and k-means clustering. (B) Loading values per TF (columns) for each of the first three principal components (rows). Higher absolute values indicate a greater contribution of a TF towards the corresponding principal component. See also Figure S4C. (C) Map of superpixel weights along the first three principal components. See also Figure S4B. (D) Map of cluster labels for superpixels after k-means clustering. (E) Mean expression levels of indicated TFs within the individual clusters shown in (D). Only TFs with mean expression above a threshold (dashed line) are shown. (F) Similarity between clusters, measured by distance in gene-expression values. ‘High’ similarity indicates that the distance between corresponding clusters is in the lowest 33rd percentile of all pairwise distances between clusters, ‘Medium’ similarity indicates distance in the 33rd - 66th percentile, and ‘Low’ indicates distance is >66th percentile. Note that links are only shown between clusters that share a boundary.
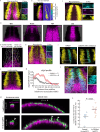
Figure 3.
Figure 3.. dbx1b+ cells emerge from the lateral boundary of her3 expression in the neural plate.
(A) (Left) Schematic showing region of sox19a:H2B-mCherry, shh:GFP double-transgenic embryo that was imaged to analyze cell movement in the neural plate. (Middle) 3D-rendered visualization of imaged area at 4 ss. Asterisk indicates the approximate position of the posterior tip of the notochord, annotated manually. “A” = Anterior; “P” = Posterior. (Right) Cell tracks indicating the position of cells at different timepoints during timelapse imaging. (B) Position over time for selected cells (#1–8) and the notochord end point (asterisk), in image coordinates (left) and after reference-mapping relative to the reference point (right). (C) Mean reference-mapped displacement vectors (blue arrows) for cells in the neighborhood of the indicated positions (orange markers) between 4–5s ss and 6 ss (20 min time period). Displacement vectors from corresponding positions on the left and right sides of the embryo have been averaged. See Figure S5A for (non-averaged) displacement on left and right sides. (D) Overlay of displacement vectors from (C) and reference-mapped expression of her3 at 4–5 ss (yellow) and 6 ss (magenta). Yellow and magenta colored dashed lines indicate lateral boundaries of her3 expression at 4–5 ss and 6 ss, respectively. White dashed line indicate medial boundary. Note that vectors outside her3 expression regions are not shown. (E) in silico overlays of reference-maps for the indicated genes; same data as Figure 1C. (F) Schematic showing that ventral fates, but not dorsal fates, emerge from the her3 region in the neural plate. (G) (Left) Representative example of her3 (magenta) and dbx1b (yellow) expression, measured using HCR RNA-FISH, in a single embryo that expresses a membrane-localized mNeongreen fluorescent protein (not shown). Maximum projection of 3D image is shown. (Right) A single Z-slice of the 3D image showing membrane fluorescence (cyan). An individual cell co-expressing her3 (magenta) and dbx1b (yellow) expression is outlined. (H) (Left) in silico overlay of dbx1b (yellow) and her3 (magenta) reference-maps; same data as Figure 1C. (Right) Heat map showing average fraction of dbx1b+ cells that co-express her3 within n = 3 individual embryos in which both genes are labeled using HCR RNA-FISH. (I) Cross-section of 15 ss neural tube in double transgenic embryos expressing her3:mScarlet-NLS (red) and TgBAC(dbx1b:GFP) (green). The dashed line indicates the region of the neural tube expressing mScarlet-NLS.
Figure 4.
Figure 4.. Neural plate Wnt signaling determines dbx1b precursor region.
(A) (Left) Representative example of her3 (magenta) and olig4 (yellow) expression, measured using HCR RNA-FISH, in a single embryo that expresses a membrane-localized mNeongreen fluorescent protein (not shown). Maximum projection of 3D image is shown. (Right) A single Z-slice of region outlined in black showing membrane fluorescence (cyan) (top panel), overlaid with her3 (middle panel) or olig4 (bottom panel). (B) (Left) Average reference-mapped expression of olig4 (yellow) and her3 (magenta) (n = 2 embryos). (Right) Heat map showing average fraction of olig4+ cells that co-express her3 within individual embryos in which both genes are labeled using HCR RNA-FISH. (C) (Left) Representative example of dbx1b (magenta) and GFP mRNA (yellow) expression, measured using HCR RNA-FISH, in a TgBAC(pax3a:GFP) transgenic embryo that also expresses a membrane-localized mNeongreen fluorescent protein (not shown). Maximum projection of 3D image is shown. (Right) A single Z-slice of the 3D image showing membrane fluorescence (cyan) (top panel), overlaid with dbx1b (middle panel) or GFP (bottom panel). Individual cells co-expressing dbx1b (magenta) and GFP (yellow) expression are outlined. (D) Reference-maps of indicated signaling pathway targets. Each map depicts the average of reference-mapped signal across n = 3 embryos, each symmetrized and normalized to the maximal detected signal within the image. (E) (Left) Outlines of TF clusters overlaid on average sp5l reference-map (magenta, same as 4D). (Right) Mean reference-mapped sp5l expression within TF clusters (labels as in Figure 2D, E). (F) in silico overlay of olig4 (yellow) and sp5l (magenta) reference-maps; same data as Figure 1C, 4D. (G) (Left) Representative example of sp5l (magenta) and olig4 (yellow) expression, measured using HCR RNA-FISH, within an individual embryo that also expresses a membrane-localized mNeongreen fluorescent protein (not shown). Maximum projection of 3D image is shown. (Right) A single Z-slice of the 3D image showing membrane fluorescence (cyan) (top panel), overlaid with sp5l (middle panel) or olig4 (bottom panel). Note co-expression of sp5l and olig4 in individual cells. (H-I) olig4 response to Wnt inhibition. (H) Representative examples of olig4 (yellow) expression, measured using HCR RNA-FISH, after treatment with LGK974 (right) or DMSO control (left). Embryos express a shh:GFP reporter (cyan). Maximum projection of 3D image is shown. White boxes indicate regions used to calculate medio-lateral profile of olig4 in (I). (I) Median medio-lateral profile of olig4 in embryos treated with LGK974 (red) or DMSO control (black). Shaded regions indicates S.E.M. n indicates number of embryos. (J) (Left) Representative example of sp5l (magenta), olig4 (yellow) and her3 (cyan) expression, measured using HCR RNA-FISH, within an individual embryo. Maximum projection of 3D image is shown. (Right) A single Z-slice of region outlined in white showing co-expression of sp5l and her3 with olig4; dashed line indicates medial boundary of olig4. (K-L) dbx1b:GFP response to Wnt activation. (K) Representative examples of transverse (left column) and sagittal (right column) cross-sections of 15–18 ss neural tube after mosaic expression of CA-bcat-tagBFP2 (bottom) or tagBFP2 control (top) in transgenic embryos expressing her3:mScarlet-NLS (magenta) and TgBAC(dbx1b:GFP) (green). (L) Cumulative dbx1b:GFP signal dorsal to her3:mScarlet-NLS reporter. Circles represent different embryos, while horizontal line indicates median. P value calculated using Student’s T-Test. See also Figure S6I.

Similar articles

References

    1. Briscoe J., and Small S. (2015). Morphogen rules: design principles of gradient-mediated embryo patterning. Development 142, 3996–4009. 10.1242/dev.129452. - DOI - PMC - PubMed
    1. Tuazon F.B., and Mullins M.C. (2015). Temporally coordinated signals progressively pattern the anteroposterior and dorsoventral body axes. Semin. Cell Dev. Biol. 42, 118–133. 10.1016/j.semcdb.2015.06.003. - DOI - PMC - PubMed
    1. Sjöqvist M., and Andersson E.R. (2019). Do as I say, Not(ch) as I do: Lateral control of cell fate. Dev. Biol. 447, 58–70. 10.1016/j.ydbio.2017.09.032. - DOI - PubMed
    1. Landge A.N., Jordan B.M., Diego X., and Müller P. (2020). Pattern formation mechanisms of self-organizing reaction-diffusion systems. Dev. Biol. 460, 2–11. 10.1016/j.ydbio.2019.10.031. - DOI - PMC - PubMed
    1. Huang A., and Saunders T.E. (2020). A matter of time: Formation and interpretation of the Bicoid morphogen gradient. Curr. Top. Dev. Biol. 137, 79–117. 10.1016/bs.ctdb.2019.11.016. - DOI - PubMed

Publication types