[Preprint]. 2025 Jan 7:2025.01.06.631465.
doi: 10.1101/2025.01.06.631465.

Navigating uncertainty: reward location variability induces reorganization of hippocampal spatial representations

Affiliations

Navigating uncertainty: reward location variability induces reorganization of hippocampal spatial representations

Charline Tessereau et al. bioRxiv. .

Abstract

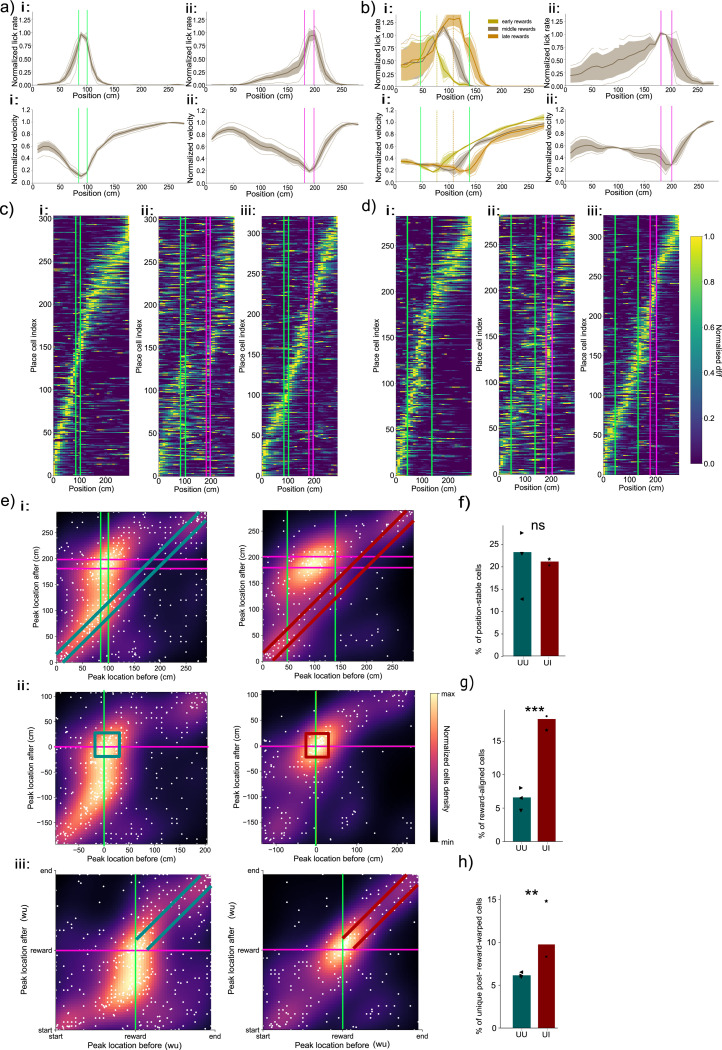
Navigating uncertainty is crucial for survival, with the location and availability of reward varying in different and unsignalled ways. Hippocampal place cell populations over-represent salient locations in an animal's environment, including those associated with rewards; however, how the spatial uncertainties impact the cognitive map is unclear. We report a virtual spatial navigation task designed to test the impact of different levels and types of uncertainty about reward on place cell populations. When the reward location changed on a trial-by-trial basis, inducing expected uncertainty, a greater proportion of place cells followed along, and the reward and the track end became anchors of a warped spatial metric. When the reward location then unexpectedly moved, the fraction of reward place cells that followed was greater when starting from a state of expected, compared to low, uncertainty. Overall, we show that different forms of potentially interacting uncertainty generate remapping in parallel, task-relevant, reference frames.

Keywords: expected uncertainty; hippocampus; remapping; reward place cells; unexpected uncertainty.


Conflict of interest statement

Conflict of interest/Competing interests The authors declare no conflict of interest.

Figures

Fig. 5:
Fig. 5:
CRediT
Fig. 1:
Fig. 1:. Training protocol and imaging procedure
a) Training protocol: head-fixed mice on a wheel ran in 1d virtual reality (VR) environments in which water reward was delivered at specific potential locations once per traversal of a 3m long linear track (and could subsequently be consumed anywhere by licking). In the low uncertainty condition (LU), the location could take one of two positions at the edges of a 10cm reward zone (left). In the expected uncertainty condition (EU), there were 10 potential locations evenly spaced within a 90cm wide zone that were selected uniformly at random on every run (right). Mice were trained on one session per day (on average 88.8 trials ±15 std) until their behaviour was stable. b) After training, mice experienced a switch session. Initial trials (on average 40.8 ±−3.5 std) in the session had the same location contingencies as those experienced during training. Without prior notice, the locations at which reward might be provided switched to one of two positions at the edges of a more distal 10cm zone, thus creating unexpected uncertainty (UU, left) in mice originally trained in LU, and a form of uncertainty interaction (UI, right) for mice originally trained in EU. c) Schematic of the VR apparatus: the licking behavior of mice was recorded as they ran on a wheel whose turning determined the velocity of the visual flow on screens. When the mice reached the end of the track, the screen went black for 3 seconds and mice were teleported to the start of the virtual track. d) Visualization of the track used for VR in this paper. Top: 3D view of the track, showing the relative perspective with distal cues. Bottom: front view of the track. e) Schematic of two photon calcium imaging of mouse CA1 neurons (green colors) expressing jGCaMP8m.
Fig. 2:
Fig. 2:. Expected uncertainty reveals dual spatial and reward reference frames for behaviour and place cell activity, and a warped metric that combines both
a) i: Average lick rate (number of lick events per 10cm position bin) after training in the LU condition. ii: Average velocity trace in the same condition. For both: Thick line shows the mean across sessions (n = 12 sessions, m = 3 mice) normalised to the maximum per session, shaded region represents the standard deviation across sessions; shaded lines show each session trace. iii;iv: The same plots as for LU, but under EU, for laps of trials separated as shown in b): yellow: proximal, grey: middle and orange distal reward trials. For both top and bottom: Thick line showing the mean across sessions (n = 16 sessions, m = 4 mice) normalised to the maximum per session, shaded region represents the std across sessions, shaded lines show each session trace. Green thick lines show the reward zone. b) Diagram of the division between the laps according to the location at which the reward was consumed for the analysis in EU. c) i: Cross validated place map in a position reference frame for one session of LU for one animal, showing the average place cell activities (N = 437 place cells out of 518 total cells) on even trials normalised to their maximum value, ordered by their position of peak activity on odd trials, after training in low uncertainty. ii: The same activity, but averaged according to a reward reference frame (aligning the position to the reward location at every trial – see Methods). iii: The same activity averaged according to a warped/interpolated position-reward reference frame (a warped metric vector is created by two uniform interpolations linking the start of the track - reward - end of the track – see Methods). d) The same (c), but for an animal experiencing EU (N = 369 place cells out of 475 total cells). e) i: Scatter plot showing the positions of peak activity on trials on which the reward is at the proximal(x-axis) versus distal (y-axis) end of the reward zone for LU (left; 1118 place cells) and EU (right; 1192 place cells). Each white dot is a single place cell; the heatmaps show a probability density function estimate of the data (see Methods, normalised to 1). Yellow lines show the reward zone on proximal trials, orange lines on distal trials. Blue lines (left) and purple lines (right) delineate the diagonal used in the quantification for statistics in f). Scatter plots include a jitter proportional to cell density, enhancing visualization of overlapping data points. ii: Similar to (i), but in a reward-centered reference frame. The yellow line shows the reward location on proximal trials, the orange line on distal trials (both at 0, by definition of the reward reference frame). Blue square (left) and purple square (right) delineate the area used in the quantification for statistics in g). iii: similar to (i) in a warped metric (see Methods). Blue lines (left) and purple lines (right) delineate the post-reward diagonal used in the quantification for statistics in h). f) Percentages of cells that have a similar (±15cm) position of peak activity in ‘proximal’ and ‘distal’ reward trials in LU (blue region) and EU (purple region). comparison proportion z-test LU/EU p = 1 × 10−53, 1-sided proportion z-test LU>EU p = 5.26 × 10−54. g) Same than f) in a reward reference frame. Comparison proportion z-test LU/EU p = 1.1 × 10−159, 1-sided proportion z-test EU>LU p = 5.51 × 10−160. h) Same than g) in a warped reference frame (±3warped units). Comparison proportion z-test LU/EU p = 1.2 × 10−61, 1-sided proportion z-test EU>LU p = 5.6 × 10−62. i) Percentages of cells that are stable in a position reference frame (with a maximum displacement of ±15cm; within the diagonal lines in e:i): i: before the reward zone, comparison proportion z-test p = 1.77 × 10⁻², 1-sided proportion z-test LU<EU p = 8.86 × 10⁻³; ii: in the vicinity of the reward zone (−15 +20cm), comparison proportion z-test p = 8.82 × 10⁻²⁸, 1-sided proportion z-test LU>EU p = 4.41 × 10⁻²⁸, iii: after the reward zone, comparison proportion z-test p = 3.17 × 10⁻², 1-sided proportion z-test LU<EU p = 1.59 × 10⁻², for LU (blue) and EU (purple). j) Same as (i) but divided by the total area covered by every zone. left: comparison proportion z-test p = 3.47 × 10⁻²⁸, 1-sided proportion z-test LU<EU p = 1.73 × 10⁻²⁸ middle: comparison proportion z-test p = 1.96×10⁻¹⁰, 1-sided LU>EU comparison test p = 5.31×10⁻¹¹, right: comparison proportion z-test p = 2 × 10⁻¹. k) Percentages of cells with stable peaks in a reward reference frame (±15cm; within the boxes in e:ii): i: before the reward, comparison proportion z-test LU/EU p = 3.06 × 10⁻⁸, 1-sided proportion LU>EU z-test p = 1.53×10⁻⁸. ii: in the vicinity of the reward zone ([−15,+20]cm), comparison LU/EU proportion z-test p = 1 × 10⁻⁵, 1-sided proportion z-test LU<EU p = 5.02 × 10⁻⁶. iii: after the reward zone, comparison proportion z-test p = 1.27 × 10⁻², 1-sided proportion z-test LU<EU p = 6.34 × 10⁻³, for LU (blue) and EU (purple). l) Percentages of cells with stable peaks in a warped reference frame (with a maximum displacement of 3 warped units, representing between 20cm and 40cm, depending on the position of the reward; within the diagonal lines in e:iii): i: before the reward, comparison proportion z-test LU/EU p = 3.37 × 10⁻¹, non significant. ii:: in the vicinity of the reward zone (−2 +3 warped units), comparison proportion z-test p = 9.06 × 10⁻⁶, 1-sided proportion LU>EU z-test p = 4.53 × 10⁻⁶. iii: after the reward zone, for LU (blue) and EU (purple), comparison proportion z-test LU/EU p = 8.4 × 10⁻⁷, 1-sided proportion LU<EU z-test p = 4.2 × 10⁻⁷.
Fig. 3:
Fig. 3:. Expected uncertainty in reward location enhances flexible reward and warped reference frames
a) UU: Top: normalized lick rate averaged over all sessions. i: before the switch, ii: after the switch. Bottom: similar to Top) for normalized velocity. Green thick lines show the full reward zone. Shaded areas show standard deviations and individual lines show individual sessions averages. b) UI: Top: normalized lick rate on proximal (Yellow), middle (Grey) and distal (Orange) reward trials. i: before the switch, ii: after the switch. Bottom: similar to Top) but for normalized velocity. Green thick lines show the full reward zone before the switch, pink lines the reward zone after the switch. Shaded areas show standard deviations and individual lines show individual sessions averages. See Figure ?? for results for separate mice. c) i: Place map before the switch (N place cells=304) in UU, showing the average activity for one animal, ordered according to their cross-validated position of peak activity before the switch, and shown in a position reference frame. Green lines mark the reward zone. ii: activities of the same cells ordered as in (i), after the switch. Turquoise lines mark the previous reward zone, pink lines show the new reward zone. iii: New place map after the switch (N after=322). d) The same as (c), but for UI (N before=283, N after=328). e) i: Scatter plot showing the positions in a position reference frame of peak activity before (x-axis)versus after the switch (y-axis) in UU (left) and UI (right). Each white dot is a cell and heatmap shows a probability density function estimate (see Methods). Turquoise lines delineate the diagonal used for statistics in f). Scatter plots include a jitter proportional to cell density, enhancing visualization of overlapping data points. ii: Similar to i: but in a reward reference frame. Turquoise squares delineate the area used for statistics in g). iii: Similar to (i:,ii:) but in a warped reference frame. Turquoise lines delineate the post-reward diagonal used for statistics in g). f) Percentages of cells with stable peaks in a position reference frame (with a maximum displacement of ±15cm; shown by the lines in the heatmap in e)i:) : for UU (turquoise) and UI (red). The black dots show individual session percentages. Comparison proportion z-test UU/UI p = 5.14 × 10⁻¹. g) Percentages of cells with stable peaks in a reward reference frame (between −15cm and +20cm of the reward; shown by the lines in the heatmap in e)ii:), excluding position-stable cells. Proportion z-test UI/UU p = 1.73 × 10⁻⁶, 1-sided comparison UU<UI 1-sided proportion z-test p = 8.65 × 10⁻⁷. h) Percentages of cells with stable peaks in a warped reference frame (with a maximum displacement of 3 warped units, representing between 20cm and 40cm, depending on the position of the reward, shown by the lines on the heatmaps in e)iii:), excluding position- and reward-stable cells. Proportion z-test UU/UI p = 2.94 × 10⁻³, 1-sided comparison UU<UI 1-sided proportion z-test p = 1.47 × 10⁻³.
Fig. 4:
Fig. 4:. Unexpected uncertainty in reward location highlights persistence of the previous reward location, EU features generalisation of reward encoding
a) Distribution of the locations of the peak activity of position-stable cells. The x-axis shows position along the track in cm. Bars show the percentage of position-stable cells having their peak activity in a position reference frame in the respective position-bin for UI (red) and UU (turquoise). Right insets show repeat of 3e) illustrating the cells counted in the histogram plot. Distribution comparison using a Kolmogorov-Smirnov test p = 0.47, non significant. b) Percentages of cells with stable peaks in a position reference frame: i: across the whole track (with a maximum displacement of ±15cm; similar to 3h) comparison UU/UI proportions z-test p = 5.14×10⁻¹, non significant; ii: before the reward zone (<−15cm) before and after the switch (horizontal bar zone in the insert); comparison UU/UI proportions z-test p = 8.64 × 10⁻², comparison UU>UI 1-sided proportion z-test p = 4.32 × 10⁻²; iii: in the vicinity of the reward zone (−15cm/+20cm) before and after the switch (tilted bar zone in the insert); comparison UU/UI proportions z-test p = 2.27 × 10⁻¹, non significant; iv) after the reward zone (>+20cm) both before and after the switch (vertical bar zone in the insert); comparison UU/UI proportions z-test p = 9.52 × 10⁻¹, non significant. c) Percentages of cells with stable peaks in a reward reference frame: i: across the whole track; comparison UU/UI proportions z-test p = 1.26 × 10⁻⁶, comparison UU<UI 1-sided proportion z-test p = 8.65 × 10⁻⁷; ii: before the reward zone (<−15cm) before and after the switch; comparison UU/UI proportions z-test p = 4.04 × 10⁻¹, non significant; iii: in the vicinity of the reward (−15cm/+20cm) before and after the switch; comparison UU/UI proportions z-test p = 1.73 × 10⁻⁶, comparison UU<UI 1-sided proportion z-test p = 8.65 × 10⁻⁷; iv) after the reward (>+20cm) before and after the switch; comparison UU/UI proportions z-test p = 4.14 × 10⁻¹, non significant. d) Percentages of cells with stable peaks in a warped reference frame: i: across the whole track; UU/UI proportions z-test p = 6.51 × 10⁻⁵, comparison UU<UI 1-sided proportion z-test p = 3.26 × 10⁻⁵; ii: before the reward (<−2 warped units) before and after the switch; comparison UU/UI proportions z-test p = 8.35×10⁻¹, non-significant; iii: in the vicinity of the reward (−2/+3 warped units) before and after the switch, comparison UU/UI proportions z-test p = 2.9×10⁻⁵, comparison UU<UI 1-sided proportion z-test p = 1.4 × 10⁻⁵; iv: after the reward (>+3 warped units) before and after the switch; comparison UU/UI proportions z-test p = 1.2 × 10⁻¹, comparison UU<UI 1-sided proportion z-test p = 6.2 × 10⁻². e) Distribution of the peak location relative to post-switch reward of the cells that peaked in the vicinity of ([−15,+20]cm) the reward before the switch for UI (red) and UU (turquoise). The x-axis shows bins of position along the track relative to post-switch reward. Cells peaking at 0cm follow the reward through the switch. Right insets repeat figure 3e), illustrating the cells counted in the histogram plot with vertical bars. Distribution comparison using a Kolmogorov-Smirnov test p-value< 2.2 × 10−308. f) Percentages per cm of previously reward peaking cells after the switch, that stay reward peaking (current, rightward tilt), that stay peaking at the previous reward (previous, leftward tilt), or that move elsewhere (else, plain bar) for UU. Comparison current>else 1-sided proportions z-test < 2.2 × 10−308, comparison previous>else 1-sided proportions z-test < 2.2 × 10−308.

References

    1. Anderson MI, Jeffery KJ (2003) Heterogeneous modulation of place cell firing by changes in context. Journal of Neuroscience 23(26):8827–8835 - PMC - PubMed
    1. Aoki Y, Igata H, Ikegaya Y, et al. (2019) The integration of goal-directed signals onto spatial maps of hippocampal place cells. Cell reports 27(5):1516–1527 - PubMed
    1. Bast T, Wilson IA, Witter MP, et al. (2009) From rapid place learning to behavioral performance: a key role for the intermediate hippocampus. PLoS biology 7(4):e1000089. - PMC - PubMed
    1. Behrens TE, Woolrich MW, Walton ME, et al. (2007) Learning the value of information in an uncertain world. Nature neuroscience 10(9):1214–1221 - PubMed
    1. Best PJ, White AM, Minai A (2001) Spatial processing in the brain: the activity of hippocampal place cells. Annual review of neuroscience 24(1):459–486 - PubMed

Publication types

LinkOut - more resources