. 2025 Jan 19;6(2):e70068.
doi: 10.1002/mco2.70068. eCollection 2025 Feb.

Targeting intracellular cancer proteins with tumor-microenvironment-responsive bispecific nanobody-PROTACs for enhanced therapeutic efficacy

Affiliations

Targeting intracellular cancer proteins with tumor-microenvironment-responsive bispecific nanobody-PROTACs for enhanced therapeutic efficacy

Changping Deng et al. MedComm (2020). .

Abstract

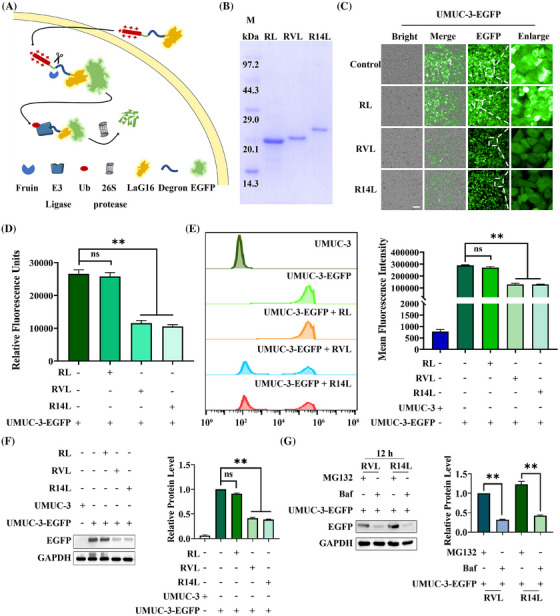
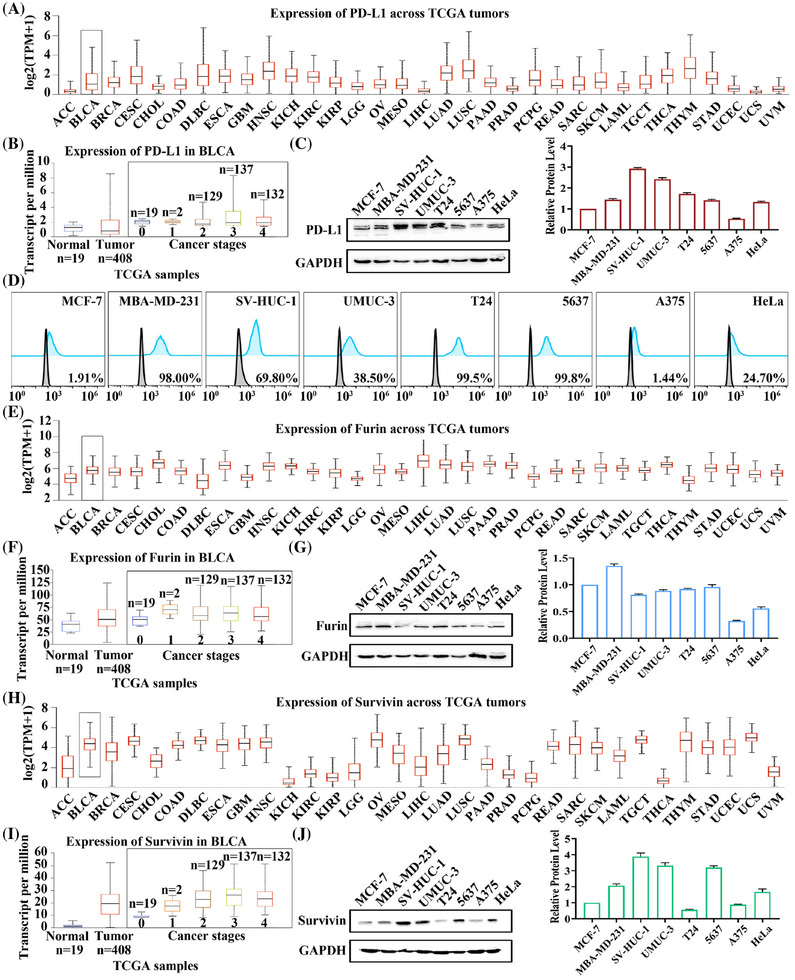
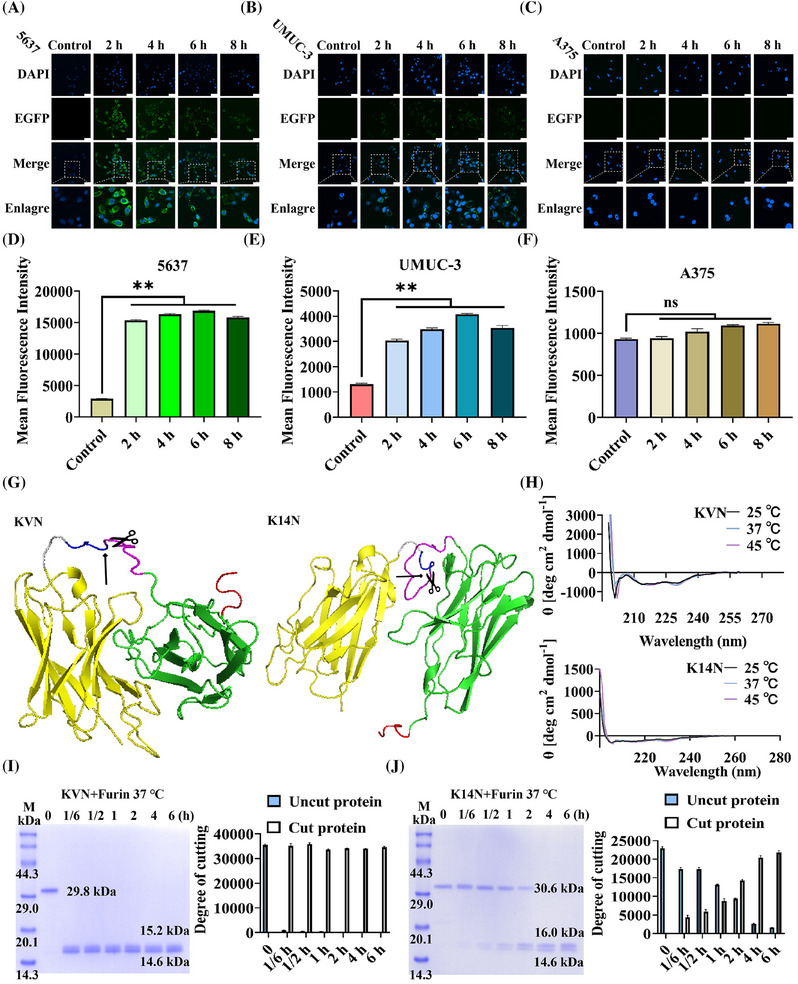
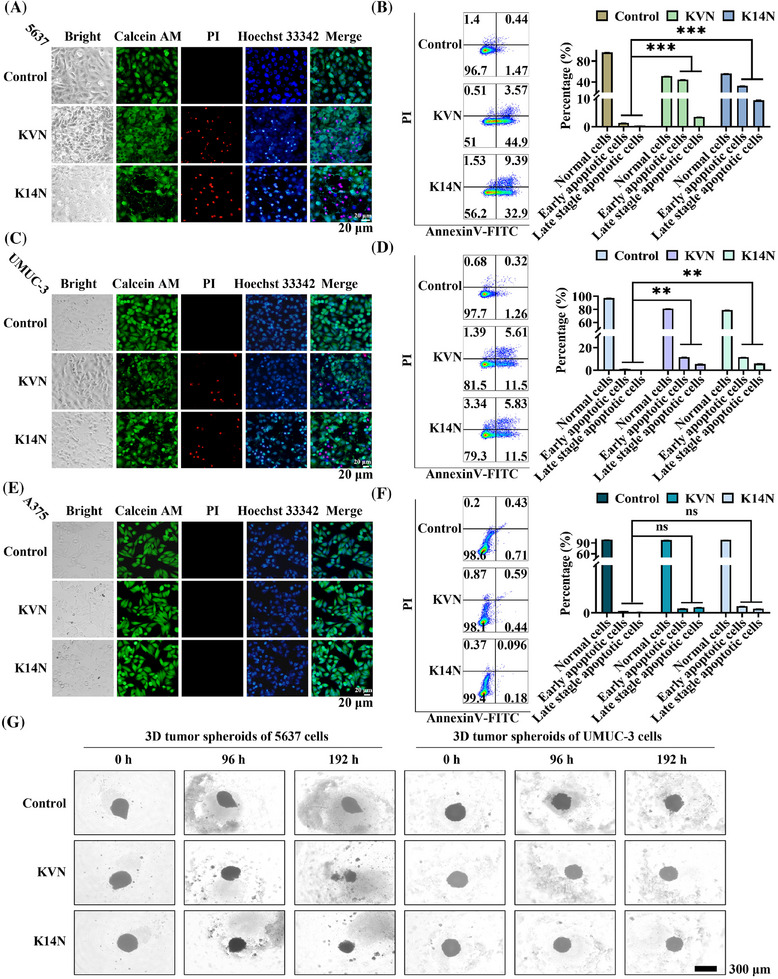
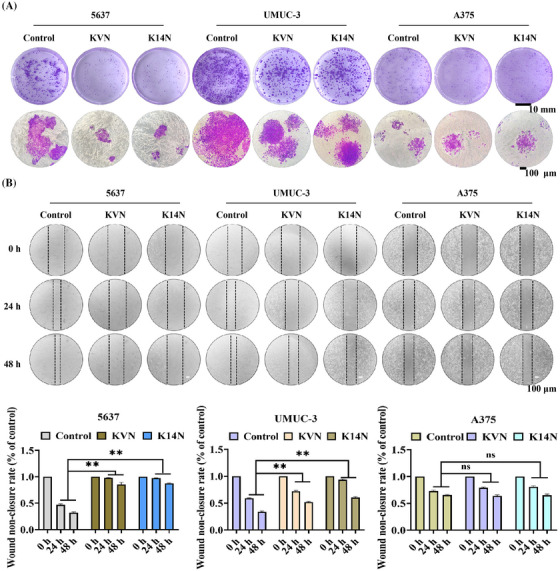
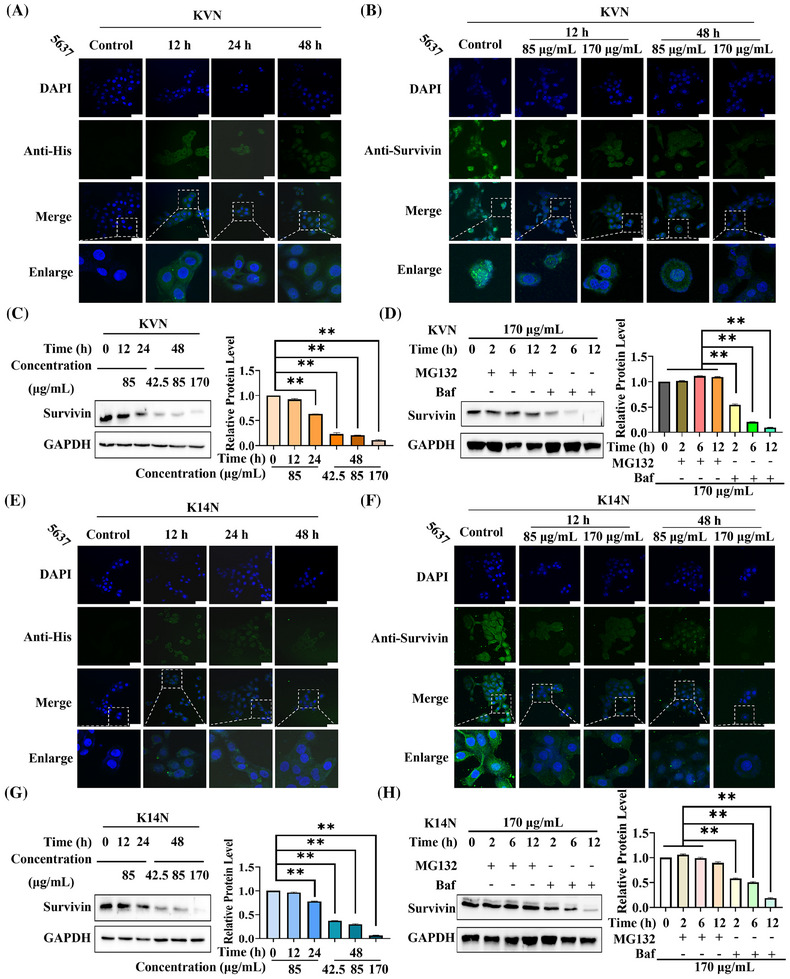
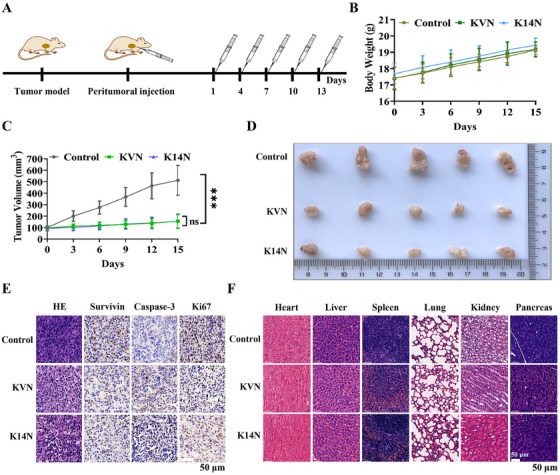
Proteolysis targeting chimeras (PROTACs) are pivotal in cancer therapy for their ability to degrade specific proteins. However, their non-specificity can lead to systemic toxicity due to protein degradation in normal cells. To address this, we have integrated a nanobody into the PROTACs framework and leveraged the tumor microenvironment to enhance drug specificity. In this study, we engineered BumPeD, a novel bispecific nanobody-targeted PROTACs-like platform, by fusing two nanobodies with a Furin protease cleavage site (RVRR) and a degron sequence (ALAPYIP or KIGLGRQKPPKATK), enabling the tumor microenvironment to direct the degradation of intracellular proteins. We utilized KN035 and Nb4A to target PD-L1 (programmed death ligand 1) on the cell surface and intracellular Survivin, respectively. In vitro experiments showed that BumPeD triggers Survivin degradation via the ubiquitin-proteasome pathway, inducing tumor apoptosis and suppressing bladder tumor cell proliferation and migration. In vivo experiments further confirmed BumPeD's robust anti-tumor efficacy, underscoring its potential as a precise protein degradation strategy for cancer therapy. Our platform provides a systematic approach to developing effective and practical protein degraders, offering a targeted theoretical basis and experimental support for the development of novel degradative drugs, as well as new directions for cancer therapy.

Keywords: PD‐L1 and Survivin; nanobody; proteolysis targeting chimeras (PROTACs); targeted degradation; tumor microenvironment.


Conflict of interest statement

The authors declare no conflict of interests.

Figures

FIGURE 1
FIGURE 1
Construction and validation of the nanobody‐targeted degradation platform. (A) Nanobody‐targeted protein degradation pattern diagram. (B) Protein purification results for RL (control group), RVL (experimental group), and R14L (experimental group). (C) Fluorescence effects of RL, RVL, and R14L proteins on UMUC‐3‐EGFP cells by fluorescence inversion microscopy. The UMUC‐3‐EGFP blank group and the RL‐treated group were both control groups. (D) Effect of RL, RVL, and R14L proteins on mean fluorescence intensity of UMUC‐3‐EGFP cells by a fluorescence microplate reader. The UMUC‐3‐EGFP blank group and the RL‐treated group were both control groups. (E) Fluorescence effects of RL, RVL, and R14L proteins on UMUC‐3‐EGFP cells detected by flow cytometry. The UMUC‐3 blank group, UMUC‐3‐EGFP blank group, and RL‐treated group were control groups. (F) The effects of RL, RVL, and R14L proteins on EGFP protein expression levels in UMUC‐3‐EGFP cells were detected by western blot. The UMUC‐3 blank group, UMUC‐3‐EGFP blank group, and RL‐treated group were control groups. (G) Effects of RVL and R14L protein treatment on UMUC‐3‐EGFP cells with simultaneous exogenous addition of MG132 or Baf on intracellular EGFP protein expression levels were detected by western blot. The UMUC‐3‐EGFP cells treated with MG132 were used as controls. MG132, 10 µg/mL; Baf, 65 ng/mL. Scale bar, 100 µm. ** p < 0.01, ns means not significant.
FIGURE 2
FIGURE 2
Analysis of PD‐L1, Furin, and Survivin expression levels. (A) TCGA database analysis of PD‐L1 gene expression levels across pan cancer. (B) TCGA database analysis of PD‐L1 gene expression levels in various stages of bladder cancer. (C) Western blot detection of PD‐L1 protein expression levels in multiple cell lines, including MCF‐7, MBA‐MD‐231, SV‐HUC‐1, UMUC‐3, T24, 5637, A375, and HeLa cells. (D) Flow cytometry measured PD‐L1 protein expression levels on the surface of multiple cell lines, including MCF‐7, MBA‐MD‐231, SV‐HUC‐1, UMUC‐3, T24, 5637, A375, and HeLa cells. (E) TCGA database analysis of Furin gene expression levels across pan cancer. (F) TCGA database analysis of Furin gene expression levels in various stages of bladder cancer. (G) Western‐blot detection of Furin protein expression levels in multiple cell lines, including MCF‐7, MBA‐MD‐231, SV‐HUC‐1, UMUC‐3, T24, 5637, A375, and HeLa cells. (H) TCGA database analysis of Survivin gene expression levels across pan cancer. (I) TCGA database analysis of Survivin gene expression levels in various stages of bladder cancer. (J) Western‐blot detection of Survivin protein expression levels in multiple cell lines, including MCF‐7, MBA‐MD‐231, SV‐HUC‐1, UMUC‐3, T24, 5637, A375, and HeLa cells.
FIGURE 3
FIGURE 3
Characterization of the performance of the components of the BumPeD system. (A–C): A laser confocal scanning microscope observed the internalization levels of the KE protein on 5637 cells, UMUC‐3 cells, and A375 cells. The 0 h as a control. (D–F): Flow cytometry measured the mean fluorescence intensity of KE protein internalized in 5637 cells, UMUC‐3 cells, and A375 cells. The 0 h as a control. (G) Tertiary structure prediction of KVN and K14N proteins, with the position indicated by the arrow being the Furin protease cleavage site. (H) Structural stability of KVN and K14N proteins at different temperatures was analyzed by circular dichroism. (I) In vitro analysis of the cleavage efficiency of KVN protein by Furin protease. Furin treatment for 0 h as a control. (J) In vitro analysis of the cleavage efficiency of K14N protein by Furin protease. Furin treatment for 0 h as a control. Scale bar, 50 µm. ** p < 0.01, ns means not significant.
FIGURE 4
FIGURE 4
In vitro pro‐apoptotic activity assay of KVN and K14N proteins. (A, C, E) The 5637 cells, UMUC‐3 cells, and A375 cells treated with KVN and K14N were stained with Calcein/PI/Hoechst 33342 reagent, respectively. Cell lines not treated with KVN or K14N proteins were controls. Scale bar, 20 µm. (B, D, F) The 5637 cells, UMUC‐3 cells, and A375 cells treated with KVN and K14N were detected by Annexin V‐FITC/PI, respectively. Cell lines not treated with KVN or K14N proteins were controls. (G) Inhibition effect of KVN and K14N proteins on 3D tumor spheroids on 5637 and UMUC‐3 cells. Cell lines not treated with KVN or K14N proteins were controls. Scale bar, 300 µm.
FIGURE 5
FIGURE 5
KVN and K14N proteins significantly inhibited the proliferation and migration of bladder cancer cells. (A) The effects of KVN and K14N proteins on the proliferation of 5637 cells, UMUC‐3 cells, and A375 cells were analyzed using clone formation assays with crystal violet staining. Cell lines not treated with KVN or K14N proteins served as controls. Scale bar, 10 mm, and 100 µm (B) The migratory effects of KVN and K14N proteins on 5637 cells, UMUC‐3 cells, and A375 cells were analyzed using scratch assay. Cell lines not treated with KVN or K14N proteins served as controls. Scale bar, 100 µm. ** p < 0.01, ns means not significant.
FIGURE 6
FIGURE 6
KVN and K14N proteins degraded Survivin protein via the ubiquitin‐proteasome pathway in 5637 cells. (A, E) Indirect immunofluorescence analysis of KVN and K14N proteins entry into 5637 cells. KVN or K14N protein treatment for 0 h as control. (B, F) Indirect immunofluorescence detected the effect of different concentrations of KVN and K14N proteins on Survivin protein at different times in 5637 cells. KVN or K14N protein treatment for 0 h as control. (C, G): Western blot detected the effect of different concentrations of KVN and K14N proteins on Survivin protein expression at different times in 5637 cells. KVN or K14N protein treatment for 0 h as control. (D, H): Western blot detected the effect of KVN and K14N proteins treatment of 5637 cells with simultaneous exogenous addition of MG132 or Baf on intracellular Survivin protein expression levels. KVN or K14N protein treatment for 0 h as control. MG132, 10 µg/mL; Baf, 65 ng/mL. Scale bar, 50 µm. ** p < 0.01.
FIGURE 7
FIGURE 7
In vivo assessment of tumor inhibition by KVN and K14N proteins. (A) Overall design of animal experiments. (B) Weighing nude mice in the control and experimental groups during treatment. (C) Tumor volumes were measured in control and experimental nude mice during treatment. (D) Tumors from control and experimental nude mice were peeled and photographed 15 days after treatment. (E) HE and IHC analysis of tumors in the control and experimental groups. (F) HE staining of the principal organs of nude mice in the control and experimental groups, including heart, liver, spleen, lung, kidney, and pancreas. The control group was treated with PBS (Phosphate Buffered Saline), and the experimental group was treated with KVN or K14N protein.

Similar articles

Cited by

References

    1. Li X, Pu W, Zheng Q, Ai M, Chen S, Peng Y. Proteolysis‐targeting chimeras (PROTACs) in cancer therapy. Mol Cancer. 2022;21(1):99. - PMC - PubMed
    1. He S, Dong G, Cheng J, Wu Y, Sheng C. Strategies for designing proteolysis targeting chimaeras (PROTACs). Med Res Rev. 2022;42(3):1280‐1342. - PubMed
    1. Martin‐Acosta P, Xiao X. PROTACs to address the challenges facing small molecule inhibitors. Eur J Med Chem. 2021;210:112993. - PMC - PubMed
    1. Wang Y, Jiang X, Feng F, Liu W, Sun H. Degradation of proteins by PROTACs and other strategies. Acta Pharm Sin B. 2020;10(2):207‐238. - PMC - PubMed
    1. Han X, Sun Y. PROTACs: a novel strategy for cancer drug discovery and development. MedComm. 2023;4(3):e290. - PMC - PubMed

LinkOut - more resources