[Preprint]. 2025 Jan 6:2024.11.21.24317726.
doi: 10.1101/2024.11.21.24317726.

Molnupiravir clinical trial simulation suggests that polymerase chain reaction underestimates antiviral potency against SARS-CoV-2

Affiliations

Molnupiravir clinical trial simulation suggests that polymerase chain reaction underestimates antiviral potency against SARS-CoV-2

Shadisadat Esmaeili et al. medRxiv. .

Abstract

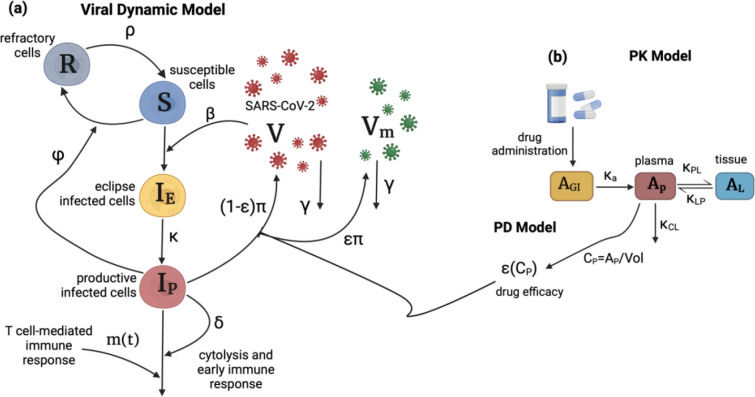
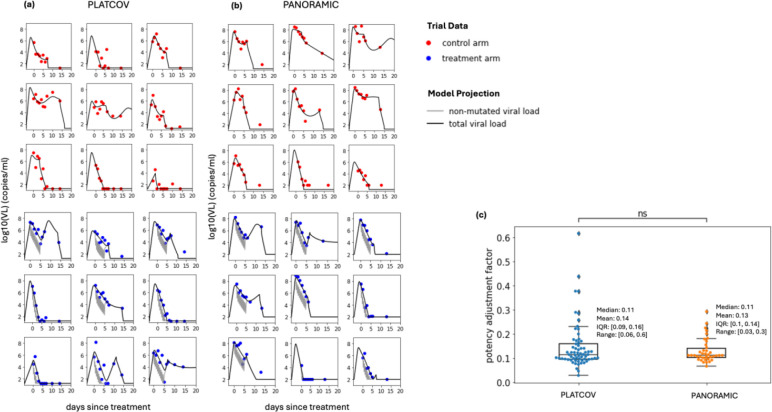
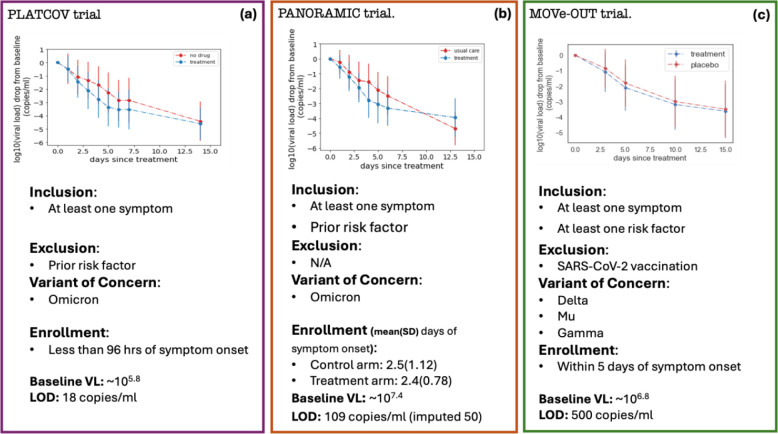
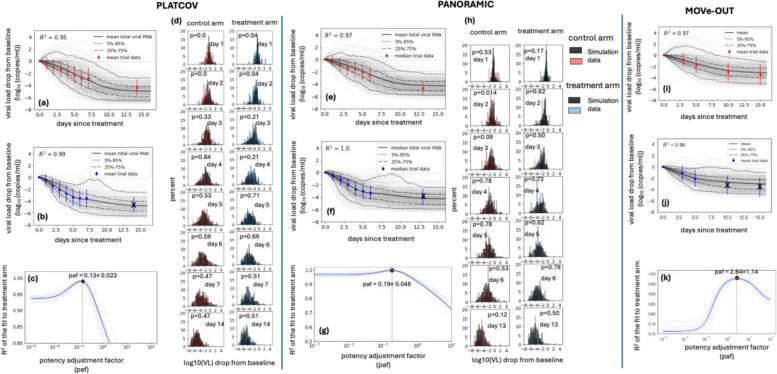
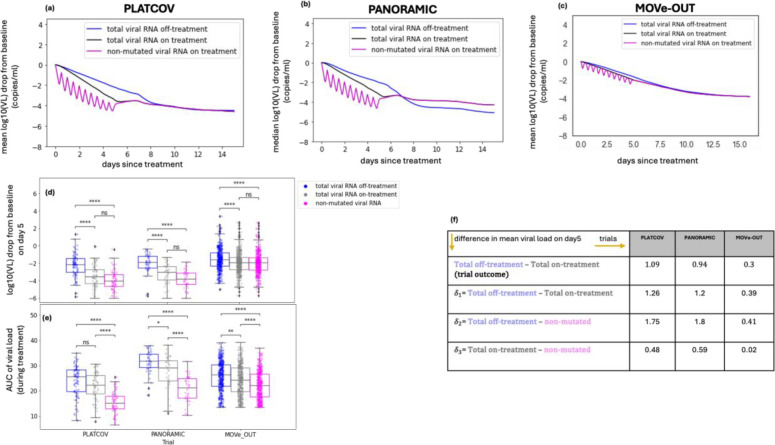
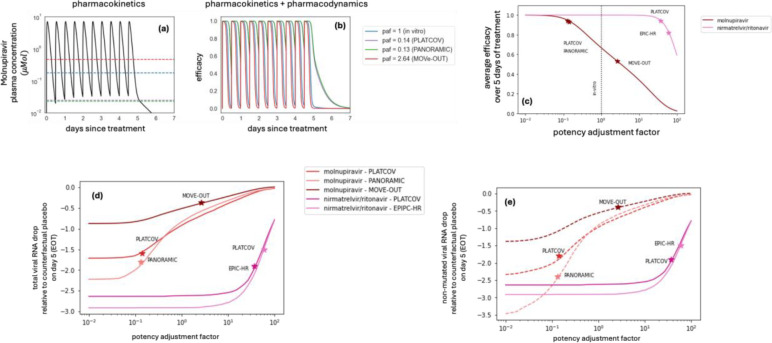
Molnupiravir is an antiviral medicine that induces lethal copying errors during SARS-CoV-2 RNA replication. Molnupiravir reduced hospitalization in one pivotal trial by 50% and had variable effects on reducing viral RNA levels in three separate trials. We used mathematical models to simulate these trials and closely recapitulated their virologic outcomes. Model simulations suggest lower antiviral potency against pre-omicron SARS-CoV-2 variants than against omicron. We estimate that in vitro assays underestimate in vivo potency 7-8 fold against omicron variants. Our model suggests that because polymerase chain reaction detects molnupiravir mutated variants, the true reduction in non-mutated viral RNA is underestimated by ~0.5 log10 in the two trials conducted while omicron variants dominated. Viral area under the curve estimates differ significantly between non-mutated and mutated viral RNA. Our results reinforce past work suggesting that in vitro assays are unreliable for estimating in vivo antiviral drug potency and suggest that virologic endpoints for respiratory virus clinical trials should be catered to the drug mechanism of action.


Figures

Fig 1.
Fig 1.. Schematic of the viral dynamic model and molnupiravir PK-PD model.
(a) In the viral dynamic model, S represents the susceptible cells, IE is the eclipse infected cells, IP is the productively infected cells, V is the non-mutated viruses, and Vm is the mutated viruses as a result of treatment. The productively infected cells are cleared by early and late T cell-mediated immune response at rates δ and m(t). β is the infectivity rate, ϕ is the rate of conversion of susceptible cells to refractory cells, and ρ is the rate of reversion of the refractory cells to susceptible cells. productively infected cells produce viruses at the rate π, and free viruses are cleared at the rate γ. (b) Two-compartmental PK model with oral administration of the drug which models the amounts of the drug in gut tissue AGI, plasma AP, and the respiratory tract AL.κa is the rate of absorption of the drug from gut to plasma, κPL and κLP are the rates of transfer of the drug from plasma to the respiratory tract and back, and κCL is the rate at which the drug clears from the body. Vol is the estimated plasma volume and CP is the concentration of the drug in plasma. ϵCP is the efficacy of the drug in converting produced viruses into mutated viruses.
Fig 2.
Fig 2.. Mathematical model fits of SARS-CoV-2 viral load over time to a subset of study participants in PLATCOV and PANORAMIC receiving no treatment (control) or molnupiravir.
(a) Model fits to 9 control and 9 treatment participants in PLATCOV. (b) Model fits to 9 control and 9 treatment participants in PANORAMIC. (c) Individual estimates for potency adjustment factor (ratio of in vivo : in vitro EC50) in the two trials (center line, median; box limits, upper and lower quartiles; whiskers, 1.5x interquartile range). The statistical comparison was performed using Mann-Whitney U-test.
Figure 3.
Figure 3.. Mean viral load reduction in three trials which are targets for model fitting:
(a) PLATCOV, including individuals with no prior risk factor infected by omicron variant, and enrolled within 96 hours of symptom onset, (b) PANORAMIC, including individuals with prior risk factor infected by omicron variant, and enrolled on average 2.5 days since symptom onset, and (c) MOVe-OUT, including high-risk, unvaccinated individuals, infected by delta, mu, and gamma variants, and enrolled within five days of symptom onset.
Figure 4.
Figure 4.. Model fit to virologic trial outcomes for (a-d) PLATCOV, (e-h) PANORAMIC, (i-k) MOVe-OUT.
Results include (a, e, i) control groups, (b, f, j) treatment groups, (d,h) comparing individual variability of data vs simulation in control and treatment arms, and (c, g, k) estimate for potency adjustment factor. To only capture the effect of treatment and address potential identifiability issues, data from the first seven days after baseline were used to estimate the paf. Therefore, the crossed-out data points were not included in the calculation of the R2.
Figure 5.
Figure 5.. PCR underestimates the true reduction in non-mutated SARS-CoV-2 RNA in PLATCOV and PANORAMIC.
Simulated mean viral loads including non-mutated viral RNA in (a) PLATCOV, (b) PANORAMIC and (c) MOVe-OUT. (d) Individual reduction at day 5 in the simulated control group (blue), simulated total viral RNA (grey) and simulated non-mutated viral RNA (pink) in the three trials showing no statistical difference between total and non-mutated viral RNA despite a lower median. (e) Individual viral area under the curve from the start of the treatment through day 5 in the simulated control group (blue), simulated total viral RNA (grey), and simulated non-mutated viral RNA (pink) in the three trials showing a statistical difference between total and non-mutated viral RNA. Boxplots include the interquartile range (IQR) with whiskers equaling 1.5 the IQR. (f) Table of mean viral load reductions in the trials and simulations including the predicted mean difference in total versus mutated viral RNA.
Figure 6.
Figure 6.. Relationship of drug pharmacokinetics and pharmacodynamics to in vivo potency and viral load reduction, comparing trial design.
(a) Molnupiravir plasma concentration during five days of treatment with 800 mg molnupirvir given twice daily. The dashed lines mark the EC50 with different paf values which differ by trial. For paf = 0.13, drug levels are almost entirely above the EC50. (b) Dynamic shifts in molnupiravir efficacy for different paf values which differ by trial. Efficacy only drops minimally at trough levels when paf is low (i.e. 0.14 and 0.13 in PLATCOV and PANORAMIC) but drops significantly at trough levels in MOVe-OUT. (c) Drug potency of SARS-CoV-2 antivirals according to trial. The in-vivo efficacy of molnupiravir in PLATCOV and PANORAMIC trials is close to the in vivo efficacy of nirmatrelvir/ritonavir in the PLATCOV trial and higher than EPIC-HR. MOVe-OUT potency is significantly lower due to a higher paf and higher in vivo EC50 value. (d) Simulated mean drops in total viral RNA from baseline relative to counterfactual placebo/usual care arms on day 5 in the three molnupiravir trials and two nirmatrelvir/ritonavir trials. (e) Simulated mean drops in non-mutated viral RNA from baseline relative to counterfactual placebo on day 5 in the three molnupiravir trials and two nirmatrelvir/ritonavir trials. In the molnupiravir trials, total viral RNA drops less than non-mutated viral RNA due to PCR detection of drug-mutated viral RNA. Total possible reduction in non-mutated SARS-CoV-2 RNA is less for MOVe-OUT than PLATCOV and PANORAMIC due to higher initial viral loads and lower values of detection in the trials.

Similar articles

References

    1. Abdelnabi R, Foo CS, De Jonghe S, Maes P, Weynand B, Neyts J. Molnupiravir Inhibits Replication of the Emerging SARS-CoV-2 Variants of Concern in a Hamster Infection Model. J Infect Dis. 2021;224(5):749–53. doi: 10.1093/infdis/jiab361. - DOI - PMC - PubMed
    1. Jayk Bernal A, Gomes da Silva MM, Musungaie DB, Kovalchuk E, Gonzalez A, Delos Reyes V, Martín-Quirós A, Caraco Y, Williams-Diaz A, Brown ML, Du J, Pedley A, Assaid C, Strizki J, Grobler JA, Shamsuddin HH, Tipping R, Wan H, Paschke A, ..., Group M-OS. Molnupiravir for Oral Treatment of Covid-19 in Nonhospitalized Patients. N Engl J Med. 2022;386(6):509–20. doi: 10.1056/NEJMoa2116044. - DOI - PMC - PubMed
    1. Butler CC, Hobbs FDR, Gbinigie OA, Rahman NM, Hayward G, Richards DB, Dorward J, Lowe DM, Standing JF, Breuer J, Khoo S, Petrou S, Hood K, Nguyen-Van-Tam JS, Patel MG, Saville BR, Marion J, Ogburn E, Allen J, ..., Group PTC. Molnupiravir plus usual care versus usual care alone as early treatment for adults with COVID-19 at increased risk of adverse outcomes (PANORAMIC): an open-label, platform-adaptive randomised controlled trial. Lancet. 2023;401(10373):281–93. doi: 10.1016/S0140-6736(22)02597-1. - DOI - PMC - PubMed
    1. Schilling WHK, Jittamala P, Watson JA, Boyd S, Luvira V, Siripoon T, Ngamprasertchai T, Batty EM, Cruz C, Callery JJ, Singh S, Saroj M, Kruabkontho V, Ngernseng T, Tanglakmankhong N, Tubprasert J, Abdad MY, Madmanee W, Kouhathong J, ..., Group PC. Antiviral efficacy of molnupiravir versus ritonavir-boosted nirmatrelvir in patients with early symptomatic COVID-19 (PLATCOV): an open-label, phase 2, randomised, controlled, adaptive trial. Lancet Infect Dis. 2024;24(1):36–45. doi: 10.1016/S1473-3099(23)00493-0. - DOI - PMC - PubMed
    1. Hammond J, Leister-Tebbe H, Gardner A, Abreu P, Bao W, Wisemandle W, Baniecki M, Hendrick VM, Damle B, Simón-Campos A, Pypstra R, Rusnak JM, Investigators E-H. Oral Nirmatrelvir for High-Risk, Nonhospitalized Adults with Covid-19. N Engl J Med. 2022;386(15):1397–408. doi: 10.1056/NEJMoa2118542. - DOI - PMC - PubMed

Publication types

LinkOut - more resources