

This is a preprint.
Multi-Omics Analysis for Identifying Cell-Type-Specific Druggable Targets in Alzheimer's Disease
- PMID: 39830273
- PMCID: PMC11741481
- DOI: 10.1101/2025.01.08.25320199
Multi-Omics Analysis for Identifying Cell-Type-Specific Druggable Targets in Alzheimer's Disease
Update in
-
Multi-omics analysis for identifying cell-type-specific and bulk-level druggable targets in Alzheimer's disease.J Transl Med. 2025 Jul 13;23(1):788. doi: 10.1186/s12967-025-06739-1. J Transl Med. 2025. PMID: 40653482 Free PMC article.
Abstract
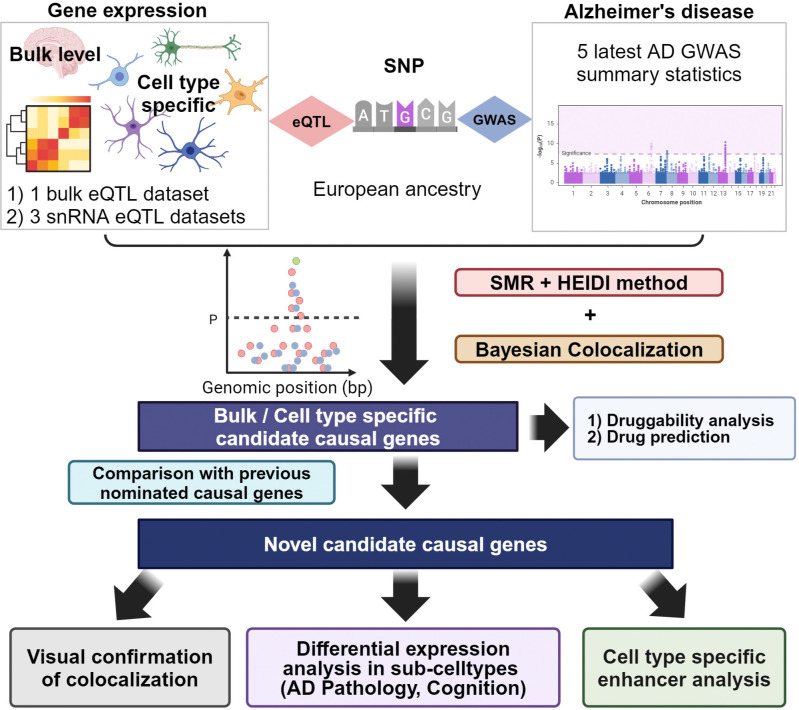
Background: Analyzing disease-linked genetic variants via expression quantitative trait loci (eQTLs) is important for identifying potential disease-causing genes. Previous research prioritized genes by integrating Genome-Wide Association Study (GWAS) results with tissue-level eQTLs. Recent studies have explored brain cell type-specific eQTLs, but they lack a systematic analysis across various Alzheimer's disease (AD) GWAS datasets, nor did they compare effects between tissue and cell type levels or across different cell type-specific eQTL datasets. In this study, we integrated brain cell type-specific eQTL datasets with AD GWAS datasets to identify potential causal genes at the cell type level.
Methods: To prioritize disease-causing genes, we used Summary Data-Based Mendelian Randomization (SMR) and Bayesian Colocalization (COLOC) to integrate AD GWAS summary statistics with cell-type-specific eQTLs. Combining data from five AD GWAS, three single-cell eQTL datasets, and one bulk tissue eQTL meta-analysis, we identified and confirmed both novel and known candidate causal genes. We investigated gene regulation through enhancer activity using H3K27ac and ATAC-seq data, performed protein-protein interaction and pathway enrichment analyses, and conducted a drug/compound enrichment analysis with the Drug Signatures Database (DSigDB) to support drug repurposing for AD.
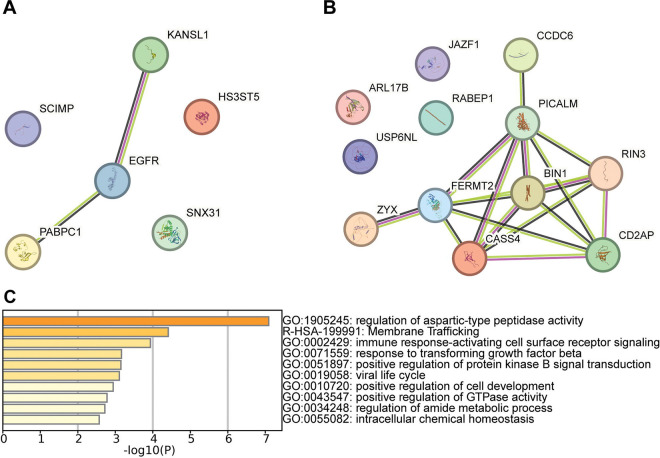
Results: We identified 27 candidate causal genes for AD using cell type-specific eQTL datasets, with the highest numbers in microglia, followed by excitatory neurons, astrocytes, inhibitory neurons, oligodendrocytes, and oligodendrocyte precursor cells (OPCs). PABPC1 emerged as a novel astrocyte-specific gene. Our analysis revealed protein-protein interaction (PPI) networks for these causal genes in microglia and astrocytes. We found the "regulation of aspartic-type peptidase activity" pathway being the most enriched among all the causal genes. AD-risk variants associated with candidate causal gene PABPC1 is located near or within enhancers only active in astrocytes. We classified the genes into three drug tiers and identified druggable interactions, with imatinib mesylate emerging as a key candidate. A drug-target gene network was created to explore potential drug targets for AD.
Conclusions: We systematically prioritized AD candidate causal genes based on cell type-specific molecular evidence. The integrative approach enhances our understanding of molecular mechanisms of AD-related genetic variants and facilitates the interpretation of AD GWAS results.
Keywords: Alzheimer’s disease; Causal genes; GWAS; Gene expression; SNP; astrocytes; cell type; drug repurposing; eQTL; genetic variant.
Conflict of interest statement
Competing interests A.S. has received support from Avid Radiopharmaceuticals, a subsidiary of Eli Lilly (in kind contribution of PET tracer precursor) and participated in Scientific Advisory Boards (Bayer Oncology, Eisai, Novo Nordisk, and Siemens Medical Solutions USA, Inc) and an Observational Study Monitoring Board (MESA, NIH NHLBI), as well as several other NIA External Advisory Committees. He also serves as Editor-in-Chief of Brain Imaging and Behavior, a Springer-Nature Journal. S. L., T. R., P. B., D. C., D. B., N. T., K. N., S. C., M. C., Y. H., and T. P. have no interest to declare. The funders had no role in the study’s design, the collection, analyses, or interpretation of data, the writing of the manuscript, or the decision to publish the results.
Figures


References
-
- Tanzi RE, Bertram L. New Frontiers in Alzheimer’s Disease Genetics. Neuron. 2001;32(2):181–4. - PubMed
-
- Corder EH, Saunders AM, Strittmatter WJ, Schmechel DE, Gaskell PC, Small GW, et al. Gene Dose of Apolipoprotein E Type 4 Allele and the Risk of Alzheimer’s Disease in Late Onset Families. Science. 1993;261(5123):921–3. - PubMed
Publication types
Grants and funding
- P30 AG072975/AG/NIA NIH HHS/United States
- T32 AG071444/AG/NIA NIH HHS/United States
- R01 AG019771/AG/NIA NIH HHS/United States
- R37 AG057739/AG/NIA NIH HHS/United States
- U19 AG074879/AG/NIA NIH HHS/United States
- U01 AG068057/AG/NIA NIH HHS/United States
- U19 AG024904/AG/NIA NIH HHS/United States
- U01 MH116487/MH/NIMH NIH HHS/United States
- P30 AG072976/AG/NIA NIH HHS/United States
- R01 LM013463/LM/NLM NIH HHS/United States
- U01 AG072177/AG/NIA NIH HHS/United States
- P30 AG010133/AG/NIA NIH HHS/United States
- R01 AG057739/AG/NIA NIH HHS/United States
- R01 AG068193/AG/NIA NIH HHS/United States
- R01 LM012535/LM/NLM NIH HHS/United States
LinkOut - more resources
Full Text Sources