

Temporal Trends in Parkinson's Disease Related Mortality from 1999-2020: A National Analysis
- PMID: 39830305
- PMCID: PMC11739699
- DOI: 10.3310/nihropenres.13623.1
Temporal Trends in Parkinson's Disease Related Mortality from 1999-2020: A National Analysis
Abstract
Introduction: Parkinson's disease (PD) is the most common neurodegenerative movement disorder and is associated with significant disability. The prevalence is rising, and studies have reported potential sex and race disparities in patient outcomes. Data about the demographic trends in PD-related mortality in the United States (US) is limited. This descriptive study aimed to report the national demographic trends in PD-related mortality over a 20-year period.
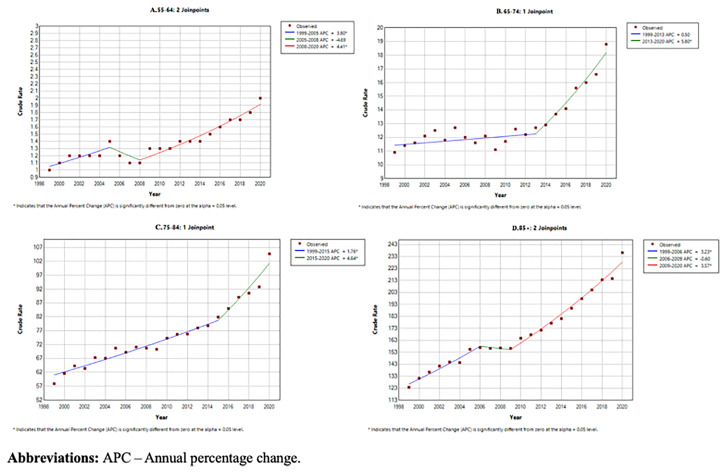
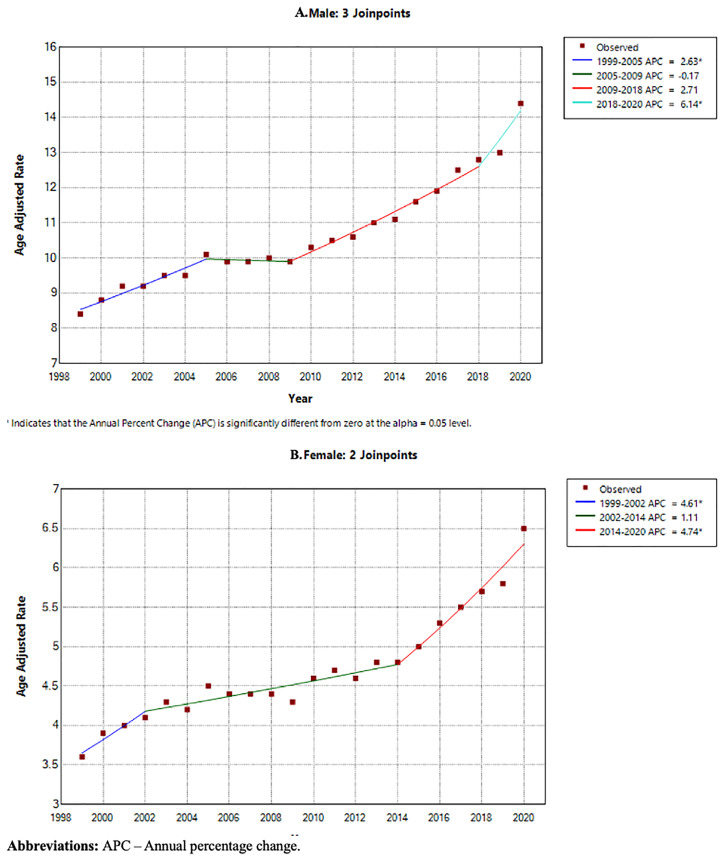
Methods: The US Centers for Disease Control and Prevention Wide-Ranging Online Data for Epidemiological Research (CDC-WONDER) Underlying Cause of Death database from January 1999 to December 2020 was used to determine the PD-related age adjusted mortality rate (AAMR) stratified by age, sex, ethnicity and geographic area, with the 1999 deaths as the reference group. Annual percentage change (APC) for AAMR was then calculated using Joinpoint regression.
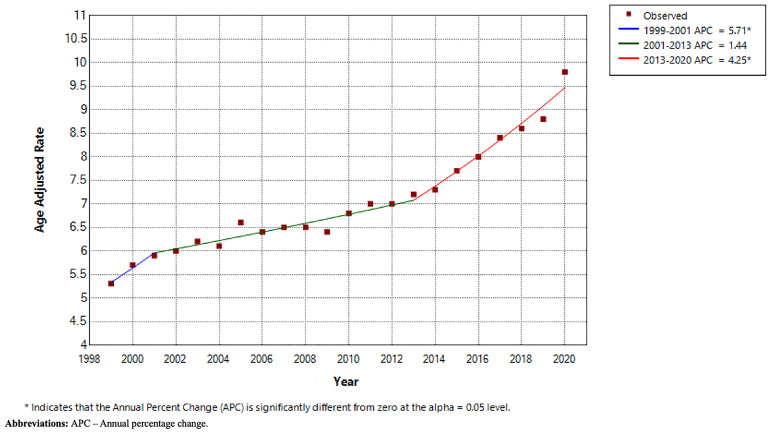
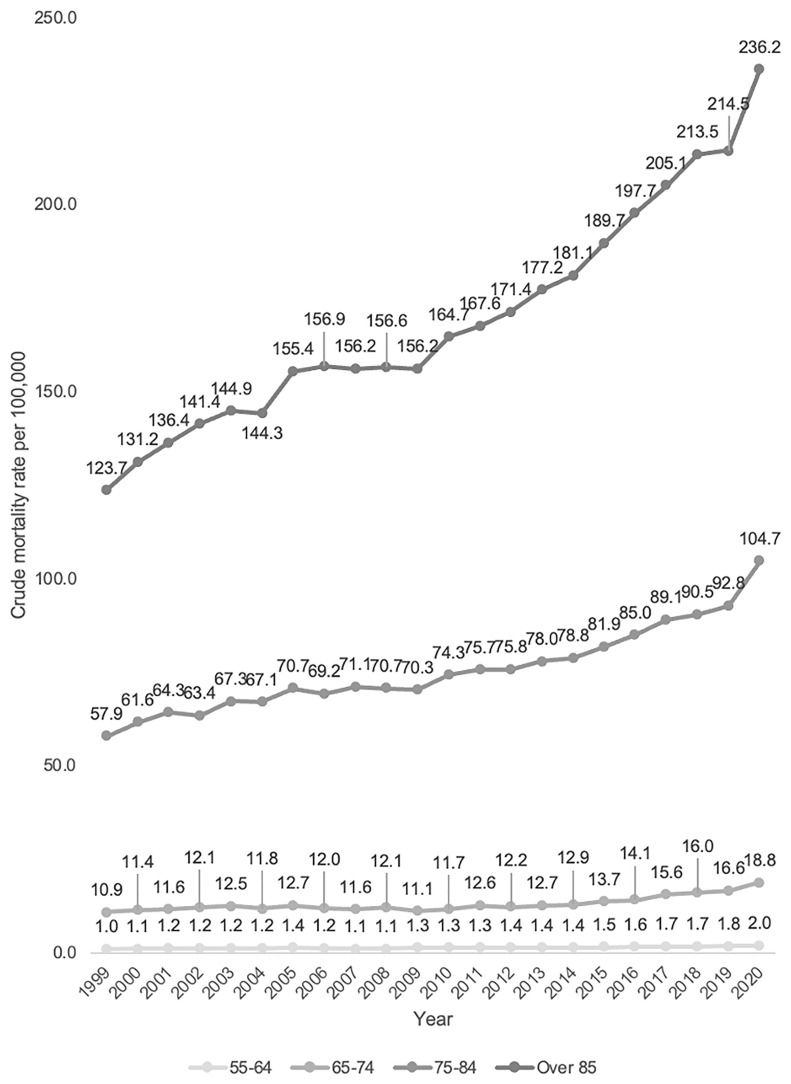
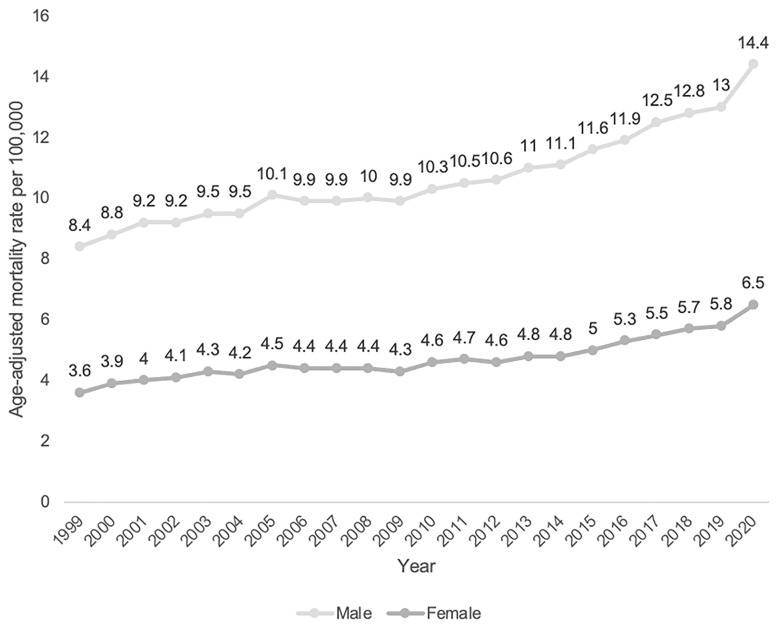
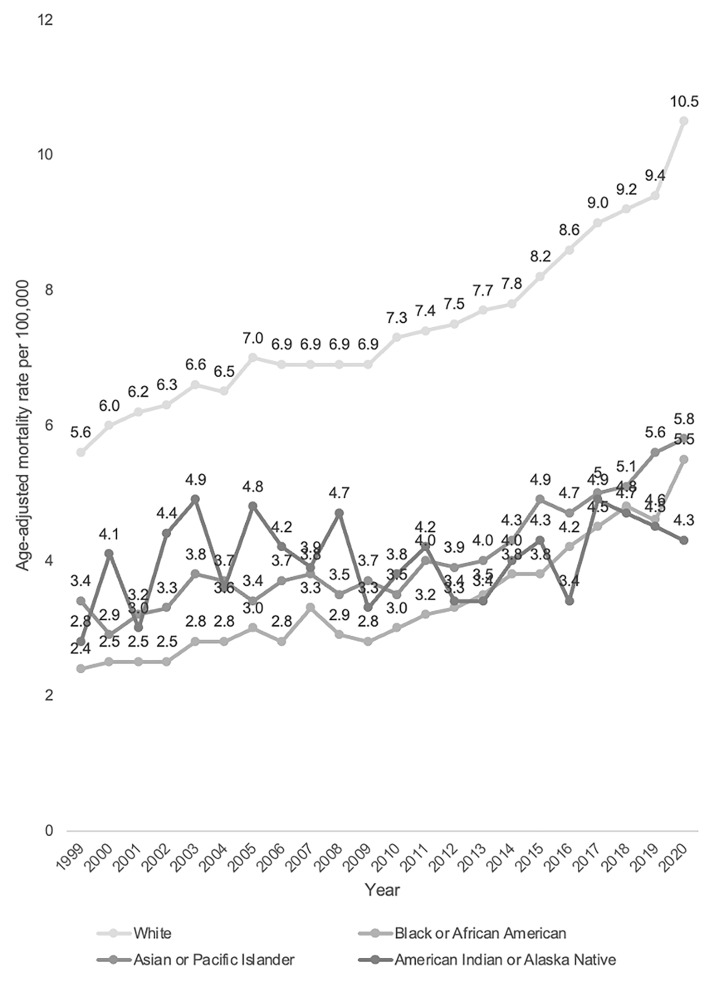
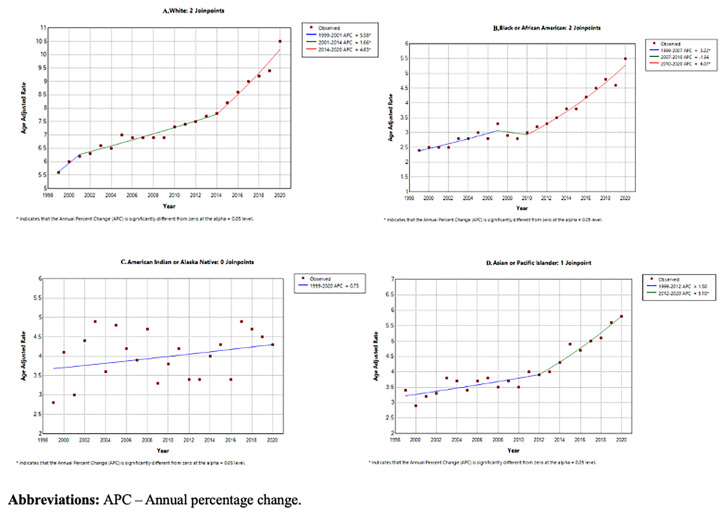
Results: There were 515,884 PD-related deaths in the study period. The AAMR increased from 5.3 per 100,000 population in 1999 to 9.8 per 100,000 in 2020. Males had consistently higher AAMR than females and white race had consistently higher overall AAMR (7.6 per 100,000), followed by American Indians/Alaska Natives (4.4 per 100,000), Asians/Pacific Islanders (4.1 per 100,000) and Black/African Americans (3.4 per 100,000). The Midwest had the highest AAMR followed by West, South and Northeast. Utah, Idaho and Minnesota had the highest state-level AAMR.
Conclusions: This study identified significant age, sex, race and geographic disparities in PD-related mortality in the US. Older age, male sex, white race and Midwest locality were associated with the highest AAMR.
Keywords: Parkinson’s Disease; Mortality; Outcomes; Epidemiology..
Plain language summary
Parkinson's disease (PD) is a common disease that impacts the brain and as a result, movement. One in 37 people will be diagnosed with PD in their lifetime, and the risk of developing PD increases with age. PD can lead to variety of complications such as falls, depression, and death. This research aimed to summarise the demographic trends in PD-related death in the United States from 1999–2020 using death certificate data. There were 515,884 PD-related deaths in the study period. Death rates increased from 5.3 per 100,000 population in 1999 to 9.8 per 100,000 in 2020. In terms of demographics, firstly, male sex had a higher rate than female sex. Secondly, white race had death rate than American Indians/Alaska Natives, Asians/Pacific Islanders and Black/African Americans, Finally, the Midwest had a higher death rate than the West, South and Northeast. These results could be because PD is more common in these groups. Future research could investigate underlying reasons behind disparities in mortality. In summary, PD is a significant cause of death in the US and there are differences in demographic trends in PD-related deaths. The number of deaths from PD per population count is higher with older ages, in males, people of white race and in the Midwest. Knowledge of these trends is important to build healthcare services around this growing population.
Copyright: © 2024 Sokhal BS et al.
Conflict of interest statement
No competing interests were disclosed.
Figures
Similar articles
-
Temporal trends in Parkinson's disease among older adults in the United States from 1999 to 2020: Retrospective analysis from CDC WONDER database.Parkinsonism Relat Disord. 2024 Oct;127:107110. doi: 10.1016/j.parkreldis.2024.107110. Epub 2024 Aug 18. Parkinsonism Relat Disord. 2024. PMID: 39180966
-
Trends and disparities in cardiac implantable electronic device infection-related mortality in the United States.J Cardiovasc Electrophysiol. 2024 Jul;35(7):1487-1489. doi: 10.1111/jce.16298. Epub 2024 May 9. J Cardiovasc Electrophysiol. 2024. PMID: 38725220
-
Temporal trends in hypertension related end stage renal disease mortality rates: an analysis of gender, race/ethnicity, and geographic disparities in the United States.Front Nephrol. 2024 Jan 15;3:1339312. doi: 10.3389/fneph.2023.1339312. eCollection 2023. Front Nephrol. 2024. PMID: 38288382 Free PMC article.
-
Demographics and Trends of Hypertrophic Cardiomyopathy-Related Mortality in the United States, 1999-2020.Curr Probl Cardiol. 2023 Jul;48(7):101681. doi: 10.1016/j.cpcardiol.2023.101681. Epub 2023 Mar 10. Curr Probl Cardiol. 2023. PMID: 36906160 Review.
-
The hidden epidemic: Hypertension-related mortality surges amongst younger adults in the United States.Curr Probl Cardiol. 2024 Dec;49(12):102842. doi: 10.1016/j.cpcardiol.2024.102842. Epub 2024 Sep 12. Curr Probl Cardiol. 2024. PMID: 39270766 Review.
Cited by
-
Trends in Mortality Due to Cardiovascular Diseases Among Patients With Parkinson's Disease in the United States: A Retrospective Analysis.Clin Cardiol. 2025 Jan;48(1):e70079. doi: 10.1002/clc.70079. Clin Cardiol. 2025. PMID: 39817587 Free PMC article.
References
LinkOut - more resources
Full Text Sources