

Decarceration and COVID-19 infections in U.S. Immigration and Customs Enforcement detention facilities: a simulation modeling study
- PMID: 39830893
- PMCID: PMC11741939
- DOI: 10.1016/j.lana.2024.100971
Decarceration and COVID-19 infections in U.S. Immigration and Customs Enforcement detention facilities: a simulation modeling study
Abstract
Background: U.S. Immigration and Customs Enforcement (ICE) facilities had high rates of COVID-19 infections and mortality during the global pandemic. We sought to quantify how many COVID-19 infections could have been averted through different decarceration strategies.
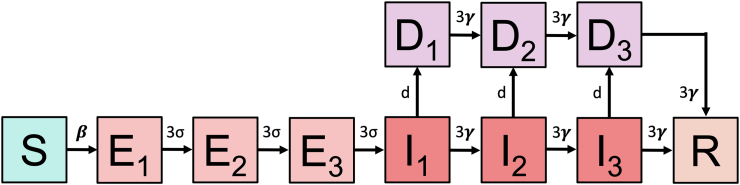
Methods: We developed a set of stochastic simulation models of SARS-CoV-2 transmission in ICE facilities. Employing incremental mixture importance sampling (IMIS), we calibrated them to empirical targets derived from publicly available case time series for ICE facilities, and publicly available facility population censuses prior to vaccine availability (May 6, 2020 to December 31, 2020). The models included infection importation from extra-facility sources. We evaluated reduction of the incarcerated population by 10-90%. People who were decarcerated faced background cumulative risks of infection and detection based on a weighted average of county-level estimates from the covidestim model, which is a Bayesian evidence synthesis model.
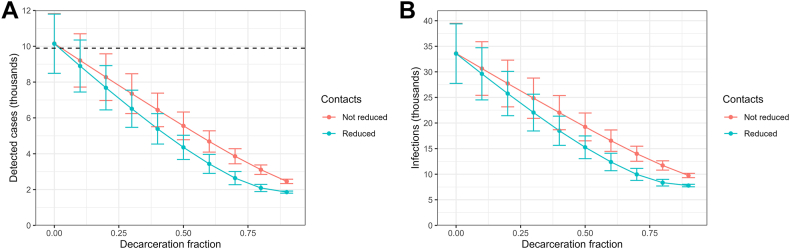
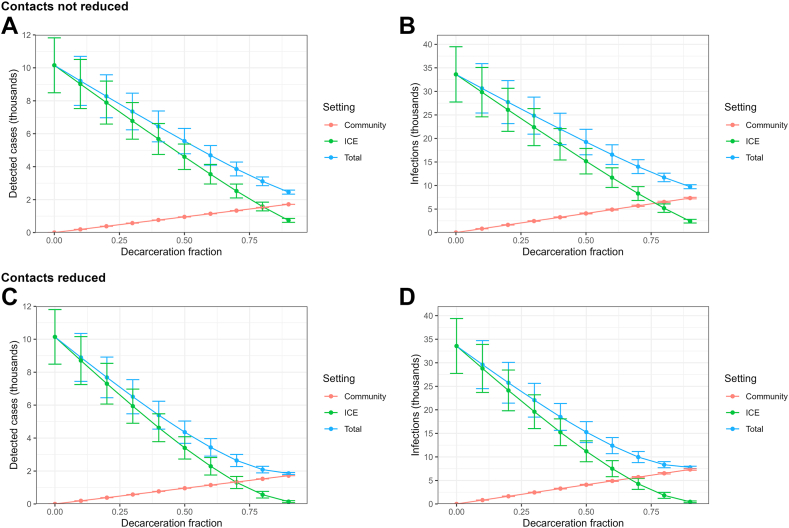
Findings: Without decarceration, the infection rate was 5.05 per 1000 person-days (95% CrI 3.40-6.81) and case rate was 1.53 per 1000 person-days (95% CrI 1.04-2.02). Rates declined linearly when decarceration did not reduce contacts of people remaining in facilities and faster than linearly when it did reduce contacts. At all decarceration levels, rates were substantially higher when contacts were not reduced. Even with 90% decarceration, infection rates for people remaining in facilities were higher than or comparable to otherwise similar free-living people.
Interpretation: The decline in COVID-19 infection rates with decarceration was linear or faster than linear depending on how decarceration was implemented. Our findings highlight infection risks associated with incarceration, which compound other health harms of incarceration.
Funding: Stanford's COVID-19 Emergency Response Fund; the National Institute on Drug Abuse; and the National Institute of Mental Health.
Keywords: COVID-19; Immigration detention; Incarceration; Simulation modeling.
© 2024 The Author(s).
Conflict of interest statement
None of the authors have competing conflicts of interest to declare.
Figures
References
-
- Shoichet C. 2020. Doctors warn of ‘tinderbox scenario’ if coronavirus spreads in ICE detention.https://www.cnn.com/2020/03/20/health/doctors-ice-detention-coronavirus/...
-
- Global Detention Project . 2020. Overview immigration detainees.https://www.globaldetentionproject.org/countries/americas/united-states
-
- Widra E., Herring T. 2021. States of incarceration: the global context 2021.https://www.prisonpolicy.org/global/2021.html
Grants and funding
LinkOut - more resources
Full Text Sources
Miscellaneous
