. 2025 Jan 19;13(1):e4694.
doi: 10.1002/fsn3.4694. eCollection 2025 Jan.

Ellagic Acid Modulates Necroptosis, Autophagy, Inflammations, and Stress to Ameliorate Nonalcoholic Liver Fatty Disease in a Rat Model

Affiliations

Ellagic Acid Modulates Necroptosis, Autophagy, Inflammations, and Stress to Ameliorate Nonalcoholic Liver Fatty Disease in a Rat Model

Zhuoheng Li et al. Food Sci Nutr. .

Abstract

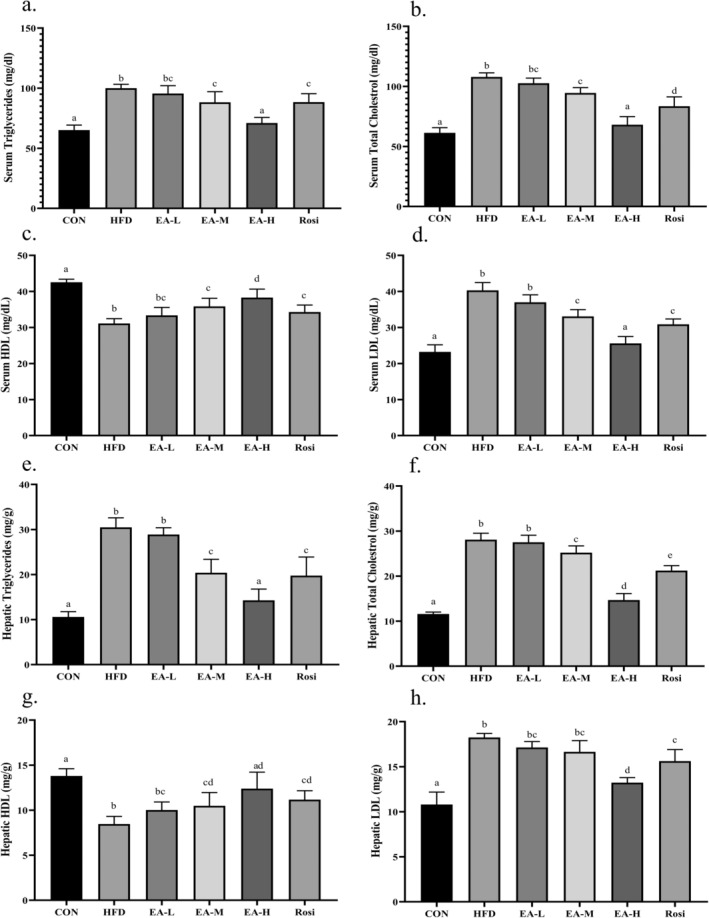
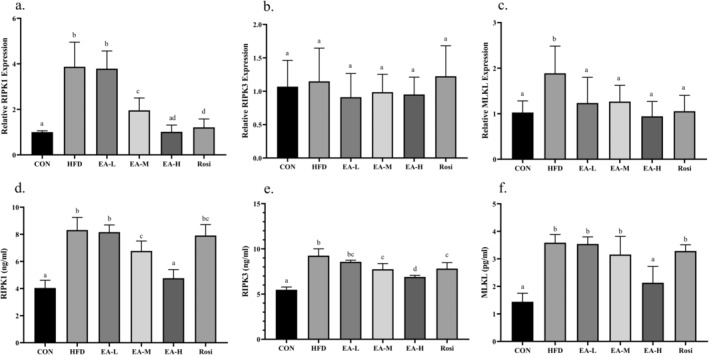
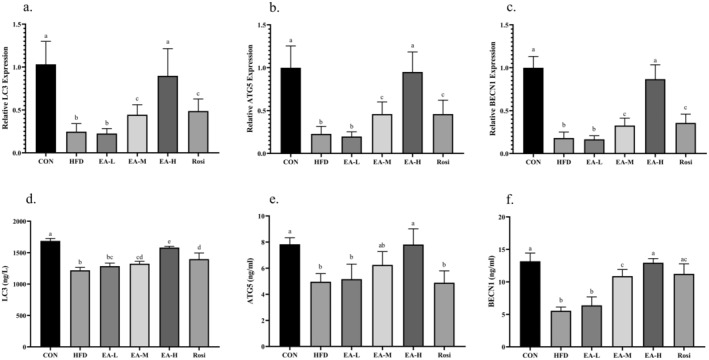
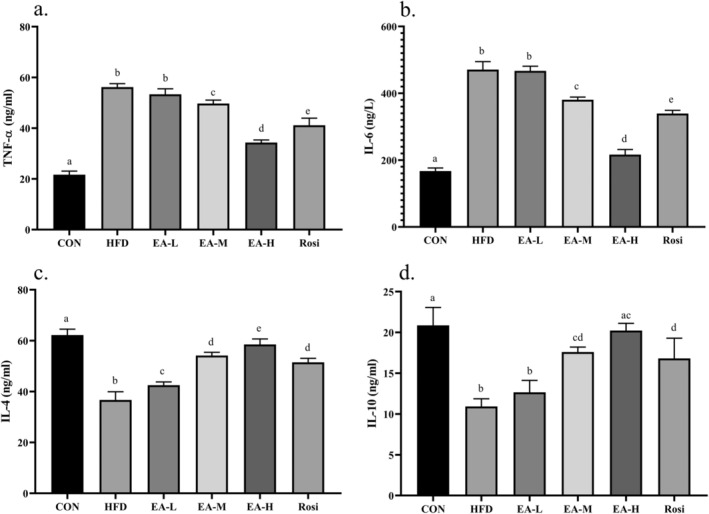
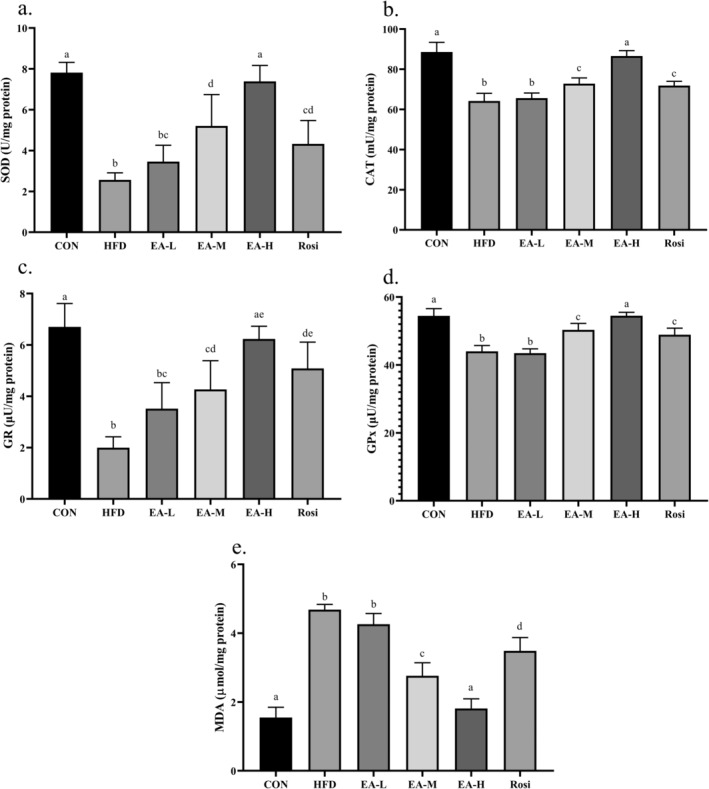
Nonalcoholic fatty liver disease (NAFLD) is considered one of the most common metabolic disorders worldwide. Although the pathoetiology of NAFLD is not fully elucidated, recent evidence suggests the involvement of stress, inflammation, and programmed death in the onset and progression of the disease. This investigation aimed to evaluate the effects of ellagic acid (EA), a known herbal antioxidant, on a high-fat diet (HFD)-induced animal model of NAFLD by evaluating the status of lipid profile, necroptosis (RIPK1, RIPK3, and MLKL), autophagy (LC3, ATG5, and BECN1), inflammation (TNF-α, IL-6, IL-4, and IL-10), and stress (SOD, CAT, GR, GPx, and MDA). In this regard, rats were randomly divided into 6 groups as follows: normal diet controls, HFD (supplemented with high caloric diet model), EA low dose (HFD and 10 mg/kg/day EA), EA middle dose (HFD and 25 mg/kg/day EA), EA high dose (HFD and 50 mg/kg/day EA), and Rosiglitazone (HFD and 10 mg/kg/day Rosi). After the treatment, the levels of markers related to necroptosis and autophagy in the liver tissue as well as the lipid profiles, inflammation, and oxidative stress status were analyzed. It was shown that the dose of EA was able to improve the weight gain and lipid profile when compared to NAFLD animals (p-value < 0.001). Moreover, EA increased the level of LC3 and ATG5 while decreasing BECN 1, RIPK1, RIPK3, and MLKL compared to the HFD-induced NAFLD rats (p-value < 0.05). TNF-α and IL-6 were decreased after EA administration, whereas IL-4 and IL-10 levels were increased (p-value < 0.001). Furthermore, the increase in the activity of SOD, CAT, GR, and GPx along with the decrease in MDA levels indicated the suppression of oxidative stress by EA treatment compared to the NAFLD rats (p-value < 0.0001). The current findings may suggest that EA improves NAFLD via modulation of necroptosis, autophagy, inflammation, and stress.

Keywords: NAFLD; autophagy; ellagic acid; metabolism; necroptosis.


Conflict of interest statement

The authors declare no conflicts of interest.

Figures

FIGURE 1
FIGURE 1
Physical analysis. Total body weight (a), weight gain (b), and the weight of liver tissue (c) in animals with NAFLD were significantly higher than controls. However, the administration of a high dose of EA significantly restored the physical parameters of rats with NAFLD. The statistical analysis results are shown by lowercase letters on the bars, where different letters stand for significant differences between groups (a: Significant difference with b, c, d, e. b: Significant difference with c, d, e. c: Significant difference with d, e. d: Significant difference with e. e: Significant difference with f. bc: Significant difference with a, de, e. cd: Significant difference with a, e. de: Significant difference with bc, a.); a p‐value < 0.05 was described as significant.
FIGURE 2
FIGURE 2
Lipid profile analysis in the serum and hepatic tissue. The levels of TG (a and e, respectively), TC (b and f, respectively), HDL (c and g, respectively), and LDL (d and h, respectively) in the serum and hepatic tissue of NAFLD animals were ameliorated after the administration of EA. The statistical analysis results are shown by lowercase letters on the bars, where different letters stand for significant differences between groups, where different letters indicate significant differences between groups (a: Significant difference with b, bc, c, d, e, cd. b: Significant difference with c, d, e, ad, cd. c: Significant difference with d, e. d: Significant difference with bc, e. e: Significant difference with bc, ad, cd, bc: Significant difference with a, d. cd: Significant difference with a, b, ad: Significant difference with b, c); a p‐value < 0.05 was described as significant.
FIGURE 3
FIGURE 3
The histological analysis of liver tissue. The findings showed that in control (a), intact hepatic lobular architecture with normal morphology existed. The liver of HFD animals (b) represented marked micro and macro steatotic alterations and moderate interlobular inflammation. Although the administration of low (c) and medium (d) doses of EA and the administration of Rosi (f) had a slight improvement effect on the histological characteristics of liver specimens, high doses of EA (e) had appropriately preserved the morphological appearance of the liver tissue. CV: Central vein; I: Inflammation; FD: Fatty degeneration due to steatosis and ballooning of hepatocytes; +: Mild; ++: Moderate; +++: Severe.
FIGURE 4
FIGURE 4
EA suppressed necroptosis in hepatic tissue. The gene expression and protein levels of RIPK1 (a and d, respectively), RIPK3 (b and e, respectively), and MLKL (c and f, respectively) were measured. The statistical analysis results are shown by lowercase letters on the bars, where different letters stand for significant differences between groups, where different letters indicate significant differences between groups (a: Significant difference with b, c, d, bc. b: Significant difference with c, d, ad. c: Significant difference with ad. d: Significant difference with bc. ad: Significant difference with b, c. bc: Significant difference with a, d); a p‐value < 0.05 was described as significant.
FIGURE 5
FIGURE 5
The analysis of autophagic markers in the hepatic tissue. The gene expression and protein levels of LC3 (a and d, respectively), ATG5 (b and e, respectively), and BECN1 (c and f, respectively) were determined using RT‐qPCR and ELISA techniques. The statistical analysis results are shown by lowercase letters on the bars, where different letters stand for significant differences between groups, where different letters indicate significant differences between groups (a: Significant difference with b, c, bc. b: Significant difference with c. c: Significant difference with ab. ab: Significant difference with c, d. bc: Significant difference with a, d); a p‐value < 0.05 was described as significant.
FIGURE 6
FIGURE 6
EA inhibited inflammation in NAFLD animals. The findings revealed that EA significantly decreased the levels of proinflammatory cytokines including TNF‐α (a) and IL‐6 (b) while increasing the levels of anti‐inflammatory cytokines, IL‐4 (c) and IL‐10 (d). The statistical analysis results are shown by lowercase letters on the bars, where different letters stand for significant differences between groups, where different letters indicate significant differences between groups (a: Significant difference with b, c, d, e, cd. b: Significant difference with c, d, e, cd, ac. c: Significant difference with d, e. d: Significant difference with e, ac. e: Significant difference with ac, cd. ac: Significant difference with b, d. cd: Significant difference with a, b); a p‐value < 0.05 was described as significant.
FIGURE 7
FIGURE 7
Oxidative stress was diminished in the hepatic tissue of NAFLD animals treated with EA. The levels of SOD (a), CAT (b), GR (c), and GPx (d) were increased after administration of EA, whereas the levels of MDA (e) were decreased. The statistical analysis results are shown by lowercase letters on the bars, where different letters stand for significant differences between groups, where different letters indicate significant differences between groups (a: Significant difference with b, c, d, bc, cd, de. b: Significant difference with c, d, e, cd, ae, de. c: Significant difference with d, ae, de. d: Significant difference with ae, bc. bc: Significant difference with a, d, e. cd: Significant difference with a, b, e. ae: Significant difference with b, c, d. de: Significant difference with a, b, c); a p‐value < 0.05 was described as significant.

Similar articles

Cited by

References

    1. Aishwarya, V. , Solaipriya S., and Sivaramakrishnan V.. 2021. “Role of Ellagic Acid for the Prevention and Treatment of Liver Diseases.” Phytotherapy Research 35, no. 6: 2925–2944. - PubMed
    1. Altamimi, J. Z. , Alshammari G. M., AlFaris N. A., et al. 2022. “Ellagic Acid Protects Against Non‐Alcoholic Fatty Liver Disease in Streptozotocin‐Diabetic Rats by Activating AMPK.” Pharmaceutical Biology 60, no. 1: 25–37. - PMC - PubMed
    1. An, L. , Wirth U., Koch D., et al. 2023. “Metabolic Role of Autophagy in the Pathogenesis and Development of NAFLD.” Metabolites 13, no. 1: 101. - PMC - PubMed
    1. Aravinthan, A. , Scarpini C., Tachtatzis P., et al. 2013. “Hepatocyte Senescence Predicts Progression in Non‐alcohol‐Related Fatty Liver Disease.” Journal of Hepatology 58, no. 3: 549–556. - PubMed
    1. Bassal, T. , Basheer M., Boulos M., and Assy N.. 2022. “Nonalcoholic Fatty Liver Disease—A Concise Review of Noninvasive Tests and Biomarkers.” Metabolites 12, no. 11: 1073. - PMC - PubMed

LinkOut - more resources