. 2025 Jan 11;53(2):gkaf011.
doi: 10.1093/nar/gkaf011.

An integrated approach for the accurate detection of HERV-K HML-2 transcription and protein synthesis

Affiliations

An integrated approach for the accurate detection of HERV-K HML-2 transcription and protein synthesis

Charles Gleason et al. Nucleic Acids Res. .

Abstract

Human endogenous retroviruses (HERVs) occupy a large portion of the human genome. Most HERVs are transcriptionally silent, but they can be reactivated during pathological states such as viral infection and certain cancers. The HERV-K HML-2 clade includes elements that recently integrated have in the human germ line and often contain intact open reading frames that possibly support peptide and protein expression. Understanding HERV-K-host interactions and their potential as biomarkers is problematic due to the high similarity among different elements. Previously, we described a long-read single molecule real-time sequencing (PacBio) strategy to analyze HERV-K RNA expression profiles in different cell types. However, identifying HERV-K HML-2 proteins accurately is difficult without robust and reliable methods and reagents. Here we present a new approach to characterize the HML-2 elements that (a) are being translated and (b) produce enough protein to be detected and identified by mass spectrometry. Our data reveal that RNA expression profiling alone cannot accurately predict which HML-2 elements are responsible for protein production, as we observe several differences between the highest expressed RNAs and the elements that are the predominant source of HERV-K HML-2 protein synthesis. These studies represent an important advance toward untangling the complexity of HERV-K-host interactions.


Figures

Graphical Abstract
Graphical Abstract
Figure 1.
Figure 1.
Clade-level HERV expression profile in NCCIT cells obtained by Telescope analysis of RNAseq data. HERV-H and HERV-K (the clade HML-2 belongs to, shown with the second highest bar) are the two major components of the profile.
Figure 2.
Figure 2.
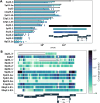
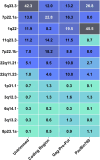
(A) Locus-specific full length HML-2 expression profile as measured by RNASeq differs when looking at untrimmed (all reads), coding region and Gag-Pro-Pol encoding regions. The 5q33.3 locus has the highest expression. With reads mapping to the LTR excluded (coding region), 7p22.1a has the highest number of mapped reads. Looking only at the Gag-Pro-Pol region of each locus, expression levels are similar across all of the top 7 loci. (B) RNAseq read coverage at individual HML-2 loci shows sharp increases and decreases at known splice sites. Coverage is indicated on a log scale, combining reads from three separate runs, with 0 on the x axis for each locus corresponding to the 5′ end of the 5′ LTR. Deletions within the elements (e.g. for Type I loci) are indicated by a gap with double lines.
Figure 3.
Figure 3.
HERV-K HML-2 RNAseq expression profiles of untrimmed, coding region, Gag-Pro-Pol encoding regions and expression profiles based on HML-2 PacBio700 platform, provide equivalent results in identifying 7 out of the 92 possible HML-2 loci expressing >93% of global HML-2 expression.
Figure 4.
Figure 4.
Heatmaps of HERV-K HML-2 expression profiles obtained from the highest sucrose density fractions of polysome fractionation experiments. Expression values are represented as percentage of total HERV-K HML-2 expression. (A) Expression profiles obtained by PacBio700 included both full length and spliced RNA. (B) Expression profiles obtained by PacBio1400 included only spliced HERV-K HML-2 Env transcripts. Expression profiles were comparable in the total RNA and the high-density fractions, with no indication of translational regulation for these HERV-K HML-2 elements. Measured expression of HML-2 11q23.3 is included but cannot be compared across methods as it is not detected efficiently by PacBio700.
Figure 5.
Figure 5.
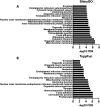
Gene ontology analysis performed using two independent gene product annotation sites, (A) ToppFun (from ToppGene site) and (B) ShinyGO (version 0.77) comparing detection of proteins originating from membrane enriched cell lysates and proteins originating from total cell lysates by MS. Both analyses confirm a significant increase in representation of membrane localized proteins in the cell lysates that have undergone the membrane enrichment procedure.
Figure 6.
Figure 6.
(A) 39 peptides mapped to Gag. Of all the HML-2 loci with detectable expression in NCCIT, 9 elements (HML-2 1q22, 3q12.3, 3q13.2, 5q33.3, 7p22.1a, 7p22.1b, 11q23.3, 22q11.21, 22q11.23) encompassed 93% of RNAseq reads in HML-2 Gag-Pro-Pol encoding regions. (B) Three unique Gag peptides, matching elements HML-2 1q22, 3q13.2 and 22q11.23, were used as anchoring peptides for the matching of 36 ambiguously mapped peptides. (C) Three remaining ambiguously mapped peptides were shared between HML-2 7p22.1a and b, 5q33.3, 11q23.3 and 22q11.21. HML-2 22q11.21 alone matched all three peptides, with no other locus matching more than one unexplained peptide. (D) Expression of these four loci was sufficient to explain all Gag peptide matches (E) Five peptides mapped to Env/Rec. Five HML-2 loci (HML-2 5q33.3, 6q14.1, 7p22.1b, 11q23.3, 22q11.21) accounted for over 99% of Env expression detected by the PacBio 1400 system. Of the five Env matching peptides, three mapped uniquely to HML-2 7p22.1b, and the remaining two mapped to HML-2 7p22.1b, 11q23.3 and 22q11.21. (F) Expression of HML-2 7p22.1b alone was sufficient to explain all 5 peptides.

References

    1. Vargiu L., Rodriguez-Tome P., Sperber G.O., Cadeddu M., Grandi N., Blikstad V., Tramontano E., Blomberg J. Classification and characterization of human endogenous retroviruses; mosaic forms are common. Retrovirology. 2016; 13:7. - PMC - PubMed
    1. Hughes J.F., Coffin J.M. Human endogenous retrovirus K solo-LTR formation and insertional polymorphisms: implications for human and viral evolution. Proc. Natl. Acad. Sci. USA. 2004; 101:1668–1672. - PMC - PubMed
    1. Turelli P., Castro-Diaz N., Marzetta F., Kapopoulou A., Raclot C., Duc J., Tieng V., Quenneville S., Trono D. Interplay of TRIM28 and DNA methylation in controlling human endogenous retroelements. Genome Res. 2014; 24:1260–1270. - PMC - PubMed
    1. Collins P.L., Kyle K.E., Egawa T., Shinkai Y., Oltz E.M. The histone methyltransferase SETDB1 represses endogenous and exogenous retroviruses in B lymphocytes. Proc. Natl. Acad. Sci. USA. 2015; 112:8367–8372. - PMC - PubMed
    1. Cuellar T.L., Herzner A.M., Zhang X., Goyal Y., Watanabe C., Friedman B.A., Janakiraman V., Durinck S., Stinson J., Arnott D. et al. . Silencing of retrotransposons by SETDB1 inhibits the interferon response in acute myeloid leukemia. J. Cell Biol. 2017; 216:3535–3549. - PMC - PubMed

LinkOut - more resources