Single-nucleotide-resolution genomic maps of O6-methylguanine from the glioblastoma drug temozolomide
- PMID: 39831306
- PMCID: PMC11744188
- DOI: 10.1093/nar/gkae1320
Single-nucleotide-resolution genomic maps of O6-methylguanine from the glioblastoma drug temozolomide
Abstract
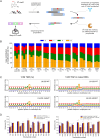
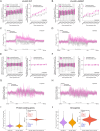
Temozolomide kills cancer cells by forming O6-methylguanine (O6-MeG), which leads to cell cycle arrest and apoptosis. However, O6-MeG repair by O6-methylguanine-DNA methyltransferase (MGMT) contributes to drug resistance. Characterizing genomic profiles of O6-MeG could elucidate how O6-MeG accumulation is influenced by repair, but there are no methods to map genomic locations of O6-MeG. Here, we developed an immunoprecipitation- and polymerase-stalling-based method, termed O6-MeG-seq, to locate O6-MeG across the whole genome at single-nucleotide resolution. We analyzed O6-MeG formation and repair across sequence contexts and functional genomic regions in relation to MGMT expression in a glioblastoma-derived cell line. O6-MeG signatures were highly similar to mutational signatures from patients previously treated with temozolomide. Furthermore, MGMT did not preferentially repair O6-MeG with respect to sequence context, chromatin state or gene expression level, however, may protect oncogenes from mutations. Finally, we found an MGMT-independent strand bias in O6-MeG accumulation in highly expressed genes. These data provide high resolution insight on how O6-MeG formation and repair are impacted by genome structure and nucleotide sequence. Further, O6-MeG-seq is expected to enable future studies of DNA modification signatures as diagnostic markers for addressing drug resistance and preventing secondary cancers.
© The Author(s) 2025. Published by Oxford University Press on behalf of Nucleic Acids Research.
Figures


Similar articles
-
PARP-mediated PARylation of MGMT is critical to promote repair of temozolomide-induced O6-methylguanine DNA damage in glioblastoma.Neuro Oncol. 2021 Jun 1;23(6):920-931. doi: 10.1093/neuonc/noab003. Neuro Oncol. 2021. PMID: 33433610 Free PMC article.
-
Temozolomide: mechanisms of action, repair and resistance.Curr Mol Pharmacol. 2012 Jan;5(1):102-14. doi: 10.2174/1874467211205010102. Curr Mol Pharmacol. 2012. PMID: 22122467
-
Inhibition of histone deacetylation potentiates the evolution of acquired temozolomide resistance linked to MGMT upregulation in glioblastoma xenografts.Clin Cancer Res. 2012 Aug 1;18(15):4070-9. doi: 10.1158/1078-0432.CCR-12-0560. Epub 2012 Jun 6. Clin Cancer Res. 2012. PMID: 22675172 Free PMC article.
-
Regulation of expression of O6-methylguanine-DNA methyltransferase and the treatment of glioblastoma (Review).Int J Oncol. 2015 Aug;47(2):417-28. doi: 10.3892/ijo.2015.3026. Epub 2015 May 29. Int J Oncol. 2015. PMID: 26035292 Free PMC article. Review.
-
MGMT Expression Contributes to Temozolomide Resistance in H3K27M-Mutant Diffuse Midline Gliomas and MGMT Silencing to Temozolomide Sensitivity in IDH-Mutant Gliomas.Neurol Med Chir (Tokyo). 2018 Jul 15;58(7):290-295. doi: 10.2176/nmc.ra.2018-0044. Epub 2018 May 31. Neurol Med Chir (Tokyo). 2018. PMID: 29848907 Free PMC article. Review.
Cited by
-
Real-World Efficacy and Safety of Anti-PD-1 Antibody Plus Apatinib and Temozolomide for Advanced Acral Melanoma.Cancer Manag Res. 2025 May 1;17:905-916. doi: 10.2147/CMAR.S520937. eCollection 2025. Cancer Manag Res. 2025. PMID: 40331053 Free PMC article.
References
-
- Friedman H.S., Kerby T., Calvert H. Temozolomide and treatment of malignant glioma. Clin. Cancer Res. 2000; 6:2585–2597. - PubMed
MeSH terms
Substances
Grants and funding
LinkOut - more resources
Full Text Sources
Molecular Biology Databases
Research Materials

