. 2025 Feb 1;5(2):253-266.
doi: 10.1158/2767-9764.CRC-24-0400.

MYC and HSF1 Cooperate to Drive Sensitivity to Polo-like Kinase 1 Inhibitor Volasertib in High-grade Serous Ovarian Cancer

Affiliations

MYC and HSF1 Cooperate to Drive Sensitivity to Polo-like Kinase 1 Inhibitor Volasertib in High-grade Serous Ovarian Cancer

Imade Williams et al. Cancer Res Commun. .

Abstract

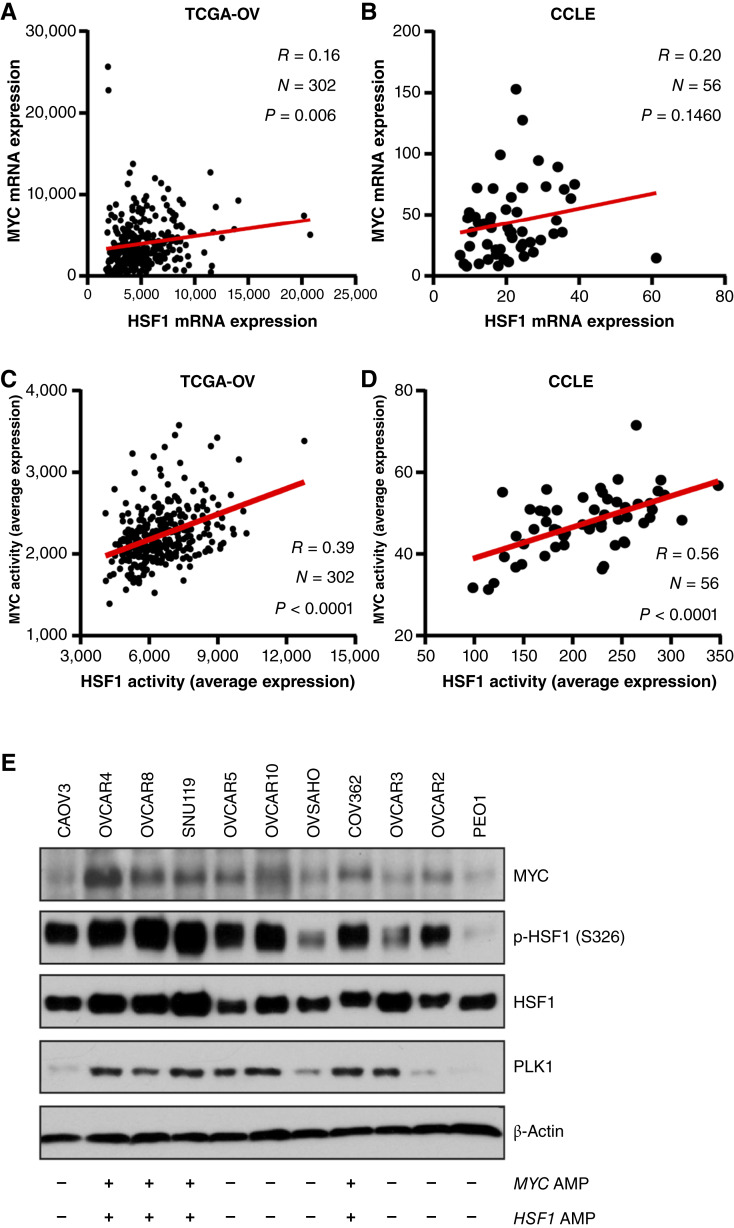
Abstract: Ovarian cancer is a deadly gynecologic disease with frequent recurrence. Current treatments for patients include platinum-based therapy regimens with PARP inhibitors specific for homologous recombination–deficient high-grade serous ovarian cancers (HGSOC). Despite initial effectiveness, patients inevitably develop disease progression as tumor cells acquire resistance. Toward the development of new therapeutic avenues, we describe a gene amplification involving both heat shock factor 1 (HSF1) and MYC, wherein these two genes are co-amplified in more than 30% of patients with HGSOC. We further found that HSF1 and MYC transcriptional activities were highly correlated with human HGSOC tumors and cell lines, suggesting that they may cooperate in the disease. CUT&RUN sequencing for HSF1 and MYC revealed overlapping HSF1 and MYC binding throughout the genome. Moreover, the binding peaks of both transcription factors in HGSOC cells were nearly identical, and a protein–protein interaction between HSF1 and MYC was detected, supporting molecular cooperation. Supporting a functional cooperation of these two transcription factors, the growth of HGSOC cells with the co-amplification was dependent on both HSF1 and MYC. To identify a therapeutic target that could take advantage of this unique HSF1 and MYC dependency, polo-like kinase 1 (PLK1) was correlated with HSF1 and MYC in HGSOC specimens. Targeting PLK1 with volasertib revealed a greater than 200-fold increased potency in HSF1–MYC co-amplified HGSOC cells compared with those with wild-type HSF1 and MYC copy numbers. Although the success of volasertib and other PLK1 inhibitors in clinical trials has been modest, the current study suggests that targeting PLK1 using a precision medicine approach based on HSF1–MYC co-amplification as a biomarker in HGSOC would improve therapy response and patient outcomes.

Significance: We show that HSF1 and MYC genes are co-amplified in more than 30% of HGSOC and demonstrate that HSF1 and MYC functionally cooperate to drive the growth of HGSOC cells. This work provides the foundation for HSF1 and MYC co-amplification as a biomarker for treatment efficacy of the polo-like kinase 1 inhibitor volasertib in HGSOC.


Conflict of interest statement

I. Williams reports grants from Ovarian Cancer Research Alliance during the conduct of the study. R.L. Carpenter reports a patent for 18/418,110 pending. No disclosures were reported by the other authors.

Figures

Figure 1
Figure 1
MYC and HSF1 are frequently co-amplified in HGSOC. Analysis of copy-number variation for HSF1 and MYC across cancer types using TCGA cohorts. Data were analyzed via cBioPortal. A and B, Amplification frequency for HSF1 (A) and MYC (B) across tumor types is presented, with amplification defined as ≥2 copy-number gains. C, Oncoprint for HSF1 and MYC across all TCGA tumor types to indicate overlapping amplification for both genes. D, Table for HSF1 and MYC amplification across all tumor types. A Fisher exact test was used to test the statistical significance for co-occurrence of amplification for both genes. E, Venn diagram of HSF1 and MYC amplification for all tumor types indicating how many amplifications were overlapping. F, Oncoprint for HSF1 and MYC in TCGA-OV cohort to indicate overlapping amplifications in ovarian cancer. G, Table for HSF1 and MYC amplification in ovarian cancer. A Fisher exact test was used to test the statistical significance for co-occurrence of amplification for both genes. H, Venn diagram of HSF1 and MYC amplification in ovarian cancer indicating how many amplifications were overlapping. AMP, amplification.
Figure 2
Figure 2
HSF1 activity is associated with MYC activity in HGSOC. A and B, HSF1 mRNA levels were plotted with MYC mRNA levels and analyzed with Pearson correlation in the TCGA-OV cohort (A) and HGSOC cell lines from the CCLE; (B). C and D, HSF1 and MYC transcriptional activities were calculated using published gene signatures and subjected to Pearson correlation using the TCGA-OV cohort (C) and HGSOC cell lines from the CCLE (D). E, Total protein from indicated cell lines were subjected to immunoblotting with the indicated antibodies. Immunoblotting was performed with three independent replicates. AMP, amplification.
Figure 3
Figure 3
HSF1 and MYC share binding locations in the genome of OVCAR8 cells. OVCAR8 cells were subjected to CUT&RUN for both HSF1 and MYC. A and B, HSF1 and MYC called peaks (A) and annotated genes (B) are presented with the overlapping number between HSF1 and MYC in the Venn diagram overlap. C and D, Motif analysis showing the MYC-binding motif that presented in the HSF1 CUT&RUN (C) and the HSF1 binding motif that presented in the MYC CUT&RUN (D). E–G, Binding peaks for MYC (E), HSF1 (F), and the genes comprising the overlapping peaks (G) were classified by their binding location. H, Gene tracks from HSF1 and MYC CUT&RUN showing examples of genes with MYC-only binding (left), HSF1-only binding (middle), or genes with binding of both MYC and HSF1 (right). I, Total protein from OVCAR4 and OVCAR8 cells was subjected to immunoprecipitation with HSF1 antibodies and immunoblotted with the indicated antibodies. J, Volcano plot showing differentially expressed genes from TCGA-OV cohort comparing tumors with MYC–HSF1 co-amplification vs. tumors with a MYC–HSF1 WT copy number. K, Genes that were significantly higher expressed in MYC–HSF1 co-amplified tumors from J were overlapped with genes that were bound by both MYC and HSF1 (n = 83). These upregulated and MYC–HSF1–bound genes were subjected to Gene Ontology and enriched categories presented. AMP, amplification.
Figure 4
Figure 4
HSF1 and MYC cooperate in ovarian cancer cells. A, Analysis of HSF1 and MYC CUT&RUN showing gene tracks and binding at the MYC and HSF1 genes. B and C, OVCAR8 cells were transfected with MYC (B) or HSF1 (C) siRNA for 48 hours. Total protein was subjected to immunoblotting. Bands were quantified by densitometry, and average changes are indicated under each band from at least two replicates. D, FTE-MYC cells were transfected with HSF1 siRNA for 48 hours. Total protein was subjected to immunoblotting. Bands were quantified by densitometry, and average changes are indicated under each band from at least two replicates. E and F, OVCAR8 cells were transfected with control, HSF1, or MYC siRNA for 48 hours. Total RNA was subjected to RT-qPCR for MYC (E) and HSF1 (F). G and H, OVSAHO cells were transfected with vector, HSF1, or MYC for 48 hours. Total RNA was subjected to RT-qPCR for HSF1 (G) and MYC (H). *, P < 0.05. siCTL, siRNA control. I and J, The TCGA-OV cohort was used to determine the correlation between MYC activity and HSF1 expression (I) as well as between HSF1 activity and MYC expression (J). Correlation was analyzed with Pearson correlation.
Figure 5
Figure 5
HSF1–MYC co-amplified HGSOC cells require both HSF1 and MYC for growth. A and B, OVCAR8 cells were transfected with control, HSF1, or MYC siRNA for 48 hours followed by a clonogenic growth assay for 7 days (A) or cell proliferation (B). C and D, FTE-MYC cells were transfected with control or HSF1 siRNA for 48 hours, followed by a clonogenic growth assay for 7 days (C) or cell proliferation (D). E and F, Either FTE-MYC (human; E) or OvTrpMyc-F318LOV (mouse) cells (F) were subjected to clonogenic growth assay for 7 days in the presence of vehicle or the HSF1 inhibitor SISU-102 at the indicated dosages. *, P < 0.05. siCTL, siRNA control; Veh, vehicle.
Figure 6
Figure 6
HSF1 and MYC are correlated with active PLK1 in HGSOC tumors. A, Diagram of the relationship between PLK1 and MYC/HSF1, indicating that PLK1 can directly regulate MYC and HSF1 through phosphorylation but also indirectly by regulating them through the PI3K–AKT pathway, among others. B and C, PLK1 activity was assessed using a published gene signature in the TCGA-OV cohort and correlated with activity signatures for MYC (B) or HSF1 (C). D, 58 HGSOC tumors were subjected to IHC with antibodies for MYC, HSF1, and active PLK1 (pT210). E–G, IHC in D was analyzed with QuPath to identify the percent of cells that have positive nuclei for these markers to indicate active levels. Pearson correlation was used to correlate active HSF1 and MYC (E), HSF1 and PLK1 (F), and MYC and PLK1 (G).
Figure 7
Figure 7
HSF1–MYC co-amplified HGSOC cells are highly sensitive to PLK1 inhibition with volasertib. A, IC50 for volasertib in HGSOC cells with HSF1 and MYC amplified or WT. B–D, OVCAR8 (B, AMP), CAOV3 (C, WT), or FTE-MYC (D) cells were subjected to a clonogenic growth assay for 7 days in the presence of vehicle or volasertib at indicated doses. E, OVCAR8 and CAOV3 cells were subjected to tumor spheroid growth for 12 days in the presence of vehicle or volasertib at the indicated doses. F, OVCAR8 cells were grown in the presence of vehicle or volasertib (1 nmol/L) for the indicated time periods. Total protein was subjected to immunoblotting for the indicated antibodies. G and H, OVCAR4 (AMP) or CAOV3 (WT) cells were treated with vehicle or volasertib at the indicated doses for 24 hours. Total RNA was subjected to RT-qPCR for MYC (G) or HSP70 (H). *, P < 0.05. AMP, amplification; Veh, vehicle; Volas, volasertib.

Update of

Similar articles

References

    1. ACS . Cancer facts & figures 2024. Atlanta (GA): American Cancer Society; 2024.
    1. Labidi-Galy SI, Papp E, Hallberg D, Niknafs N, Adleff V, Noe M, et al. . High grade serous ovarian carcinomas originate in the fallopian tube. Nat Commun 2017;8:1093. - PMC - PubMed
    1. Lheureux S, Gourley C, Vergote I, Oza AM. Epithelial ovarian cancer. Lancet 2019;393:1240–53. - PubMed
    1. Torre LA, Trabert B, DeSantis CE, Miller KD, Samimi G, Runowicz CD, et al. . Ovarian cancer statistics, 2018. CA Cancer J Clin 2018;68:284–96. - PMC - PubMed
    1. Lengyel E. Ovarian cancer development and metastasis. Am J Pathol 2010;177:1053–64. - PMC - PubMed

MeSH terms