

Volumetry of Selected Brain Regions-Can We Compare MRI Examinations of Different Manufacturers and Field Strengths?
- PMID: 39832010
- PMCID: PMC12174252
- DOI: 10.1007/s00062-024-01489-x
Volumetry of Selected Brain Regions-Can We Compare MRI Examinations of Different Manufacturers and Field Strengths?
Abstract
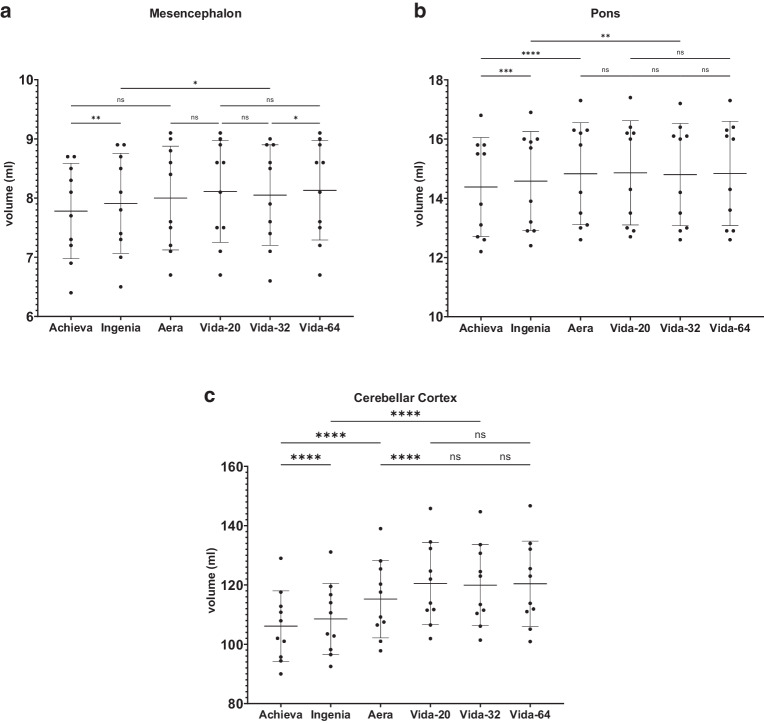
Purpose: Magnetic Resonance Imaging based brain segmentation and volumetry has become an important tool in clinical routine and research. However the impact of the used hardware is only barely investigated. This study aims to assess the influence of scanner manufacturer, field strength and head-coil on volumetry results.
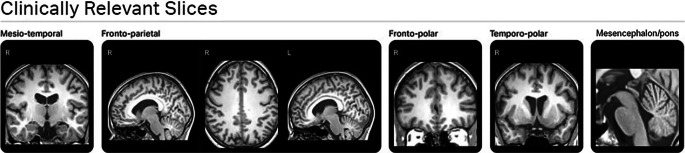
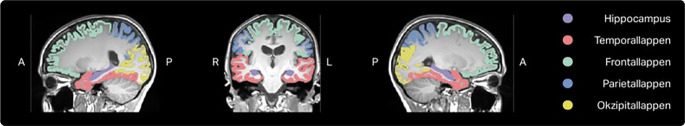
Methods: 10 healthy subjects (27.4 ± 1.71 years) were prospectively examined in a Philips Achieva 1.5T, Philips Ingenia CX 3T, Siemens MAGNETOM Aera 1.5T and Siemens MAGNETOM Vida 3T, the latter equipped with three different head coils, within one day. Brain volumetry of the whole brain, total white and grey matter, the cortical grey matter of the supratentorial lobes as well as regions important for the differentiation of neurodegenerative diseases of the dementia and movement disorder spectrum and the ventricular system was performed using the CE-certified software mdbrain by mediaire (Berlin, Germany). Both raw volumetry results and percentile allocation provided by the software were analysed.
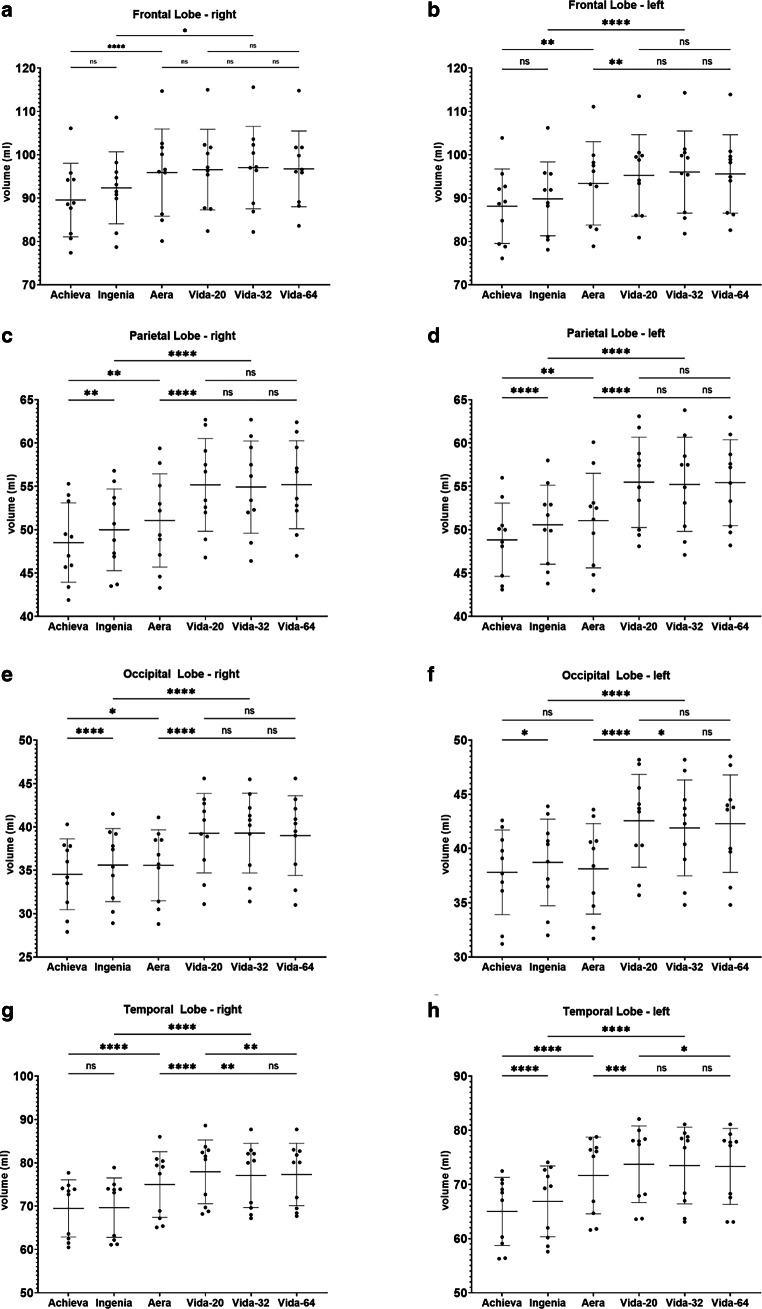
Results: This study reveals significantly different volumetry results for all examined brain regions beside the ventricular system between the different MRI devices but comparable results between the different head coils. When examining the percentile allocation provided by used software, the Intraclass-Correlation-Coefficient (ICC) values were even lower than the raw volume ICC values ranging from poor to excellent correlation.
Conclusion: The present study reveals highly relevant results that need to be considered both in clinical routine when analysing follow-up examinations from different scanner types and clinical research, especially when planning longitudinal and/or multicentre studies.
Keywords: Automatic Brain Segmentation; Brain Volumetry; MRI Hardware; Magnetic Resonance Imaging; Neuroimaging.
© 2025. The Author(s).
Conflict of interest statement
Conflict of interest: S. Seehafer, L.-P. Schmill, S. Peters, O. Jansen and S. Aludin declare that they have no competing interests.
Figures


Similar articles
-
Accuracy and Longitudinal Consistency of PET/MR Attenuation Correction in Amyloid PET Imaging amid Software and Hardware Upgrades.AJNR Am J Neuroradiol. 2025 Mar 4;46(3):635-642. doi: 10.3174/ajnr.A8490. AJNR Am J Neuroradiol. 2025. PMID: 39251256
-
Assessing the comparative effects of interventions in COPD: a tutorial on network meta-analysis for clinicians.Respir Res. 2024 Dec 21;25(1):438. doi: 10.1186/s12931-024-03056-x. Respir Res. 2024. PMID: 39709425 Free PMC article. Review.
-
3D Quantitative MRI: A Fast and Reliable Method for Ventricular Volumetry.World Neurosurg. 2025 Mar;195:123661. doi: 10.1016/j.wneu.2025.123661. Epub 2025 Feb 3. World Neurosurg. 2025. PMID: 39788420
-
Surveillance for Violent Deaths - National Violent Death Reporting System, 50 States, the District of Columbia, and Puerto Rico, 2022.MMWR Surveill Summ. 2025 Jun 12;74(5):1-42. doi: 10.15585/mmwr.ss7405a1. MMWR Surveill Summ. 2025. PMID: 40493548 Free PMC article.
-
Defining disease severity in atopic dermatitis and psoriasis for the application to biomarker research: an interdisciplinary perspective.Br J Dermatol. 2024 Jun 20;191(1):14-23. doi: 10.1093/bjd/ljae080. Br J Dermatol. 2024. PMID: 38419411 Free PMC article. Review.
Cited by
-
AI improves consistency in regional brain volumes measured in ultra-low-field MRI and 3T MRI.Front Neuroimaging. 2025 Jun 4;4:1588487. doi: 10.3389/fnimg.2025.1588487. eCollection 2025. Front Neuroimaging. 2025. PMID: 40534653 Free PMC article.
References
-
- Giorgio A, de Stefano N. Clinical use of brain volumetry. J Magn Reson Imaging. 2013;37:1–14. 10.1002/jmri.23671. - PubMed
-
- Scheltens P, Pasquier F, Weerts JG, Barkhof F, Leys D. Qualitative assessment of cerebral atrophy on MRI: inter- and intra-observer reproducibility in dementia and normal aging. Eur Neurol. 1997;37:95–9. 10.1159/000117417. - PubMed
-
- Scheltens P, Leys D, Barkhof F, Huglo D, Weinstein HC, Vermersch P, et al. Atrophy of medial temporal lobes on MRI in “probable” Alzheimer’s disease and normal ageing: diagnostic value and neuropsychological correlates. J Neurol Neurosurg Psychiatry. 1992;55:967–72. 10.1136/jnnp.55.10.967. - PMC - PubMed
-
- Fazekas F, Schmidt R, Scheltens P. Pathophysiologic mechanisms in the development of age-related white matter changes of the brain. Dement Geriatr Cogn Disord. 1998;1:2–5. 10.1159/000051182. - PubMed
Publication types
MeSH terms
LinkOut - more resources
Full Text Sources
Medical
