. 2025 Mar:93:102100.
doi: 10.1016/j.molmet.2025.102100. Epub 2025 Jan 18.

Timing of exercise differentially impacts adipose tissue gain in male adolescent rats

Affiliations

Timing of exercise differentially impacts adipose tissue gain in male adolescent rats

Y Kutsenko et al. Mol Metab. 2025 Mar.

Erratum in

Abstract

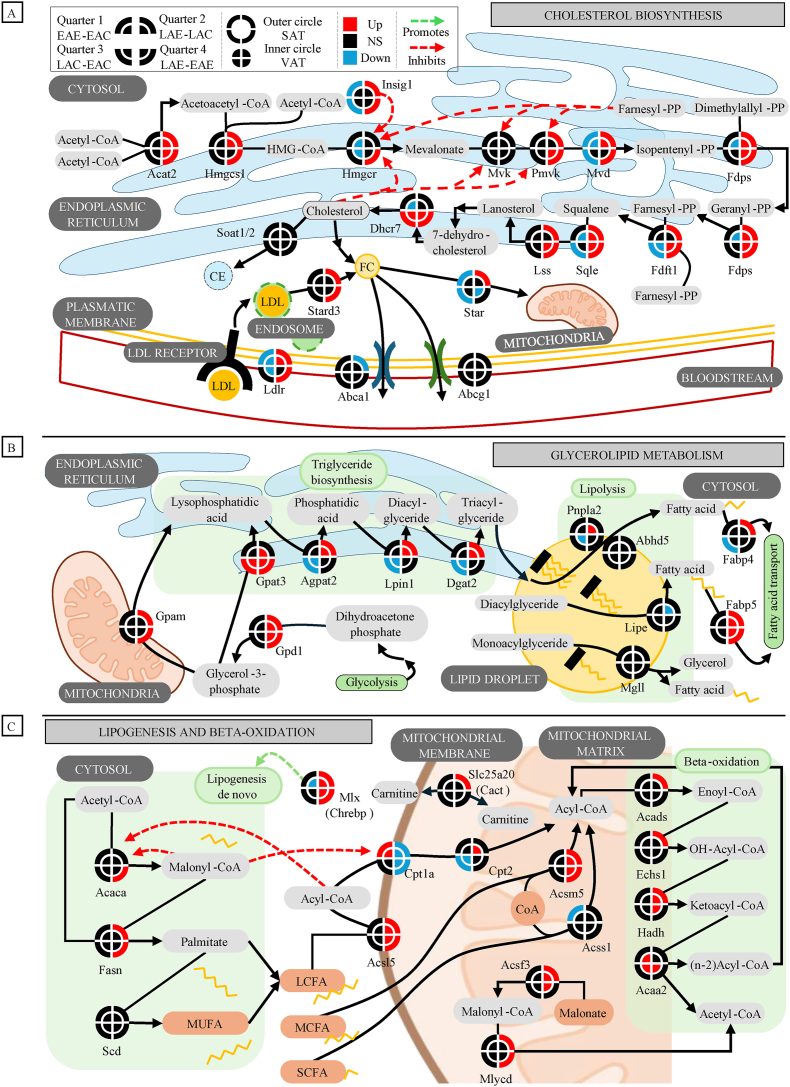
Objective: Circadian rhythms of metabolic, hormonal, and behavioral fluctuations and their alterations can impact health. An important gap in knowledge in the field is whether the time of the day of exercise and the age of onset of exercise exert distinct effects at the level of whole-body adipose tissue and body composition. The goal of the present study was to determine how exercise at different times of the day during adolescence impacts the adipose tissue transcriptome and content in a rodent model.

Methods: Rats were subjected to one of four conditions during their adolescence: early active phase control or exercise (EAC or EAE; ZT13), and late active phase control or exercise (LAC or LAE; ZT23). The effects of exercise timing were assessed at the level of subcutaneous and visceral adipose tissue transcriptome, body composition, hypothalamic expression of orexigenic and anorexigenic genes, blood serum markers and 24-hour core body temperature patterns.

Results: We found that late active phase exercise (ZT23) greatly upregulated pathways of lipid synthesis, glycolysis and NADH shuttles in LAE rats, compared to LAC or EAE. Conversely, LAE rats showed notably lower content of adipose tissue. In addition, LAE rats showed signs of impaired FGF21-adiponectin axis compared to other groups.

Conclusions: Finally, LAE rats showed higher post-exercise core body temperature compared to other groups. Our results thus indicate that our exercise protocol induced an unusual effect characterized by enhanced lipid synthesis but reduced adipose tissue content in late active phase but not early active phase exercise during adolescence.

Keywords: Adipose tissue; Adolescence; Body composition; Circadian system; Forced exercise; Rodent; Transcriptomics.


Conflict of interest statement

Declaration of competing interest The authors declare that they have no known competing financial interests or personal relationships that could have appeared to influence the work reported in this paper.

Figures

Image 1
Graphical abstract
Figure 1
Figure 1
Experimental design and transcriptomic analysis. A) Timeline of the study. B) Animal grouping. Three animals were housed per cage. C) Tridimensional reconstruction of the body composition of a rat. The visceral (orange) and subcutaneous (yellow) adipose tissue content was quantified between reference points 1 and 2 (blue). The areas used for RNA-seq analysis were pointed (inguinal for SAT and pararenal for VAT). Hypothalamic tissue was used for q-PCR analysis of orexigenic and anorexigenic genes. Trunk blood (red) was collected immediately upon sacrifice and used for serologic analyses. D) Representation of exercise sessions timing and corticosterone levels throughout 24 h. E) The serum corticosterone levels were measured at ZT13 or ZT23 for each group. F) Heatmaps of differentially expressed genes found with the LRT (adjusted p-value <0.1) On the left, two heatmaps calculated independently for SAT and VAT represent the z-scores. On the right, another heatmap despicts the log2 Foldchange of exercise-control comparisons. G) Significant pathways based on p-value combination analysis (adjusted p-value <0.1 of the FDR comparison) Only signaling or metabolism pathways were plotted. H) Gene set enrichment analysis (GSEA). Only the results from enriched terms of LAE-LAC groups were plotted, since EAC/EAE animals did not show any enriched terms. Legend to the figure: P = Postnatal day; CT = Computerized Tomography; ZT = Zeitgeber Time; RP = Reference Point; VAT = Visceral Adipose Tissue; SAT = Subcutaneous Adipose Tissue; EA = Early Active Phase (ZT13); LA = Late Active Phase (ZT23); NES = Normalized Enrichment Score. (For interpretation of the references to color in this figure legend, the reader is referred to the Web version of this article.)
Figure 2
Figure 2
Expression patterns of lipid metabolism-related pathways. Upregulated or downregulated genes were colored based on raw p-values from Wald-tests from DESeq2 analysis (raw p-value <0.05 and absolute log2 FC > 0.5). A) Pathway of cholesterol biosynthesis and transport. LAE rats showed increased expression of genes involved in biosynthesis (Acat2, Hmgcs1, Hmgcr, Pmvk, Mvd, Fdps, Fdft1, Sqle, Lss, and Dhcr7), uptake (Ldlr) and transport (Star, Stard3) of cholesterol compared to LAC or to EAE. B) Pathway of glycerolipid metabolism. LAE rats showed upregulated expression of genes involved in triglyceride biosynthesis (Gpd1, Gpat3, Gpam, Agpat2, Lpin1 and Dgat2) and fatty acid transport (Fabp4, Fabp5), compared to LAC or EAE. C) Pathway of lipogenesis and β -oxidation. LAE rats showed upregulated expression of genes involved in de novo lipogenesis (Fasn) and β-oxidation (Acsl5, Acsm5, Acads, Echs1, and Hadh) compared to LAC. Legend to the figure: NS = Non-significant; CE = Cholesterol Ester; LDL = Low-Density Lipoprotein; FC = Free-Cholesterol; MUFA = Monounsaturated Fatty Acids; LCFA = Long-Chain Fatty Acids; MCFA = Medium-Chain Fatty Acids; SCFA = Short-Chain Fatty Acids.
Figure 3
Figure 3
Expression patterns of carbohydrate metabolism and energy yielding pathways. Upregulated or downregulated genes were colored based on raw p-values from Wald-tests from DESeq2 analysis (raw p-value <0.05 and absolute log2 FC > 0.5). A) Pathway of glycolysis. Expression of genes involved in glucose metabolism, including sugar transport (Slc2a4, Slc2a5), upper glycolysis (Hk2, Gpi, Pfkl, Pfkm, Aldoa, Tpi), lower glycolysis (Pgk1, Pgam1, Eno1, Pkm, Ldha, Ldhb) and mitochondrial glycolysis (Mpc1, Mpc2, Pc, Pdk, Pdha1, Dlat, Dld) was higher in LAE compared to LAC or EAE rats. B) Pathway of glycogen metabolism. LAE rats showed increased expression of genes involved in glycogen synthesis (Pgm1, Pgm2, Gyg1, Gys2, Gbe1, Ppp1r3b) and glycogen breakdown (Pygl), mainly in SAT. C) Pathway of tricarboxylic acid cycle. LAE rats showed upregulated expression of transcripts from the tricarboxylic acid cycle (Aco2, Idh3, Dlst, Dld, Suclg1, Sdhb, Sdhc, Sdhd, Fh, Mdh2, Slc25a1) and the electron transport chain pathways. Expression of rate-limiting enzymes from these pathways was similar between control and exercised groups, including Cs, Ogdh and Sdha. Expression of transcripts from NADH shuttle pathways (Acly, Mdh1, Slc25a11, Gpd1, Gpd2) was remarkably upregulated in the adipose tissue of LAE rats compared to their controls or to EAE rats. Legend to the figure: NS = Non-significant; G = Glucose; F = Fructose; UDP-G = UDP-Glucose; ETC = Electron Transport Chain.
Figure 4
Figure 4
Determination of body composition changes (A–M), food intake differences (N) and mRNA expression of hypothalamic genes (O). A-M) Changes in body composition were analyzed with repeated two-way ANOVA and corrected for multiple comparisons with Sidak post-hoc (n = 12 per group). Graphs B, D, F, I, L represent the delta values (P57 minus P24 values) of the corresponding variables, analyzed by two-way ANOVA and corrected for multiple comparisons with Sidak. Graphs G, J, M visually show the quantification of adipose tissue through computerized tomography. N) Food consumption normalized by body weight was analyzed with repeated measures ANOVA and LSD post-hoc (n = 6 per group). O) Hypothalamic expression of orexigenic and anorexigenic genes was analyzed with two-way ANOVA and Sidak post-hoc (n = 6 per group). One data point was excluded from EAE rats (gene Npy) due to abnormally high value. Legend to the figure: TA = thoracoabdominal; AT = adipose tissue; SAT = subcutaneous adipose tissue; VAT = visceral adipose tissue; -ddCq = negative delta–delta quantification cycle; PRE = values from postnatal day 25; POST = values from postnatal day 57. Significance levels: ∗ = p < 0.05; ∗∗ = p < 0.01; ∗∗∗ = p < 0.001; ∗∗∗∗ = p < 0.0001.
Figure 5
Figure 5
Determination of serum markers of energy metabolism (A–H) and post-exercise core body temperature (I–M). A-H) Serum markers were analyzed with two-way ANOVA and with Sidak correction for multiple comparisons (n = 6 per group). I) Experimental timeline and design of the core body temperature cohort. J-L) Post exercise core body temperature values (every minute) from ZT12 to ZT17 (EA session; n = 5–6 rats per group). M) Core body temperature values averaged by 30-minute periods (EA session). Statistical analysis performed with two-way ANOVA and Sidak post-hoc (n = 5–6 per group). N–P) Post exercise core body temperature values (every minute) from ZT22 to ZT3 (LA session; n = 5–6 rats per group). Q) Core body temperature values averaged by 30-minute periods (LA session). Statistical analysis performed with two-way ANOVA and Sidak post-hoc (n = 5–6 per group). Legend to the figure: P = postnatal day; ZT = Zeitgeber Time. Statistical levels: ∗ = p < 0.05; ∗∗ = p < 0.01; ∗∗∗ = p < 0.001; ∗∗∗∗ = p < 0.0001.

References

    1. Abbott S.M., Zee P.C. Circadian rhythms: implications for health and disease. Neurol Clin. 2019;37:601–613. doi: 10.1016/j.ncl.2019.04.004. - DOI - PubMed
    1. Maywood E.S., O’Neill J., Wong G.K.Y., Reddy A.B., Hastings M.H. In: Progress in brain research. Kalsbeek A., Fliers E., Hofman M.A., Swaab D.F., van Someren E.J.W., Buijs R.M., editors. Elsevier; 2006. Circadian timing in health and disease; pp. 253–269. - DOI - PubMed
    1. Zhang Z., Xin H., Li M.-D. Circadian rhythm of lipid metabolism in health and disease. Small Methods. 2020;4 doi: 10.1002/smtd.201900601. - DOI
    1. Shimizu I., Yoshida Y., Minamino T. A role for circadian clock in metabolic disease. Hypertens Res. 2016;39:483–491. doi: 10.1038/hr.2016.12. - DOI - PubMed
    1. Walton J.C., Walker II W.H., Bumgarner J.R., Meléndez-Fernández O.H., Liu J.A., Hughes H.L., et al. Circadian variation in efficacy of medications. Clin Pharmacol Therapeut. 2021;109:1457–1488. doi: 10.1002/cpt.2073. - DOI - PMC - PubMed

LinkOut - more resources