. 2025 Jun 6;74(7):1125-1136.
doi: 10.1136/gutjnl-2024-334148.

Unlocking novel T cell-based immunotherapy for hepatocellular carcinoma through neoantigen-driven T cell receptor isolation

Affiliations

Unlocking novel T cell-based immunotherapy for hepatocellular carcinoma through neoantigen-driven T cell receptor isolation

Panagiota Maravelia et al. Gut. .

Abstract

Background: Tumour-infiltrating T cells can mediate both antitumour immunity and promote tumour progression by creating an immunosuppressive environment. This dual role is especially relevant in hepatocellular carcinoma (HCC), characterised by a unique microenvironment and limited success with current immunotherapy.

Objective: We evaluated T cell responses in patients with advanced HCC by analysing tumours, liver flushes and liver-draining lymph nodes, to understand whether reactive T cell populations could be identified despite the immunosuppressive environment.

Design: T cells isolated from clinical samples were tested for reactivity against predicted neoantigens. Single-cell RNA sequencing was employed to evaluate the transcriptomic and proteomic profiles of antigen-experienced T cells. Neoantigen-reactive T cells expressing 4-1BB were isolated and characterised through T-cell receptor (TCR)-sequencing.

Results: Bioinformatic analysis identified 542 candidate neoantigens from seven patients. Of these, 78 neoantigens, along with 11 hotspot targets from HCC driver oncogenes, were selected for ex vivo T cell stimulation. Reactivity was confirmed in co-culture assays for 14 targets, with most reactive T cells derived from liver flushes and lymph nodes. Liver flush-derived T cells exhibited central memory and effector memory CD4+ with cytotoxic effector profiles. In contrast, tissue-resident memory CD4+ and CD8+ T cells with an exhausted profile were primarily identified in the draining lymph nodes.

Conclusion: These findings offer valuable insights into the functional profiles of neoantigen-reactive T cells within and surrounding the HCC microenvironment. T cells isolated from liver flushes and tumour-draining lymph nodes may serve as a promising source of reactive T cells and TCRs for further use in immunotherapy for HCC.

Keywords: ANTIGENS; HEPATOCELLULAR CARCINOMA; IMMUNOTHERAPY; T LYMPHOCYTES; T-CELL RECEPTOR.


Conflict of interest statement

Competing interests: None declared.

Figures

Figure 1
Figure 1. Phenotypic and functional spectrum of antigen-experienced T cells revealed by single-cell RNA-seq. (A) Schematic overview of the steps involved in the screening and isolation of neoantigen-reactive TCRs. Seven patients' tumours were analysed using whole-exome sequencing (WES) and RNA sequencing (RNA-seq) for neoantigen screening. (B) UMAP and clustering of integrated T cells from all patients and tissues. (C) The distribution of cells in the 2-dimensional UMAP space is shown, with cells colored according to tissue distribution. (D) UMAP and clustering of CD4+ T cells from figure 1B, Cl0, Cl4 and Cl5. (E) Stacked bar plots representing the proportions of each CD4+ cluster 0-5 for each patient and per tissue sample, UMAP visualisation of tissue-specific distribution of CD4+ T cells is presented in online supplemental figure 3A. (F) UMAP and clustering of CD8+ T cells from figure 1B, Cl1, Cl2 and Cl3. (G) Stacked bar plots representing the proportions of each CD8+ cluster 0-6 for each patient and per tissue sample, UMAP visualisation of tissue-specific distribution of CD8+ T cells is presented in online supplemental figure 4A. Single cell sequence data analysis of B–G are from 4 patients (HCC01, HCC05, HCC14, HCC16). Flush, blood flushed from explanted liver; HSP, heat shock proteins; LN, adjacent draining lymph node; TCM, T central memory; TD, terminally differentiated; TE, T effector; Treg, T regulatory; TRM, T resident memory.
Figure 2
Figure 2. Immune signatures of TCRs derived from clonal T cell populations. (A) Stacked bar plots showing the distribution of clones in CD4+ cluster (resolution 0.5) in number of cells. UMAP analysis and clustering of CD4+ T cells, originally presented in figure 1D, depict their tissue-specific distribution as shown in online supplemental figure 3A and online supplemental 5A. (B) UMAP plots showing the localisation of the top 5 CD4+ clones for each patient. The top clones are calculated from the total number of cells, meaning that the distribution across clusters will also reflect differences in distribution of clusters between samples. UMAP and clustering of CD4+ T cells are as shown in figure 1D, and distribution of clusters in tumours, flush and LN are as shown in online supplemental figure 3A. (C) Stacked bar plots showing the distribution of clones in CD8+ clusters (resolution 0.75) in number of cells. UMAP analysis and clustering of CD8+ T cells, originally presented in figure 1F, depict their tissue-specific distribution as shown in online supplemental figure 4A and online supplemental 5A. (D) UMAP plots showing the localisation of the top 5 CD8+ clones for each patient. The top clones are calculated from the total number of cells, meaning that the distribution across clusters will also reflect differences in distribution of clusters between samples. UMAP and clustering of CD8+ T cells are as shown in figure 1F, and distribution of clusters in tumours, flush and LN are as shown in online supplemental figure 4A. Data analysis of A–D are from 4 patients (HCC01, HCC05, HCC14, HCC16).
Figure 3
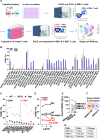
Figure 3. Identification of (prospective) T cell reactivity to selected neoantigens in HCC. (A) Schematic overview for the isolation of neoantigen-reactive T cells and/or their TCRs. Following in vitro stimulation with neoantigen-encoding peptides and FACS sorting of 4-1BB+ T cells, single-cell RNA-seq was performed on 4-1BB enriched T cells following a second rapid expansion after FACS sorting of 4-1BB+ samples. APCs and T cells were obtained from samples of 7 patients. The neoantigen screening results and peptide lists are presented in table 1 and online supplemental tables 1 and 2. Note: only T cells with double validation of mutation-specific immunogenicity after expansion were selected for further TCR single-cell sequencing, as demonstrated in the experiment shown in panel C. (B) The representative graph illustrates the positive reactivity of T cells derived from draining lymph nodes, or liver flushes from HCC patients. Reactivity is based on the percentage of 4-1BB expression in both CD4+ and CD8+ T cells following stimulation with various neoantigens. T cell reactivity screen for other HCC patients is detailed in table 1. OKT3 served as the positive control, while the absence of peptide was used as the negative control. (C) The graph shows the double validation of mutation-specific immunogenicity, with the percentage of 4-1BB expression for samples expanded after FACS sorting to enrich for 4-1BB+ cells. (D) Reactivity based on 4-1BB expression after stimulation with different peptide concentrations for SBNO2 mutant antigen, SBNO2 wild-type peptide and unstimulated (no-peptide added) sample. (E) Plot shows the CDR3β counts in the SBNO2 non-reactive (NR) and reactive (R) populations. Three CDR3β clones named TRBV12-3, TRBV6-1 and TRBV12-3 that were solely expanded in the SBNO2-R sample are labelled on the graph. (F) Venn diagram shows the CDR3β clonotypes (n=8) that are shared between SBNO2 non-reactive (NR)/4-1BB negative and reactive (R)/4-1BB positive samples. (G) Table shows the 3 reconstructed TCR pairs for these 3 clones which were screened for immune reactivity. The data analysis presented in panels C–F was derived from expanded 4-1BB+ T cells, which were exclusively available from the HCC05 patient lymph node. CDR3, complementarity-determining region; Mut, mutant; SBNO2-R (reactive) SBNO2-NR (non-reactive); ;TCR, T cell receptor; WT, wild-type.
Figure 4
Figure 4. Evaluation of reconstructed TCRs for neoantigen-reactivity and functionality. (A) FACS plots show the 4-1BB expression on total CD4+ and CD8+ T cells following 24h stimulation of mTCR1- and mTCR3-engineered T cells with mutant and wild-type SBNO2 peptides. Reactivity on both CD4+ and CD8+ T cells indicate a co-receptor independent stimulation of the TCRs. Production of IFNg, TNFa, IL-2 and CD107a expression on (B) CD4+ and (C) CD8+ cells for mTCR1- and mTCR3-modified T cells after stimulation with mutant and wild-type peptides. Mock (untransduced) T cells were used as negative control. (D) Avidity of mTCR1 and mTCR3 was assessed based on percentage of 4-1BB expression on mTCRb+CD3+ T cells following peptide titration of mutant and wild-type peptides. All experiments presented in the panels were conducted exclusively using samples from the HCC05 lymph node. Mut, mutant; mTCR, murinized T cell receptor; TCR, T cell receptor; WT, wild-type.
Figure 5
Figure 5. Transcriptomic and proteomic characterization of neoantigen-reactive TCRs. (A) UMAP visualisation and distribution of T cell clusters 0-2 between SBNO2-p and SBNO2-n samples. (B) Stack bar plot showing the proportion of each cluster 0-2 between reactive and non-reactive SBNO2 samples. (C) UMAP localisation of TCR clones A (mTCR1), B (mTCR3) and C (mTCR2) that were previously assessed for neoantigen reactivity. (D) Ridge plots with protein expression of markers measured by antibody-derived tags for T cell clusters 0 to 2. (E) Violin plots showing the expression levels for representative gene markers for clusters 0 to 2. All experiments presented in the panels were conducted exclusively using samples from the HCC05 lymph node.

References

    1. Llovet JM, Kelley RK, Villanueva A, et al. Hepatocellular carcinoma. Nat Rev Dis Primers. 2021;7:6. doi: 10.1038/s41572-020-00240-3. - DOI - PubMed
    1. Gao Y-X, Ning Q-Q, Yang P-X, et al. Recent advances in recurrent hepatocellular carcinoma therapy. World J Hepatol. 2023;15:460–76. doi: 10.4254/wjh.v15.i4.460. - DOI - PMC - PubMed
    1. Llovet JM, Ricci S, Mazzaferro V, et al. Sorafenib in advanced hepatocellular carcinoma. N Engl J Med. 2008;359:378–90. doi: 10.1056/NEJMoa0708857. - DOI - PubMed
    1. El-Khoueiry AB, Sangro B, Yau T, et al. Nivolumab in patients with advanced hepatocellular carcinoma (CheckMate 040): an open-label, non-comparative, phase 1/2 dose escalation and expansion trial. Lancet. 2017;389:2492–502. doi: 10.1016/S0140-6736(17)31046-2. - DOI - PMC - PubMed
    1. Topalian SL, Drake CG, Pardoll DM. Immune checkpoint blockade: a common denominator approach to cancer therapy. Cancer Cell. 2015;27:450–61. doi: 10.1016/j.ccell.2015.03.001. - DOI - PMC - PubMed

Substances